Peritoneal dialysis (PD) is an established and beneficial replacement treatment for patients affected by end-stage renal disease (ESRD).1 Long-term peritoneal dialysis (PD) is associated with the progressive development of functional and structural alterations of the peritoneal membrane affecting the outcome, such as angiogenesis, the formation of new blood vessels from pre-existing endothelium.1 Vascular endothelial growth factor (VEGF), an angiogenic and vascular permeability factor, is a major mediator of increased angiogenesis.2
The aim of this study was to examine the factors influencing the serum (s) and drained dialysate (dd) VEGF concentrations in chronic PD patients and their correlations with biochemical findings, quality of PD, peritoneal membrane transport rate, dialysis modality and vintage, peritonitis and diabetes mellitus, use of erythropoietin stimulating agents (ESA), angiotensin-converting enzyme inhibitors (ACEi) and statins. The observational study included 63 prevalent patients (39 males, 24 females), middle age 61.97±11.01 years, treated with PD during 24±18 months, using conventional low pH (5.5) peritoneal dialysate solutions with glucose concentration 1.25–2.76% at the Clinic of Nephrology, Clinical Centre of Serbia in Belgrade, Serbia. Fifty-three (84.5%) patients were on continuous ambulatory peritoneal dialysis (CAPD), 6 (9.5%) on automated peritoneal dialysis (APD) and 4 (4.5%) on cycling peritoneal dialysis, i.e. manual day dwells with dry period during the night (CCPD). Patients were free of peritonitis and clinical or laboratory signs of any infection at least 4 weeks before they were enrolled; 31 (49.2%) patients were affected by diabetes mellitus; 38 (60.3%) patients had one or more episodes of peritonitis; 41 (65%) patients received ESA, 46 (73%) ACEi and 12 (19%) statins.
Samples of serum, urine and peritoneal effluent were collected in the morning, before meal. Biochemical findings were analysed with the ARCHITECT ci8200, Abbott Diagnostics, Wiesbaden, Germany analyser. Kt/V, creatinine clearance (ClCr), normalised protein catabolic rate (nPCR), D/D0, D/P and residual renal function (RRF) were assessed according to guidelines.3,4 VEGF was measured in serum and peritoneal effluent using sandwich enzyme-linked immunoadsorbent assay (ELISA) kits (Quantikine® Human VEGF, R&D Systems, USA & Canada). The intra and the inter-assay variability were 2.6% and 9.8%. Lower detection level was 3.5pg/mL.
The study has been approved by the Ethical Committee of the School of Medicine, University of Belgrade, and the patients gave informed consent for participation in the study.
Results are expressed as means, SD, minimum, maximum and median values. Correlations between variables were analysed by Pearson correlation test and Spearman rank correlation coefficient. The predictive value of different variables for VEGF levels was assessed with multivariate linear regression analysis. Statistical analysis was performed with SPSS 20.0.
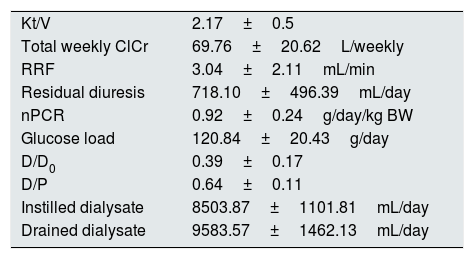
The patients performed adequate dialysis (Table 1).
Dialysis quality parameters.
| Kt/V | 2.17±0.5 |
| Total weekly ClCr | 69.76±20.62L/weekly |
| RRF | 3.04±2.11mL/min |
| Residual diuresis | 718.10±496.39mL/day |
| nPCR | 0.92±0.24g/day/kg BW |
| Glucose load | 120.84±20.43g/day |
| D/D0 | 0.39±0.17 |
| D/P | 0.64±0.11 |
| Instilled dialysate | 8503.87±1101.81mL/day |
| Drained dialysate | 9583.57±1462.13mL/day |
ClCr – creatinine clearance, RRF – residual renal function, nPCR – normalised protein catabolic rate, BW – body weight.
The sVEGF concentration was 231.84±173.91pg/mL (range 15.6–958.92pg/mL) and ddVEGF concentration was 38.89±49.38pg/mL (range 15.6–223.8pg/mL) and they correlated significantly (R=0.378, p=0.002).
Serum VEGF concentration correlated significantly with glycemia (R=0.362, p=0.004), fibrinogen (R=0.267, p=0.034) and transferrin saturation (R=0.272, p=0.031); ddVEGF concentration correlated with serum cholesterol (R=0.360, p=0.004).
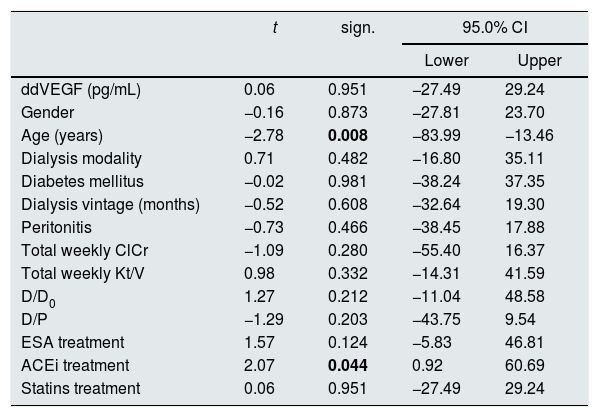
In a model of multivariate linear regression analysis, patients’ gender and age up to/over 65 years, dialysis modality (continuous peritoneal dialysis versus intermittent modalities with dry interval during the 24h), diabetes mellitus, peritoneal dialysis duration up to/over 5 years, peritonitis, total weekly ClCr up to/over 70L, total weekly Kt/V up to/over 1.7, D/D0 up to/over 0.43, D/P up to/over 0.65, therapy with ESA, ACEi and statins were not significantly predictive for concentrations of VEGF in serum. In the same model age over 65 years (p=0.008) and ACEi therapy were predictive (p=0.044) of lower drained dialysate concentrations of VEGF (Table 2).
Predictive value of the observed variables for concentrations of vascular endothelial growth factor in drained dialysate (ddVEGF).
| t | sign. | 95.0% CI | ||
|---|---|---|---|---|
| Lower | Upper | |||
| ddVEGF (pg/mL) | 0.06 | 0.951 | −27.49 | 29.24 |
| Gender | −0.16 | 0.873 | −27.81 | 23.70 |
| Age (years) | −2.78 | 0.008 | −83.99 | −13.46 |
| Dialysis modality | 0.71 | 0.482 | −16.80 | 35.11 |
| Diabetes mellitus | −0.02 | 0.981 | −38.24 | 37.35 |
| Dialysis vintage (months) | −0.52 | 0.608 | −32.64 | 19.30 |
| Peritonitis | −0.73 | 0.466 | −38.45 | 17.88 |
| Total weekly ClCr | −1.09 | 0.280 | −55.40 | 16.37 |
| Total weekly Kt/V | 0.98 | 0.332 | −14.31 | 41.59 |
| D/D0 | 1.27 | 0.212 | −11.04 | 48.58 |
| D/P | −1.29 | 0.203 | −43.75 | 9.54 |
| ESA treatment | 1.57 | 0.124 | −5.83 | 46.81 |
| ACEi treatment | 2.07 | 0.044 | 0.92 | 60.69 |
| Statins treatment | 0.06 | 0.951 | −27.49 | 29.24 |
ClCr – creatinine clearance; ESA – erythropoiesis stimulating agents; ACEi – angiotensin converting enzyme inhibitor; R – coefficient of correlation; sign. – significance; CI – confidence interval.
The bold values in Table 2 are signifficantly values.
The significant correlation between the sVEGF and fibrinogen and glycemia, as well as ddVEGF and cholesterolemia seem to be indicative of higher VEFG concentrations in worse metabolic profile. Other studies also showed direct correlation between serum VEGF concentration and chronic inflammatory state, defined by plasma interleukin 6, CRP and fibrinogen levels in patients.5,6
A variety of factors influence the VEGF serum concentration.5–7 Demographic factors, quality and modality of dialysis, comorbidities, applied therapy, glucose dialysate solutions load, dialysis duration did not influence sVEGF concentration in our study. Recent studies showed that genetic polymorphism may affect serum VEGF concentrations, which might explain the variety of findings in different trials.8
Tricky is the predictive value of older age for lower ddVEGF concentrations, requiring further evaluation. Important is the finding of significant predictive value of ACEi therapy for lower ddVEGF concentration, as ACE inhibition is known to preserve peritoneal membrane function and prevent morphological changes in experimental PD rat models on high-glucose dialysis solutions,9 and in human pathology, a decrease of small solutes transport rate has been demonstrated on chronic PD and ACEi and/or angiotensin-receptor blockers treatment.10


