


Data regarding vascular calcification (VC) in contemporary peritoneal dialysis (PD) patients is scarce. Bone–vascular axis has been demonstrated in hemodialysis (HD). However, studies showing the link between bone disease and VC in PD patients are lacking. The role of sclerostin, dickkopf-related protein 1 (DKK-1), receptor activator for nuclear factor kB ligand and osteoprotegerin (OPG) in VC in PD remains to clarify.
Materials and methodsBone biopsy was performed in 47 prevalent PD patients with histomorphometric analysis. Patients were submitted to pelvis and hands X-ray to evaluate VC using the Adragão score (AS). Relevant clinical and biochemical data was collected.
ResultsThirteen patients (27.7%) had positive AS (AS≥1). Patients with VC were significantly older (58.9 vs. 50.4 years, p=0.011), had a lower dialysis dose (KT/V 2.0 vs. 2.4, p=0.025) and a higher glycosylated hemoglobin (7.2 vs. 5.4%, p=0.001). There was not any laboratorial parameter of mineral and bone disease used in clinical practice different between patients with or without VC. All diabetic patients had VC but only 8.1% of non-diabetic had VC (p<0.001). Patients with VC showed significantly higher erythrocyte sedimentation rate (ESR) (91.1 vs. 60.0mm/h, p=0.001), sclerostin (2250.0 vs. 1745.8pg/mL, p=0.035), DKK-1 (1451.6 vs. 1042.9pg/mL, p=0.041) and OPG levels (2904.9 vs. 1518.2pg/mL, p=0.002). On multivariate analysis, only ESR remained statistically significant (OR 1.07; 95% CI 1.01–1.14; p=0.022). Bone histomorphometric findings were not different in patients with VC. There was no correlation between bone formation rate and AS (r=−0.039; p=0.796).
ConclusionThe presence of VC was not associated with bone turnover and volume evaluated by bone histomorphometry. Inflammation and diabetes seem to play a more relevant role in VC in PD.
Los datos sobre calcificación vascular (CV) en pacientes contemporáneos en diálisis peritoneal (DP) son escasos. En pacientes en hemodiálisis, se ha demostrado la existencia de una conexión entre hueso y sistema vascular; sin embargo, faltan estudios que muestren el vínculo entre la enfermedad ósea y la CV en pacientes en DP. Si la esclerostina, la proteína relacionada con Dickkopf 1 (DKK-1), el ligando del receptor activador para el factor nuclear κB (RANKL) y la osteoprotegerina (OPG) tienen un papel en la CV en pacientes en DP aún no está claro.
Materiales y métodosSe realizó biopsia ósea en 47 pacientes prevalentes en DP y se analizó mediante histomorfometría. También se tomaron radiografías de pelvis y manos a los pacientes para evaluar la CV mediante el Índice de Adragão (IA). Además, se analizaron datos clínicos y bioquímicos relevantes.
ResultadosTrece pacientes (27,7%) tuvieron IA positivo (IA ≥ 1). Los pacientes con CV eran significativamente mayores (58,9 vs 50,4 años, p=0,011) tenían menor dosis de diálisis (KT/V 2,0 vs 2,4, p=0,025) y niveles más elevados de hemoglobina glicosilada (7,2 vs 5,4%, p=0,001). No hubo ningún parámetro de laboratorio de enfermedad mineral y ósea utilizado en la práctica clínica diferente entre pacientes con o sin CV. Todos los pacientes diabéticos mostraron CV, sin embargo, solo el 8,1% de los no diabéticos tenían CV (p <0,001). Además, los pacientes con CV mostraron una velocidad de sedimentación globular más elevada (VSG) (91,1 vs. 60,0mm/h, p=0,001) y mayores concentraciones séricas de esclerostina (2.250,0 vs. 1.745,8 pg/ml, p=0,035), DKK-1 (1451,6 vs 1042,9 pg/ml, p=0,041) y OPG (2.904,9 vs. 1.518,2 pg/ml, p=0,002). En el análisis multivariante, solo la VSG fue estadísticamente significativa (OR 1,07; IC del 95%: 1,01-1,14; p=0,022). La presencia de CV no se relacionó con una histomorfometría ósea diferente en estos pacientes. Tampoco se observó correlación entre la tasa de formación ósea y el IA (r=–0,039; p=0,796).
ConclusiónEn este estudio, la presencia de CV no se asoció con un recambio óseo o un volumen óseo diferente evaluado mediante histomorfometría ósea. La inflamación y la diabetes parecieron tener un papel más relevante en la CV en pacientes en DP.
Vascular calcification (VC) is highly prevalent in patients with chronic kidney disease (CKD) and is associated with increased cardiovascular morbidity and mortality.1,2 Vascular calcification is part of chronic kidney disease-mineral and bone disorder (CKD-MBD), a systemic disorder of mineral and bone metabolism due to CKD, which is manifested by abnormalities in bone, mineral metabolism and/or extra-skeletal calcification.3 Vascular calcification is poorly studied in contemporary peritoneal dialysis (PD) populations, namely in patients treated with low calcium concentration in dialysate.
Bone-vascular axis is an accepted concept in the Nephrology community. It refers to the bidirectional relationship between bone disease and VC in CKD – disorders of bone turnover and/or bone volume can influence the risk of VC.4 Clinical studies including patients evaluated with bone biopsies showed that low bone turnover5 and low bone volume6 were associated with a high calcification score in hemodialysis (HD) patients. However, data showing this link between bone disease and VC in PD patients is lacking.
Inhibitors of Wnt signaling pathway [sclerostin, dickkopf-related protein 1 (DKK-1)] and receptor activator for nuclear factor kB (RANK)/RANK ligand (RANK-L)/osteoprotegerin (OPG) system have been linked to the bone-vascular axis.4 However, this bone derived molecules are poorly studied in PD, especially its relationship with vascular calcification. Also, studies reporting the association between fibroblast growth factor-23 (FGF-23) and VC in DP yielded contradictory results.7,8
Our group previously published the results of the histomorphometric analysis of bone biopsies in 49 PD patients.9 We reported the prevalence of different forms of renal osteodystrophy and the association between bone histology findings and clinical and analytical data. The purpose of the present work is to evaluate the prevalence and severity of VC in this same cohort of patients submitted to bone biopsy, using the previously described simple vascular calcification semi-quantitative score – the Adragão score (AS) – and its relationship with bone biopsy findings in prevalent contemporary PD patients. Also, we studied the association between VC and classic bone turnover markers used in Nephrology practice and novel relevant molecules in bone metabolism.
Material and methodsStudy design and populationAdult patients undergoing PD in our institution at least for 90 days were evaluated in this cross-sectional study. Exclusion criteria were: history of kidney transplant or parathyroidectomy; previous hemodialysis; treatment with bisphosphonates, corticoids or anticonvulsants; patient unable to give informed consent and bedridden patients. All patients meeting the inclusion and without exclusion criteria were consecutively invited to participate in the study. The patients were recruited between January 2018 and November 2019. All patients gave written informed consent. The study adhered Declaration of Helsinki and it was approved by institutional ethics committee.
Physioneal® glucose biocompatible PD solutions (Baxter, Baxter Corporation, Ontario, Canada) with calcium concentration of 1.25mmol/L were prescribed to the patients. Physioneal® glucose PD solutions containing calcium concentration of 1.75mmol/L are not used in our PD program. Thirty-seven patients (78.7%) had also one dwell with Extraneal® (Baxter, Baxter Corporation, Ontario, Canada), an icodextrin PD solution with calcium concentration of 1.75mmol/L.
Calcification scoreTo evaluate VC, the simple vascular calcification Adragão score was used. The Adragão score was calculated using plain radiographic films of pelvis and hands performed according to the original description of this score.10 The pelvis radiographic films were divided in four sections by two imaginary lines – a horizontal line over the upper limit of femoral heads and a median vertical line over the vertebral column. The hands radiographic films were divided (each hand) by horizontal line over the upper limit of metacarpal bones. The presence of linear calcifications in each section was counted as 1 and its absence as 0. We also explore the data of patients with Adragão score ≥3 comparing with patients with Adragão score <3. This was done because Adragão score ≥3 was associated with a higher cardiovascular mortality in HD patients.10
Serum biomarkersFasting blood samples were collected at the time of bone biopsy. Serum levels of calcium, phosphorus, albumin, urea, creatinine and alkaline phosphatase (ALP) were measured using an Olympus AU5400 analyzer (Olympus America, Center Valley, PA, USA). Dialysate concentration of urea, creatinine and albumin were measured using the same methodology. Serum iPTH and 25-hydroxyvitamin D (25(OH)D) levels were assessed through an electrochemiluminescence immunoassay with a Cobas E411 analyzer (Roche Diagnostics, Mannheim, Germany).
Sclerostin (bioactive sclerostin) was measured in plasma samples by an enzyme immunoassay (Biomedica Medizinprodukte GmbH, Wien, Austria), according to the manufacturer's instructions (detection range of 43.18–7272.73pg/mL). Free serum RANK-L (sRANK-L) was measured in plasma samples by an enzyme immunoassay (Biomedica Medizinprodukte GmbH, Wien, Austria), according to the manufacturer's instructions (detection range 0.2–40pg/mL).
OPG, DKK-1 and intact FGF-23 were measured in plasma samples by a multiplex assay (Magnetic Luminex Assay, R&D Systems Inc., Minneapolis, MN, USA), according to the manufacturer's protocol (detection range of 75–18,220pg/mL, 202–49,060pg/mL and 11.8–2870pg/mL, respectively).
Transiliac bone biopsy and histomorphometryAll patients were submitted to a transiliac bone biopsy using a modified Bordier trephine. Bone biopsy was performed 3–5 days after a double course of tetracycline – doxycycline 100mg twice daily for 3 days, repeated after an interval of 12 days. Doxycycline was the only tetracycline available in our country at the time of this study.
Biopsy specimens were 5–7mm in diameter by 10mm in length. Bone was dehydrated in alcohol, cleared with xylene and embedded in methyl methacrylate. Undecalcified 5μm sections were cut and stained with modified Masson-Goldner trichrome for static histomorphometric evaluation. Unstained 10μm sections were prepared for fluorescent microscopy analysis of dynamic parameters.
All histomorphometric analysis were performed by a single operator. Samples were considered suitable for histomorphometric evaluation only if it was possible to read without artifacts 30 fields under 200× magnification.
According to KDIGO guidelines,3 renal osteodystrophy (ROD) was classified analyzing turnover, mineralization and volume (TMV classification) in: osteomalacia (low turnover, abnormal mineralization), adynamic bone disease (low turnover, normal mineralization), mixed uremic osteodystrophy (high turnover, abnormal mineralization) hyperparathyroid-related bone disease (high turnover, normal mineralization).
Bone volume was considered normal if bone volume/tissue volume (BV/TV)>20%; normal turnover range was considered when bone formation rate/bone surface (BFR/BS) was between 18 and 38ym3/ym2/year.11 Mineralization was abnormal when mineralization lag time (MLT) was higher than 100 days.
Statistical analysisContinuous variables were expressed as mean±standard deviation (SD) or median (interquartile range) if normally or non-normally distributed, respectively. Categorical variables were represented by absolute and relative frequencies. Comparisons between patients with and without vascular calcification were performed using Chi-square test for categorical variables and Student's t-test or Mann–Whitney U test for continuous variables whether normally or non-normally distributed, respectively. The variables significantly different between groups were included in a multivariable logistic regression model to determine their independent association with vascular calcification. To assess the accuracy of each serum biomarker for diagnosing vascular calcification (versus no vascular calcification) and significant vascular calcification (versus no significant vascular calcification), ROC curves and AUC estimates were determined. Youden's J statistic was used to estimate the optimal cut-point for each serum biomarker and sensitivity, specificity, positive and negative predictive values were calculated. The correlation between Adragão score and bone formation and between ESR and serum biomarkers was assessed using the Spearmen test. For all analyses, two-sided p values of <0.05 were considered statistically significant. Stata version 14 (Stata Corp. CollegeStation, TX) was used.
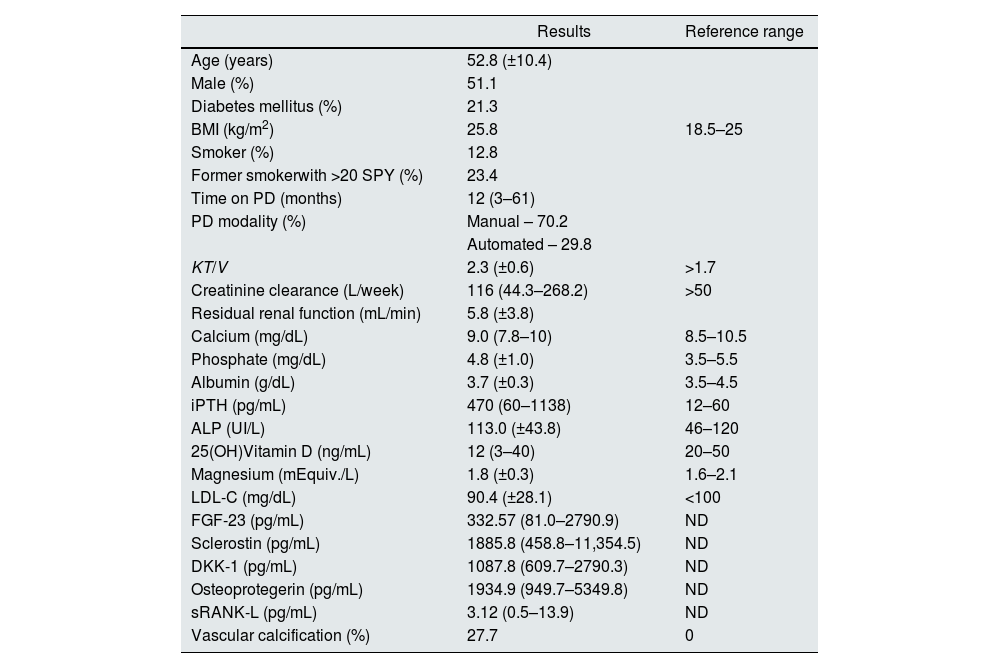
ResultsClinical and laboratory baseline characteristicsForty-seven patients were submitted to bone biopsy and pelvis and hands X-ray. As mentioned before, the results of bone histomorphometric analysis were previously reported. There were no complications related to the bone biopsy procedure. Clinical and biochemical characteristics of the patients included are summarized in Table 1.
Demographics, biomarkers, and other general characteristics in 47 peritoneal dialysis patients submitted to a bone biopsy and evaluation of vascular calcification.
| Results | Reference range | |
|---|---|---|
| Age (years) | 52.8 (±10.4) | |
| Male (%) | 51.1 | |
| Diabetes mellitus (%) | 21.3 | |
| BMI (kg/m2) | 25.8 | 18.5–25 |
| Smoker (%) | 12.8 | |
| Former smokerwith >20 SPY (%) | 23.4 | |
| Time on PD (months) | 12 (3–61) | |
| PD modality (%) | Manual – 70.2 | |
| Automated – 29.8 | ||
| KT/V | 2.3 (±0.6) | >1.7 |
| Creatinine clearance (L/week) | 116 (44.3–268.2) | >50 |
| Residual renal function (mL/min) | 5.8 (±3.8) | |
| Calcium (mg/dL) | 9.0 (7.8–10) | 8.5–10.5 |
| Phosphate (mg/dL) | 4.8 (±1.0) | 3.5–5.5 |
| Albumin (g/dL) | 3.7 (±0.3) | 3.5–4.5 |
| iPTH (pg/mL) | 470 (60–1138) | 12–60 |
| ALP (UI/L) | 113.0 (±43.8) | 46–120 |
| 25(OH)Vitamin D (ng/mL) | 12 (3–40) | 20–50 |
| Magnesium (mEquiv./L) | 1.8 (±0.3) | 1.6–2.1 |
| LDL-C (mg/dL) | 90.4 (±28.1) | <100 |
| FGF-23 (pg/mL) | 332.57 (81.0–2790.9) | ND |
| Sclerostin (pg/mL) | 1885.8 (458.8–11,354.5) | ND |
| DKK-1 (pg/mL) | 1087.8 (609.7–2790.3) | ND |
| Osteoprotegerin (pg/mL) | 1934.9 (949.7–5349.8) | ND |
| sRANK-L (pg/mL) | 3.12 (0.5–13.9) | ND |
| Vascular calcification (%) | 27.7 | 0 |
Data is presented as mean (±standard deviation) for normal distribution variables and median (range) for non-normal distribution variables. Abbreviations: ALP, alkaline phosphatase; DKK-1, dickkopf-related protein 1; FGF-23, fibroblast growth factor-23; iPTH, intact parathormone; LDL-C, low density lipoprotein cholesterol; PD, peritoneal dialysis; ND, not defined; SPY, smoking pack years; sRANK-L, soluble receptor activator of nuclear factor kB ligand.
Most frequent CKD etiology was polycystic kidney disease (23.4%) followed by uncertain (21.3%) and diabetic nephropathy (19.1%).
Most of patients were treated with icodextrin (Extraneal®). The results were not different between patients with or without icodextrin in their dialysis prescription (data not shown).
Phosphate binders were prescribed in 78.7% of patients (36.2% calcium-based phosphate binders; aluminum salts were not used). To treat secondary hyperparathyroidism, active vitamin D was prescribed in 66% of patients (calcitriol or alfacalcidol; no patient was treated with paricalcitol) and cinacalcet in 27.7%. Thirty-four percent of patients were taking cholecalciferol. Calcium, phosphate and iPTH levels were within the recommended KDIGO12 target range in 93.6%, 76.6% and 68.1% of patients, respectively.
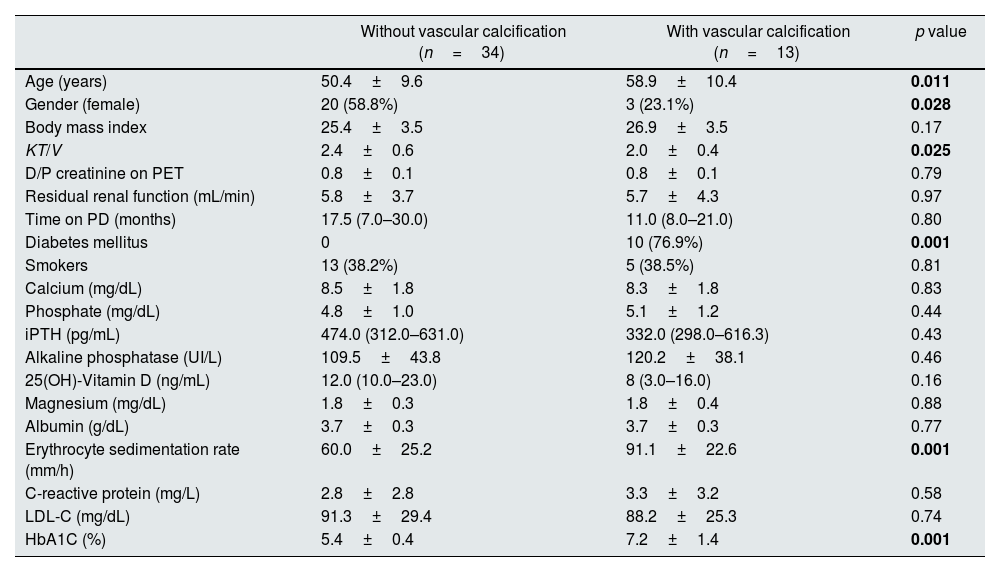
Vascular calcificationThirteen patients (27.7%) had VC on X-ray. Median Adragão score was 3 (1–8) in calcified patients. Clinical and biochemical characteristics of patients with or without VC are depicted in Table 2.
Clinical and biochemical data of patients with and without vascular calcification.
| Without vascular calcification (n=34) | With vascular calcification (n=13) | p value | |
|---|---|---|---|
| Age (years) | 50.4±9.6 | 58.9±10.4 | 0.011 |
| Gender (female) | 20 (58.8%) | 3 (23.1%) | 0.028 |
| Body mass index | 25.4±3.5 | 26.9±3.5 | 0.17 |
| KT/V | 2.4±0.6 | 2.0±0.4 | 0.025 |
| D/P creatinine on PET | 0.8±0.1 | 0.8±0.1 | 0.79 |
| Residual renal function (mL/min) | 5.8±3.7 | 5.7±4.3 | 0.97 |
| Time on PD (months) | 17.5 (7.0–30.0) | 11.0 (8.0–21.0) | 0.80 |
| Diabetes mellitus | 0 | 10 (76.9%) | 0.001 |
| Smokers | 13 (38.2%) | 5 (38.5%) | 0.81 |
| Calcium (mg/dL) | 8.5±1.8 | 8.3±1.8 | 0.83 |
| Phosphate (mg/dL) | 4.8±1.0 | 5.1±1.2 | 0.44 |
| iPTH (pg/mL) | 474.0 (312.0–631.0) | 332.0 (298.0–616.3) | 0.43 |
| Alkaline phosphatase (UI/L) | 109.5±43.8 | 120.2±38.1 | 0.46 |
| 25(OH)-Vitamin D (ng/mL) | 12.0 (10.0–23.0) | 8 (3.0–16.0) | 0.16 |
| Magnesium (mg/dL) | 1.8±0.3 | 1.8±0.4 | 0.88 |
| Albumin (g/dL) | 3.7±0.3 | 3.7±0.3 | 0.77 |
| Erythrocyte sedimentation rate (mm/h) | 60.0±25.2 | 91.1±22.6 | 0.001 |
| C-reactive protein (mg/L) | 2.8±2.8 | 3.3±3.2 | 0.58 |
| LDL-C (mg/dL) | 91.3±29.4 | 88.2±25.3 | 0.74 |
| HbA1C (%) | 5.4±0.4 | 7.2±1.4 | 0.001 |
Data is presented as mean (±standard deviation) for normal distribution variables and median (interquartile range) for non-normal distribution variables. Abbreviations: D/P, ratio dialysate/plasma; HbA1C, glycosylated hemoglobin; iPTH, intact parathyroid hormone; LDL-C, low-density lipoprotein cholesterol; PD, peritoneal dialysis; PET, peritoneal equilibration test.
Patients with VC on X-ray were significantly older (58.9 vs. 50.4 years, p=0.011), had a lower dialysis dose (KT/V 2.0 vs. 2.4, p=0.025) and a higher glycosylated hemoglobin (7.2 vs. 5.4%, p=0.001).
All diabetic patients had VC detectable on X-ray but only 8.1% (n=3) of non-diabetic patients had VC (p<0.001). Within diabetic patients, 90% (n=9) were male.
There was not any laboratorial parameter of mineral and bone disease used in clinical practice different between patients with or without VC. Mineral and bone disorders related treatments were not different in patients with VC. Phosphate binders were prescribed in 82.4% of patients with VC compared to 69.2% in patients without VC (p=0.34). Calcium-based phosphate binders were prescribed in 32.4% of patients with VC compared to 46.2% in patients without VC (p=0.39). Also treatment with nutritional vitamin D, active vitamin D, calcimimetics (cinacalcet) was not significantly different in patients with VC.
Ten patients (21.3%) had VC with Adragão score ≥3 on X-ray. Clinical and biochemical characteristics of patients with Adragão score ≥3 are found in supplemental Tables 1 and 2. The differences between the clinical and biochemical characteristics of patients with or without Adragão score ≥3 is similar to those found in patients with or without VC. However, it is worth to mention that age and sclerostin are no longer significantly different in patients with or without Adragão score ≥3.
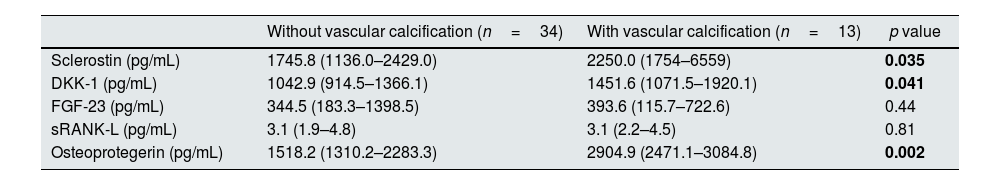
Vascular calcification and laboratory dataThe comparison of laboratory data in patients with and without VC is found in Table 2 for common markers used in clinical practice and in Table 3 for other molecules including inhibitors of Wnt signaling pathway, RANK-L/OPG system and FGF-23.
Inhibitors of Wnt signaling pathway, RANK-L/OPG system and FGF-23 in patients with and without vascular calcification.
| Without vascular calcification (n=34) | With vascular calcification (n=13) | p value | |
|---|---|---|---|
| Sclerostin (pg/mL) | 1745.8 (1136.0–2429.0) | 2250.0 (1754–6559) | 0.035 |
| DKK-1 (pg/mL) | 1042.9 (914.5–1366.1) | 1451.6 (1071.5–1920.1) | 0.041 |
| FGF-23 (pg/mL) | 344.5 (183.3–1398.5) | 393.6 (115.7–722.6) | 0.44 |
| sRANK-L (pg/mL) | 3.1 (1.9–4.8) | 3.1 (2.2–4.5) | 0.81 |
| Osteoprotegerin (pg/mL) | 1518.2 (1310.2–2283.3) | 2904.9 (2471.1–3084.8) | 0.002 |
Data is presented as mean (±standard deviation) for normal distribution variables and median (interquartile range) for non-normal distribution variables. Abbreviations: DKK-1, dickkopf-related protein 1; FGF-23, fibroblast growth factor 23; sRANK-L, soluble receptor activator of nuclear factor kB ligand.
Patients with VC on X-ray had significantly higher ESR (91.1 vs. 60.0mm/h, p=0.001), higher sclerostin plasma levels (2250.0 vs. 1745.8pg/mL, p=0.035), higher DKK-1 plasma levels (1451.6 vs. 1042.9pg/mL, p=0.041) and higher OPG levels (2904.9 vs. 1518.2pg/mL, p=0.002). On multivariable logistic regression analysis (supplemental Table 3), only ESR remained statistically significant (OR 1.07; 95% confidence interval 1.01–1.14; p=0.022). No correlation was found between ESR and body mass index (R=0.130; p=0.378); also, ESR were not associated with albumin levels (R=−0.214; p=0.144). ESR did not correlate with any histomorphometric parameters, namely with BV/TV (R=−0.07, p=0.652), BFR/BS (R=0.239, p=0.101) and MLT (R=−0.125, p=0.408).
Diabetic patients had a higher ESR compared to non-diabetics (88.9mm/h vs. 63.2mm/h, p=0.012). ESR had significant correlation with sclerostin (R=0.413, p=0.004) and OPG levels (R=0.495, p<0.001) but not with DKK-1 (R=0.114, p=0.452) (Fig. 1).

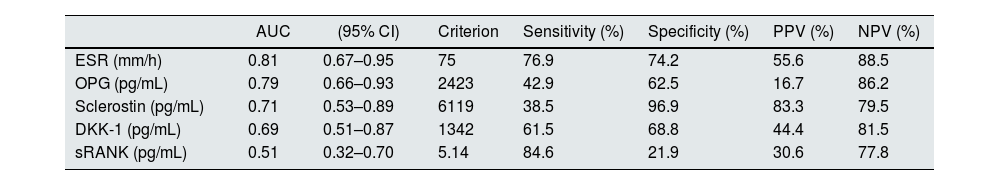
The performance of the several molecules evaluated in this study for the diagnosis of VC is represented in Fig. 2 and Table 4. ESR had the best area under curve (AUC) of 0.81, with sensitivity 76.9%, specificity 74.2%, positive predictive value 55.6% and negative predictive value 88.5% for the presence of VC on X-ray with a cut-off >75mm/h.
, erythrocyte sedimentation rate (ESR), osteoprotegerin (OPG), serum receptor activator for nuclear factor kB (sRANK-L).")
Sensitivity, specificity, positive predictive value, negative predictive value of serum biomarkers in the diagnosis of vascular calcification.
| AUC | (95% CI) | Criterion | Sensitivity (%) | Specificity (%) | PPV (%) | NPV (%) | |
|---|---|---|---|---|---|---|---|
| ESR (mm/h) | 0.81 | 0.67–0.95 | 75 | 76.9 | 74.2 | 55.6 | 88.5 |
| OPG (pg/mL) | 0.79 | 0.66–0.93 | 2423 | 42.9 | 62.5 | 16.7 | 86.2 |
| Sclerostin (pg/mL) | 0.71 | 0.53–0.89 | 6119 | 38.5 | 96.9 | 83.3 | 79.5 |
| DKK-1 (pg/mL) | 0.69 | 0.51–0.87 | 1342 | 61.5 | 68.8 | 44.4 | 81.5 |
| sRANK (pg/mL) | 0.51 | 0.32–0.70 | 5.14 | 84.6 | 21.9 | 30.6 | 77.8 |
Abbreviations: AUC, area under curve; CI, confidence interval; DKK-1, dickkopf-related protein 1; NPV, negative predictive value; OPG, osteoprotegerin; PPV, predictive positive value; ESR, erythrocyte sedimentation rate; sRANK-L, soluble receptor activator of nuclear factor kB ligand.
Comparison between patients with Adragão score ≥3 and patients with Adragão score <3 was also made. The results were similar except for sclerostin that was no longer significantly different (supplemental Table 2).
Vascular calcification and bone biopsyAccording to TMV classification, the patterns of renal osteodystrophy found were: adynamic bone in 42.5% of patients (n=20), hyperparathyroid-related bone disease in 27.7% (n=13), normal bone in 27.7% (n=13) and osteomalacia in 2.1% (one patient).
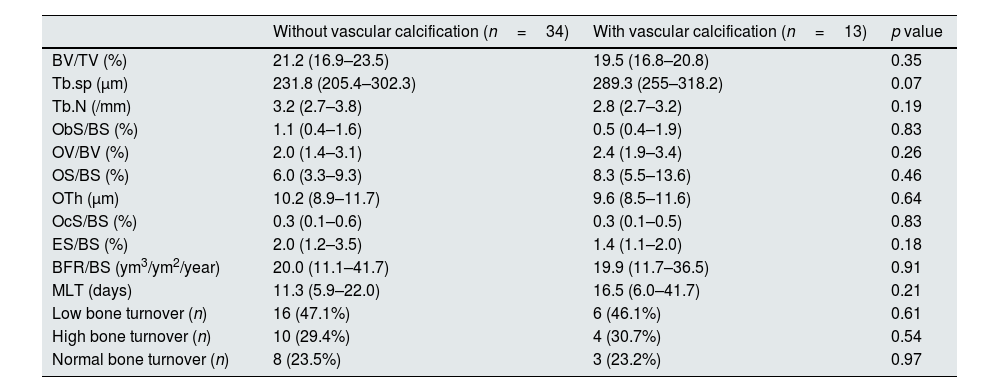
Histomorphometric data of patients according to the presence VC in X-ray is depicted in Table 5. Bone histomorphometric findings were not different in patients with VC. Trabecular separation tended to be higher in patients with VC (289.3 vs. 231.8μm, p=0.07) but bone volume and other structural parameters were not different between the groups. Also there was no correlation between bone volume and Adragão score (r=−0.165; p=0.290) and there was no correlation between bone turnover (evaluated by bone formation rate) and Adragão score (r=−0.039; p=0.796) as showed in Fig. 3.
Histomorphometric data of patients with and without vascular calcification.
| Without vascular calcification (n=34) | With vascular calcification (n=13) | p value | |
|---|---|---|---|
| BV/TV (%) | 21.2 (16.9–23.5) | 19.5 (16.8–20.8) | 0.35 |
| Tb.sp (μm) | 231.8 (205.4–302.3) | 289.3 (255–318.2) | 0.07 |
| Tb.N (/mm) | 3.2 (2.7–3.8) | 2.8 (2.7–3.2) | 0.19 |
| ObS/BS (%) | 1.1 (0.4–1.6) | 0.5 (0.4–1.9) | 0.83 |
| OV/BV (%) | 2.0 (1.4–3.1) | 2.4 (1.9–3.4) | 0.26 |
| OS/BS (%) | 6.0 (3.3–9.3) | 8.3 (5.5–13.6) | 0.46 |
| OTh (μm) | 10.2 (8.9–11.7) | 9.6 (8.5–11.6) | 0.64 |
| OcS/BS (%) | 0.3 (0.1–0.6) | 0.3 (0.1–0.5) | 0.83 |
| ES/BS (%) | 2.0 (1.2–3.5) | 1.4 (1.1–2.0) | 0.18 |
| BFR/BS (ym3/ym2/year) | 20.0 (11.1–41.7) | 19.9 (11.7–36.5) | 0.91 |
| MLT (days) | 11.3 (5.9–22.0) | 16.5 (6.0–41.7) | 0.21 |
| Low bone turnover (n) | 16 (47.1%) | 6 (46.1%) | 0.61 |
| High bone turnover (n) | 10 (29.4%) | 4 (30.7%) | 0.54 |
| Normal bone turnover (n) | 8 (23.5%) | 3 (23.2%) | 0.97 |
Data is presented as mean (±standard deviation) for normal distribution variables and median (interquartile range) for non-normal distribution variables. Abbreviations: BFR, bone formation rate; BS, bone surface; BV, bone volume; MLT, mineralization lag time; ObS, osteoblast surface; OcS, osteoclast surface; ES, eroded surface; OS, osteoid surface; OTh, osteoid thickness; OV, osteoid volume; TV, tissue volume; Tb.N, trabecular number; Tb.Sp, trabecular separation.

We reported the results of 47 contemporary prevalent PD patients mostly treated with low calcium PD solutions that were submitted to a bone biopsy with histomorphometric characterization according KDIGO guidelines and pelvis and hands X-ray. This represents the only study to evaluate the relationship between VC and bone disease using bone biopsy data in contemporary PD patients. Also, we presented the relationship between VC and novel relevant molecules in bone metabolism.
Bone histomorphometric parameters were not different in patients with VC. Specially, there was no association between VC and bone volume and with bone turnover. These results contrast with those from London et al. group.5 In their work, the arterial calcification score (evaluated with ultrasonography of several vascular territories) had an inverse correlation with osteoblastic surfaces (p=0.001) in HD patients; a high calcification score was linked to bone histomorphometric characteristics of low bone activity and adynamic bone disease. Also in HD patients, Asci et al. described a U-shaped relationship between coronary artery calcification (CAC) evaluated by multi-slice computed tomography (CT) and bone turnover evaluated by activation frequency.13 These studies support that bone turnover, namely low bone turnover, is associated with VC in HD. Adragão et al. performed bone biopsies and multi-slice CT in 38 HD patients.6 Low bone volume was a significant risk factor for coronary calcifications during early years of dialysis (but the effect was no longer statistically significant in patients on HD for more than 6 years). To our knowledge, there is no published study specifically designed to evaluate the association between VC and bone volume and turnover using bone biopsies in contemporary PD. According to our results, it seems that the bone-vascular axis in PD patients is not evident meaning that disorders of bone volume and turnover may be less relevant predisposing or causal factors of VC in this subpopulation of CKD patients. Future studies involving a larger number of patients are needed in order to confirm or refute this finding.
In our study, 27.7% of patients had VC on X-ray. Previous reports showed presence of CAC using CT in 53.5–59% of PD patients.14,15. When using X-ray, VC is detected in 41–79.7% of PD patients.8,16,17 Several factors associated with VC, namely differences in age and proportion of diabetic patients are similar in our series and the referred studies. However, all our patients were treated with PD solutions with calcium 1.25mmol/L (except for the icodextrin dwell). Other groups reported a higher prevalence of VC in PD even when using the same methodology (X-ray) but 43% of the patients included were treated with a PD solution containing 1.75 mmol/L.16 Although there is no definitive evidence that dialysate calcium concentration of 1.25mmol/L can prevent the progression of VC (namely in PD),18 there is data suggesting that patients treated with dialysate calcium concentration of 1.75mmol/L had worsening of arterial stiffness comparing with patients treated with dialysate calcium concentration of 1.25mmol/L.19 The authors speculate that this finding can be related to increased VC in the high calcium group.
Patients with VC on X-ray had significantly higher erythrocyte sedimentation rate. On multivariate analysis, only ESR remained with a statistically significant association with VC. Wang et al. reported a link between inflammation and VC.20 Patients with cardiac valve calcification had higher C-reactive protein (CRP) (4.5 vs. 0.2mg/L, p=0.003), higher fibrinogen (6.6 vs. 5.7g/L, p=0.002) and lower serum albumin (26 vs. 29g/L, p=0.004). Also, among patients with high calcium×phosphate product (>5mmol2/L2), 85% of patients had VC when inflammation and malnutrition was present, but VC was present in 25% of patients without inflammation or malnutrition. Even in patients with low calcium×phosphate product (<5mmol2/L2) the presence of inflammation and malnutrition was associated with a prevalence of VC 2× higher. Stompor et al. showed similar results using CT scan to evaluate CAC in 43 PD patients.15 Patients with Agatston score >400units had higher levels of interleukin-6, basic FGF and CRP compared with patients with Agatston score <100units. Together, these results suggest that in PD patients, inflammation may be the most relevant factor associated with VC. Studies specially designed to prospectively evaluate the exact role of inflammation in PD patients and possible therapeutic interventions are needed.
In the present study, all diabetic patients had VC detectable on X-ray compared to only 8.1% of non-diabetics. Diabetes mellitus is a known risk factor for VC in general population and in CKD.21 It is possible that a higher degree of inflammation in diabetics could be the major explanation. However, advanced glycation end products (AGEs) may also contribute per se to this very high risk of VC in DM. In a recent paper, Fonseca et al. reported a significant association between CAC and the accumulation of AGEs in skin and serum in PD patients (R=0.64, p=0.04).22 A potential role of AGEs in diabetes-mediated VC has been proposed.23 AGEs can promote VC though increased oxidative stress resulting in phenotypic switch of vascular smooth muscle cells to osteoblast-like cells; also AGEs influence both cellular and systemic responses to increase bone matrix proteins.
Most pre-clinical studies support a pro-calcific effect of RANKL and a protective role of OPG against VC.4 However, clinical data consistently report association of OPG with increased VC in CKD, including in PD patients.8,24 We showed that OPG levels were higher in PD patients with VC but sRANKL levels did not differ between patients with or without VC. This apparent controversy regarding the role of OPG in VC is not fully explained. The potential explanation for this contradiction is the view that elevated levels of OPG may represent a contra regulatory or protective mechanism against VC.4
Wnt signaling activity has a major role in bone metabolism and is regulated by soluble inhibitors, with sclerostin being the most studied followed by DKK-1. Sclerostin's major function is blockade of osteoblast differentiation and function.25 Indeed, sclerostin is a potent inhibitor of bone formation and mineralization. Like OPG, sclerostin levels had been associated with VC in some clinical studies26 but no study so far reported a relation between sclerostin or DKK-1 levels and VC in PD patients. In our studied population, sclerostin and DKK-1 levels were significantly higher in PD patients with VC. Our results contrast with Zou et al. They showed that serum sclerostin levels were not correlated with CAC in 81 PD patients.27 Sclerostin produced in the vessel wall, may not only retard the progression of VC but also, when spilled over to the circulation decreases osteoblastogenesis and bone formation. This is an interesting concept supported by laboratory data and with biological plausibility but remains to be proved in clinical grounds.4 To the best of our knowledge, this is the first paper reporting the association of DKK-1 levels with VC in PD patients and the first paper to report the association of sclerostin levels with VC when evaluated by X-ray.
FGF-23 is associated with VC in hemodialysis patients.28 However, few studies reported the association between FGF-23 and VC in PD patients. In our series, FGF-23 levels were not associated with VC. Our results are in line with Ramirez-Sandoval group,8 but contrasts with Asicioglu and coworkers.7 The eventual role of FGF-23 in VC in PD remains to clarify.
Age is a risk factor for VC, including in PD patients.8 We further explore our results regarding the association between age and VC. Patients with VC were older than patients without VC on X-ray (58.9 vs. 50.4 years, p=0.011). When considering patients with or without significant VC (defined as Adragão score≥3, as presented in supplemental material), the observed difference in the age was no longer statistically significant (56.8 vs. 51.7 years, p=0.17). The small number of patients (n=3) without significant VC was enough to alter the statistical significance. In our series, age was a significant risk factor for VC; we were not able to show that age is also a risk factor for significant VC.
Our paper has several strengths. It is the largest contemporary series of PD patients submitted to a bone biopsy to evaluate ROD. As long as the authors know, it is the only study so far evaluating the relationship between VC and bone disease in PD patients using bone biopsy data. We used several biomarkers and demonstrated their correlation with VC in this population.
Our limitations also should be noted. It is a single center, cross-sectional study, with a limited number of patients. We did not study clinical important outcomes such as cardiovascular mortality. Arterial stiffness was not evaluated. We did use a simple VC score and not computed tomography scan or echocardiographic findings.
ConclusionIn conclusion, VC seems to be less frequent in this contemporary cohort of PD patients. Disorders of bone volume and bone turnover were not associated with VC. Inflammation could be a more relevant factor associated with VC in PD. Erythrocyte sedimentation rate may also be used as surrogate markers of VC in PD.
Conflicts of interestThe authors have no conflicts of interest to declare.
The following are the supplementary data to this article:


