The association of hypouricemia and hypercalciuria is rare. In 1974 a new syndrome named Hypouricemia with hypercalciuria and decreased bone density was described. Afterwards, some cases with such association were published in which the fractional excretion of urate was higher than 20ml/100ml FGR. We have analyzed a series of children who were diagnosed with hypouricemia and hypercalciuria and who were monitored. The aim of this study was to determine whether our patients could be affected by the aforementioned syndrome or be carriers of a variant of idiopathic hypercalciuria.
Patients and methodsRetrospective longitudinal study in which the medical records of eight patients (5V, 3M) diagnosed with hypouricemia and hypercalciuria in childhood. Clinical features at diagnosis, ultrasound and densitometric findings and selected biochemical variables were noted, with special emphasis on renal tubular handling of urate. Results were compared with 36 children with idiopathic hypercalciuria without hypouricemia (14V, 22M).
ResultsIn the hypouricemia group baseline urate levels were 1.9 (0.3) mg/dl (range: 1.5–2) and first day urine calcium/creatinine ratio 0.27 (0.05) mg/mg (range: 0.23−0.31). In all cases fractional urate excretion was less than 20ml/100ml FGR. The z-DMO values were less than −1 in 4/8 cases. At the last follow-up only three cases still had an elevated calcium/creatinine ratio and in all of them the urates levels was greater than 2mg/dl. The z-DMO value had improved in five cases and worsened in three others. In relation to the group without hypouricemia, no differences were observed between the various parameters studied including the z-DMO value, with the exception of fractional excretion and tubular urate reabsorption although plasmatic uric acid levels were still significantly lower.
ConclusionOur patients with hypercalciuria and hypouricemia would be affected by a variant of idiopathic hypercalciuria in which, due to an unknown cause, the proximal tubular reabsorption of urate is modestly reduced and improves over time. Hypouricemia with hypercalciuria and decreased bone density may not be a specific entity.
La asociación de hipouricemia e hipercalciuria es poco frecuente. En 1974 se describió un nuevo síndrome nominado Hipouricemia con hipercalciuria y reducción de la densidad ósea. Posteriormente, se publicaron algunos casos con esa asociación en los que la excreción fraccional de urato era superior a 20ml/100ml FGR. Hemos analizado una serie de niños que fueron diagnosticados de hipouricemia e hipercalciuria y que fueron controlados evolutivamente. El objetivo del trabajo es intentar conocer si nuestros pacientes podrían estar afectos del síndrome antes mencionado o ser portadores de una variante de hipercalciuria idiopática.
Pacientes y métodosEstudio retrospectivo longitudinal en el que se estudiaron las historias clínicas de ocho pacientes (5V, 3M) diagnosticados de hipouricemia e hipercalciuria en la infancia. Se anotaron la clínica al diagnostico, los hallazgos ecográficos y densitométricos y determinadas variables bioquímicas, con especial hincapié en el manejo tubular renal del urato. Los resultados se compararon con los de 36 niños afectos de hipercalciuria idiopática sin hipouricemia (14V, 22M).
ResultadosEn el Grupo con hipouricemia los niveles iniciales de uricemia fueron 1,9 (0,3) mg/dl (rango: 1,5–2) y los del cociente calcio/creatinina en primera orina del día, 0,27 (0,05) mg/mg (rango: 0,23–0,31). En todos los casos la excreción fraccional de urato fue inferior a 20ml/100ml FGR. Los valores de z-DMO fueron menores de −1 en 4/8 casos. En el último control, solo en tres casos persistía el cociente calcio/creatinina elevado y en todos la uricemia era superior a 2mg/dl. El valor de z-DMO había mejorado en cinco casos y empeorado en otros tres. En relación con el grupo sin hipouricemia, no se observaron diferencias entre los diversos parámetros estudiados incluido el valor de z-DMO, con la excepción de la excreción fraccional y la reabsorción tubular de urato, aunque los niveles de uricemia seguían siendo significativamente inferiores.
ConclusiónNuestros pacientes con hipercalciuria e hipouricemia estarían afectos de una variante de hipercalciuria idiopática en la que por causa desconocida la reabsorción tubular proximal de urato está reducida discretamente y mejora con el tiempo. Es posible que el síndrome de Hipouricemia con hipercalciuria y reducción de la densidad ósea no sea una entidad específica.
In 1972 Greene et al. described an adult patient with hypouricemia that remitted discreetly after pyrazinamide administration and the hypouricemia was associated to hyperuricosuria and hypercalciuria.1 Two years later, Sperling et al. published data on a family of Jewish origin with the described characteristics that also had associated reduction in bone mass. The authors thought they were dealing with a new disease which they named Hypouricemia syndrome with hypercalciuria and reduced bone density (OMIM 242050).2 Subsequently, some patients with the presence of hypouricemia and hypercalciuria were described.3–6 Since 1993 we are not aware of any new published cases of this association, coinciding, approximately, with the description of the transporters involved in the proximal tubular handling of urate.
In 1994, our group presented data on several children with hypouricemia and hypercalciuria, something unusual given the rarity of the association.7 In the present work we have analyzed 8 cases that were diagnosed with hypouricemia and hypercalciuria in infancy and their evolution have been followed until adolescence. At the same time, we have tried to establish whether it is a distinct entity or a variant of idiopathic hypercalciuria (IH).
Patients and methodsDesignLongitudinal retrospective study in which the medical records of 8 patients (5M and 3F) diagnosed with hypouricemia and hypercalciuria in childhood were studied. Hypercalciuria was defined by a 24h renal calcium excretion greater than 4mg/kg/day.8 They had been diagnosed at the age of 8 (5.7) years (range: 1–11). Baseline calciuria was 4.92 (1.47) mg/kg/day (range: 4.7–8). Symptoms and signs at diagnosis were overactive bladder (n=3; 2 of them with microhematuria), urinary tract infection (n=2) and lithiasis (n=2); the remaining patient was asymptomatic and calciuria was requested as he had Schönlein-Henoch purpura. There was a family history of lithiasis in 50% of the patients. All of them had measurements of the fractional excretion of urate (FEUr) and had undergone renal ultrasound and bone densitometry. Throughout the evolution, 5 patients showed calculi; 2 of them had microcalcifications by ultrasound. In period 2, the age was 17 (12.5) years (range: 11.8−27).
An additional 9 patients with hypouricemia and hypercalciuria were not included in this work because FEUr and/or bone mineral density values were not available. Their urate levels ranged from 0.53 to 1.93mg/dl and calcium/creatinine ratio levels ranged from 0.21 to 0.57mg/mg. Their clinical presentation was very similar to that of the patients in the group with complete data.
The results were compared with those of 36 patients affected by IH (14M and 22F) who had uricemia determined and had a renal ultrasound and a bone densitometry performed (period 1). They were diagnosed of IH at the age of 10.1 (3.8) years (range: 2–13). Initial calciuria was 5.33 (2.66) mg/kg/day (range: 4.01–11.09). Symptoms and signs at diagnosis were urinary tract infection (n=9), overactive bladder and/or nocturnal enuresis (n=6), gross or microscopic hematuria (n=4), chronic abdominal pain (n=3), lithiasis (n=3) and dysuria (n=3); in the remaining 8, calciuria was determined because the existence of a family history of IH and/or urolithiasis. In period 2, the mean age was 13.2 (3.9) years (range: 8.2–18.2). There was a family history of urolithiasis in 67% of the cases.
Patients from both groups had no other data of renal proximal tubular dysfunction such as hyperaminoaciduria, glycosuria or low molecular weight proteinuria.
In both groups, the dietary recommendations at the time of diagnosis were the usual ones for children with lithiasis or prelithiasis, that is, to increase fluid intake and increase the intake of vegetables, fruits (especially citrus fruits), “blue” fish rich in omega-3 fatty acids and gofio. Gofio, a product rich in phytate, is typical of the Canary Islands; it is composed of toasted cereal flour, generally wheat or corn. Likewise, it was recommended that they should not abuse the intake of salt nor other proteins, so that they were urged not to drink daily more than 500ml of milk and/or dairy products.
DataData from period 1, both in the study group and in the children with IH, correspond to the time when urate levels were first determined. From that time, weight and height were determined and body mass index (BMI) was calculated. The parameters collected in their medical records were blood levels of creatinine, urate, calcium, phosphate and intact PTH, as well as calciuria and the urine concentration of calcium and creatinine in the first urine of the day. In addition, the peak urinary osmolality value and the z-value of bone mineral density (z-BMD) were noted. The calcium/creatinine ratio, the urine volume corresponding to 100ml of GFR (V/GFR), FEUr and urate reabsorbed per 100ml of glomerular filtrate were calculated (Table 1). Period 2 data, in both groups, correspond to the second quantification of urate levels, generally around adolescence.
Formulas used.
| Volume corresponding to 100ml of GFR (V/GFR) (ml/100ml GFR). | ([PCr] × 100)/[UCr] |
| Fractional excretion of urate (FEUr) (ml/100ml GFR) | ([UUr] × V/GFR)/[PUr]. |
| Tubular urate reabsorption (PUr-Ur excretion rate) (mg/dl) | [PUr] - ((([UUr] × [Pcr])/[UCr]) |
PCr and UCr: plasma and urinary creatinine levels, respectively; PUr and UUr: plasma and urinary urate levels, respectively.
Creatinine (enzymatic technique), calcium, phosphate and urate were measured using an automated analyzer (Cobas® 702 Roche Diagnostics). Hypouricemia was considered if urate levels were equal to or less than 2mg/dl.9 Intact parathormone (PTHi) was quantified by immuno-radiometric ELISA-PTH assay (Cisbio Bioassays); values between 10 and 65pg/ml were considered normal. Osteocalcin and calcitriol were determined by radioimmunoassay (RIA). In the determination of deoxypyridinoline (Dpir), a direct chemiluminescence technique was used with a competitive immunoassay in which Dpir in the sample competes with pyridinoline coupled to paramagnetic particles by an anti-Dpir monoclonal antibody (Chiron Diagnostics).10
Desmopressin concentration testOnce the bladder was emptied, 20μg of desmopressin was administered intranasally or 120μg of the oral lyophilisate was administered sublingually (Minurin Flas®). Three urine samples were collected at 90min intervals. Food intake was allowed and fluid abuse was discouraged. The highest osmolality value determined was given as the test result. A peak urinary osmolarity value greater than 800mOsm/kg11 was considered normal.
Bone mineral densitometryBone mineral density (BMD) was determined by DXA technology using a QDR densitometer® 4500 SL (Hologic, Danbury, CT). The same densitometer was used in the 2 phases of the study. Bone mineral content was measured at the lumbar spine. The coefficient of variation is 1.06% for the spine. Results were expressed by z-value (z-BMD) comparing each participant's value to that of an age- and sex-matched control population; z-BMD is calculated using the control data provided by the densitometer software.12
Statistical analysisQuantitative variables were expressed as median and interquartile range. The Mann-Whitney U test was used to investigate differences between groups. To study differences between qualitative variables, the Chi-square test with the Yates variant when necessary. The data were analyzed using the SPSS program® version 20.0 (SPSS Inc., Chicago, IL, USA).
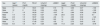
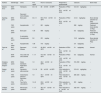
ResultsThe initial and final values for age, uric acid levels, calcium/creatinine ratio and z-BMD in patients in the hypouricemia and hypercalciuria group are shown in Table 2. Likewise, this table reflects the initial values of FEUr and urate reabsorbed per 100ml of glomerular filtrate. Peak urinary osmolality was normal in all cases (Table 3). Calcitriol levels (n=7; range: 19–45pg/ml), as well as intact PTH (n=7; range: 6.1–27.9pg/ml) were normal. Five patients had undergone pyrazinamide challenge with an adequate response, such that FEUr dropped to values between 0.11 and 1.84ml/100ml GFR. The z-BMD values were less than −1 in 4/8 cases. In period 2, the calcium/creatinine ratio value remained elevated in only 3 cases and all patients had urate levels above 2mg/dl (Table 2). The z-BMD value had improved in 5 cases and decreased in the remaining 3. Three patients showed ultrasound stones and 2 microcalcifications.
Various quantitative variables of patients with hypouricemia and hypercalciuria at baseline (1) and at the end of follow-up (2).
| Sex | Age1a (years) | PUr1 (mg/dl) | FEUr1 | UCa/Cr1 (mg/mg) | z-BMD1 | Age2 (years) | PUr2 (mg/dl) | UCa/Cr2 (mg/mg) | z-BMD2 |
|---|---|---|---|---|---|---|---|---|---|
| Male | 11 | 1.6 | 19.81 | 0.23 | 1.73 | 16 | 3.09 | 0.07 | −1.59 |
| Male | 12 | 2 | 15.04 | 0.24 | −3.04 | 17 | 4.31 | 0.05 | −1.99 |
| Female | 7 | 1.9 | 16.29 | 0.27 | −3.07 | 18 | 2.99 | 0.26 | −2.26 |
| Male | 7.4 | 1.6 | 14.53 | 0.27 | −1.06 | 23.5 | 3.42 | 0.15 | 0.7 |
| Male | 2.8 | 1.5 | 16.97 | 0.24 | −0.8 | 13 | 4.36 | 0.02 | −1.24 |
| Female | 5.3 | 1.9 | 15.49 | 0.29 | 1.62 | 14 | 2.65 | 0.16 | 0.15 |
| Male | 11 | 1.9 | 17.48 | 0.31 | −0.8 | 17 | 2.70 | 0.40 | 1.09 |
| Female | 6.5 | 1.9 | 16.71 | 0.29 | −0.86 | 11.8 | 2.20 | 0.25 | −0.78 |
FEUr: fractional urate excretion; PUr: plasma urate levels; UCa/Cr: calculated ratio between urinary calcium and creatinine concentrations; z-BMD: z-value of bone mineral density.
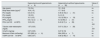
Age. body mass index and blood and urinary parameters quantified in the 2 subgroups included in the study in period 1.
| Hypouricemia and hypercalciuria (n=8). | Hypercalciuria without hypouricemia (n=36). | Value of P | |
|---|---|---|---|
| Age (years) | 7.2 (5.4) | 10.1 (3.8) | ns |
| Body Mass Index (kg/m)2 | 16.4 (1.5) | 17.7 (4.6) | ns |
| PCr (mg/dl) | 0.4 (0.14) | 0.45 (0.16) (n=31) | ns |
| PUr (mg/dl) | 1.9 (0.3) | 3.4 (1.2) | – |
| PCa (mg/dl) | 10.1 (0.3) | 10.2 (0.39) (n=19) | ns |
| PPO4 (mg/dl) | 5.0 (1.2) (n=6) | 5.0 (0.95) (n=21) | ns |
| FEUr (ml/100ml GFR) | 16.5 (2.2) | 8.43 (2.7) (n=29) | < .001 |
| Tubular urate reabsorption (mg/dl) | 1.57 (0.33) | 3.07 (1.23) (n=28) | < .001 |
| UCa/Cr (mg/mg) | 0.27 (0.05) | 0.27 (0.19) | ns |
| Maximum UOsm (mOsm/kg) | 870 (283) (n=6) | 924 (255) (n=7) | ns |
| V/GFR (ml/100ml GFR) | 0.85 (0.57) | 0.85 (0.46) (n=14) | ns |
FEUr: fractional urate excretion; ns: not significant; PCa and UCa: plasma and urinary calcium levels, respectively; PPO4: plasma phosphate levels; PUr: plasma urate levels; UCa/Cr: calculated ratio between urinary calcium and creatinine concentrations; UOsm: maximum urinary osmolality; V/GFR: urinary volume corrected by 100ml of GFR.
In the group with hypouricemia and hypercalciuria in relation to the group with IH and normouricemia, there were no differences observed in period 1 in terms of age, body mass index, parameters evaluating renal water management, creatinine levels, calcemia and phosphatemia levels and calcium/creatinine ratio, and statistically significant differences were only observed in the parameters studying urinary excretion of urate (Table 3).
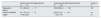
Table 4 shows the bone remodeling and BMD parameters in period 1. No differences were observed between the two groups in the deoxypyridinoline/creatinine ratio and the z-BMD value, although there were differences in osteocalcin levels.
Bone remodeling markers and z-value of bone mineral density in the 2 groups included in the study in period 1.
| Hypouricemia and hypercalciuria (n=8). | Hypercalciuria without hypouricemia (n=36). | Value of P | |
|---|---|---|---|
| Osteocalcin (ng/ml) | 21.4 (20.2) (n=7) | 45.9 (28.9) (n=16) | .03 |
| UDPir/Cr (nM/mM) | 23.1 (16.1) (n=5) | 29.3 (7.2) (n=14) | ns |
| z-BMD | −0.83 (3.56) | −1.40 (1.19) | ns |
ns: not significant; UDPir: urine deoxypyridinoline; z-BMD: z-value of bone mineral density.
In period 2, blood uric acid levels were still significantly lower than in the HI group, although no differences were observed in calciuria or z-BMD values. Likewise, no differences were found in the frequency of children with improved calcium/creatinine ratio or in those with improved z-BMD values. The parameters evaluating urinary excretion of urate were not available during this period (Table 5).
Age, urate and calcium/creatinine ratio levels and z-BMD value in the 2 subgroups included in the study in period 2. Patients with improvement in calcium/creatinine ratio and z-BMD value.
| Hypouricemia and hypercalciuria (n=8). | Hypercalciuria without hypouricemia (n=36). | Value of P | |
|---|---|---|---|
| Age (years) | 15.5 (4.5) | 13.2 (3.9) | ns |
| PUr (mg/dl) | 3.04 (1.42) | 3.9 (1.9) (n=14) | .03 |
| UCa/Cr (mg/mg) | 0.16 (0.20) | 0.16 (0.10) (n=35) | ns |
| Patients with normal calcium/creatinine ratio (<0.20mg/mg). | 5/8 (62.5%) | 11/35 (31.4%) | ns |
| z-BMD | −1.01 (2.43) | −1.0 (0.94) (n=35) | ns |
| Patients who improved their z-BMD values | 5/8 (62.5%) | 22/35 (62.8%) | ns |
ns: not significant; PUr: plasma urate levels; UCa/Cr: calculated ratio urinary calcium and creatinine concentrations; z-BMD: z-value of bone mineral density.
With a physiological blood pH, about 98% of uric acid in blood is in the form of monosodium urate. In urine, when the pH is below 5.5, uric acid is in an undissociated and highly insoluble form and can crystallize. Renal tubular hypouricemia tubulopathy (type 1: OMIM 220150 and type 2: OMIM 612076) was described in 1950 by Praetorius and Kirk.13 These authors observed that, in their patient, hyperuricosuria was very excessive, and urate clearance was higher than creatinine clearance, suggesting the existence of tubular secretion of the ion. Physiological studies performed in the following years led to the assumption that the proximal tubular handling of urate had 3 components, namely, presecretory reabsorption, tubular secretion and a postsecretory reabsorption. These mechanisms have not been confirmed; more recently the complexity and diversity of the transporters involved in proximal tubular urate reabsorption have become known using molecular biology techniques.
Specifically, renal tubular hypouricemia type 1 is caused by mutations in the SLC22A12 gene encoding the luminal urate-anion exchanger urate-anion transporter 1 (URAT1).14 These patients are characterized by showing reduced urate levels (between 0.5 and 1.5mg/dl), elevated FEUr (between 20 and 90/100ml GFR) and an attenuated uricosuria in response to probenecid and pyrazinamide.15 Type 2 renal tubular hypouricemia is caused by mutations in the SLC2A9 gene encoding the basolateral glucose transporter (GLUT9).16 Patients with this variant show even lower urate levels (less than 0.5mg/dl) and FEUr values above 150/100ml GFR.17 The response to pyrazinamide is preserved.18
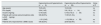
In the literature related to this subject, there are cases described of renal tubular hypouricemia in which hypercalciuria was present.1–6 The most relevant data of these patients have been collected in Table 6. Some patients with this association have not been included in the table because they were affected by other diseases such as cerebral palsy,19 diabetes mellitus,20 myeloma5 and nephrotic syndrome.21 The urate levels of the patients reviewed ranged from 0.6 to 2mg/dl and the FEUr was always higher than 20/100ml GFR. The cases published by Greene et al.,1 Sperling et al.,2 Frank et al.3 and Smetana and Bar-Khayim4 appear compatible with functional alterations in the URAT exchanger given the attenuated response to pyrazinamide15 (Table 6). In addition, the 3 patients presented in 2 of the above publications3,4 also showed an attenuated response to probenecid (data not shown in Table 5). In the cases of renal tubular hypouricemia published by Gaspar et al.5 and Uribarri and Oh6, the response to pyrazinamide was adequate. This is the expected response in patients with functional alterations in the GLUT9 transporter,18 but in this circumstance urate levels are very low, a fact not observed in the patients mentioned above, so perhaps they were heterozygous carriers of a mutation with loss of function in GLUT9. In any case, from what we have reviewed it seems that hypercalciuria is not specific to either of the 2 types of renal tubular hypouricemia. So far, it has not been described that an alteration in proximal tubular handling of urate is accompanied by a reduction in renal tubular reabsorption of calcium at that level. Moreover, if this would occur, calcium could be recovered in the more distal segments of the nephron, especially in the distal tubule.
Clinical and biochemical data of published patients with renal tubular hypouricemia and hypercalciuria.
| Authors | Gender/age | Clinic | PUr. mg/dl | FEUr or uricosuria | Response to pyrazinamide | Calciuria | Bone mass |
|---|---|---|---|---|---|---|---|
| Greene et al.1 | M/23 years | Hematuria | 0.9−1.8 | 38ml/100ml GFR | Reduction of FEUr to 29.4ml/100ml GFR. | 5.3−9.6mg/kg/day | – |
| Recurrent OxCa lithiasis | |||||||
| Sperling et al.2 | M/53 years | Bone pain | 0.6−1.1 | 60.6−70.6ml/100ml GFR | Reduction of FEUr to 46.9ml/100ml GFR. | 4−5.5mg/kg/day | Bone density reduction (X Ray) Osteoporosis |
| F/65 years | Asymptomatic | 1.7 | 681mg/day | – | 282mg/day | Reduced bone density (X Ray) | |
| M/50 years | Bone pain | 1.05 | 680mg/day | – | 9.3mg/kg/day | Reduced bone density (X Ray) | |
| A calculation | |||||||
| M/9 years | Asymptomatic | 0.6 | 231mg/day | – | 10.8mg/kg/day. | Bone density reduction (X Ray) | |
| F/4 years | Asymptomatic | 1.86 | 410mg/day | – | 5.4mg/kg/day | – | |
| Frank et al.3 | M/37 years | Recurrent lithiasis | 1.3−2.1 | 45−58.2ml/100ml GFR | Reduction of FEUr to 28.2ml/100ml GFR. | 5.1mg/kg/day | Normal |
| M/39 years | Two urate and OxCa stones | 1−1.7 | 47.9−55ml/100ml GFR | Reduction of FEUr to 16.8ml/100ml GFR. | 6.3mg/kg/day | Normal | |
| Smetana and Bar-Khayim4 | M/53 years | Gross hematuria Right flank pains | 1.9 | 46.2ml/100ml GFR | Reduction of FEUr to 31.8ml/100ml GFR. | 516−550mg/day. | – |
| Gaspar et al.5 | M/10 years | Hematuria after exercise | 1.3−1.9 | 58ml/100ml GFR | FEUr reduction to 0.08ml/100ml GFR. | 5.5−6.8mg/kg/day | – |
| F/56 years | Oxalochalcic lithiasis? Recurrent UTIs | 1.8 | 33.7ml/100ml GFR | FEUr reduction to 0.46ml/100ml GFR. | 280−324mg/day. | – | |
| F/34 years | Two OxCa calculations | 1.8−2 | 23.6ml/100ml GFR | FEUr reduction to 0.21ml/100ml GFR. | 291mg/day | – | |
| Urribarri and Oh6 | F/30 years | Microscopic hematuria | 1−1.7 | 36.5−47ml/100ml GFR | FEUr reduction to 0ml/100ml GFR. | 342−470mg/day. | – |
FEUr, fractional urate excretion; F, female; Xray: conventional radiology; M, male; PUr, plasma urate levels; OxCa, calcium oxalate; UTI, urinary tract infection.
As illustrated in Table 6, it can be observed that in the 70s and 80s of the last century, there few cases published with the association of hypouricemia with hypercalciuria. The interest of our group in the subject is based on the fact that in the 1990s we had diagnosed in our hospital several patients with this rare association.7 Many of them had ancestors from the neighboring island of La Gomera. As a consequence, in a study carried out in children living in several towns on that island, we observed that they were carriers of a high frequency of hypercalciuria and very low frequency of hypouricemia,22 which does not invalidate the hypothesis that some of them could have had transient reduced blood levels of urate in the first years of life.
In the present work we have studied 8 patients diagnosed in our hospital in childhood of the association of hypouricemia with hypercalciuria. The intention is to out if they are patients with renal tubular hypouricemia with hypercalciuria or patients with IH and hypouricemia.
In recent years it has been described that IH is not a disease and, therefore, is not a tubulopathy. Hypercalciuria is most likely related to an increase in the number of vitamin D receptors, with the resulting increase in intestinal calcium absorption of calcium23 and increased bone resorption24 resulting in a discrete reduction in BMD. A z-BMD value of less than −1 is observed in 30%–40% of children25 and in 60% of adult patients with IH.26 In this sense, it is possible that some of the cases of so-called Juvenile Idiopathic Osteoporosis are actually extreme forms of IH.27,28 Recently, we have described that many patients with IH, especially women, improve their z-BMD value upon reaching adulthood.29
In our study, in the hypouricemia and hypercalciuria group as compared with the hypercalciuria group with normal urate levels, there were no differences observed in the parameters that evaluate renal management of water, calcemia and phosphatemia levels, the calcium/creatinine ratio and the z-BMD value (Tables 3–5). Statistically significant differences were only observed in parameters of urinary excretion of urate (Table 3), osteocalcin levels (Table 4) and uricemia at the end of follow-up (Table 5). It is noteworthy that many patients in both groups had normalized the calcium/creatinine ratio and improved the z-BMD value in period 2 (Table 5). In this phase, as indicated, the parameters that study urinary urate elimination were not available. This data coincides with that was previously reported by our group about the fact that some patients diagnosed with IH in childhood normalize calciuria, in addition to bone mass, in adolescence or in early adulthood.29
A relationship between urate and calcitriol levels has been described in the literature on the subject. In 1993, Vanholder et al. observed in patients with mild to moderate chronic renal failure that, after short-term administration of allopurinol, plasma urate levels were reduced and calcitriol levels increased.30 In experimental animals, Chen et al. demonstrated that hyperuricemia suppresses renal 1-α hydroxylase leading to a reduction in calcitriol concentration and higher PTH levels.31 Consequently, in patients with hypouricemia, it is possible that the absence of the inhibitory effect of intracellular uric acid on 1-alpha-hydroxylase favors an increase in calcitriol levels and the consequent occurrence of hypercalciuria.6
In summary, in some patients with renal tubular hypouricemia (FEUr greater than 20%) (Table 6) there is hypercalciuria that could be mediated by the aforementioned absence of the inhibitory effect of intracellular uric acid on 1-alpha-hydroxylase. On the other hand, some patients with IH, as observed in our series, have discrete urinary losses of urate (FEUr less than 20%), presumably at the level of the proximal tubule level, although uricemia and calciuria values tend to normalize in many cases with the increase in age and there are no differences in the z-BMD value in relation to patients with IH without hypouricemia.
Thus, our patients with hypercalciuria and hypouricemia would be affected by a variant of IH in which the proximal tubular reabsorption of urate would be discretely reduced for unknown reasons and in a way that could improve.
It should be pointed out that nine patients with hypouricemia and hypercalciuria were not included in the study because basic values necessary for diagnosis were not available. This absence of these data has a limiting effect on our results.
Conflict of interestThe authors declare that they have no conflicts of interest.