


Thermodiluction is a widely used method for measuring vascular access flow (QA). Among the possibilities of TD, the reverse method (MI) can be beneficial in the execution time, without impact on the dialysis efficacy (Kt). However, it is not a sufficiently studied technique.
MethodTransversal study of 117 arteriovenous fistulas (AVF). Two QA measurements were taken with the method described by the manufacturer (MR) and another with MI. MI is bases in the obtention of an inverted recirculation registry at the beginning of the session and a single subsequent recirculation measurement with the lines in normal position. In the concordance analysis, the Bland-Altman method and Cohen’s Kappa index were used.
ResultsVery good concordance between MR and MI was evidenced for QA below 700 ml/min, but it worsens as flow increases. The median variability between the MR measurements (intra-method variability) was 3.4% (−17.13). This value did not differ from the median variability generated between MR and MI (inter-method variability), which was 2% (−14, 12) (P = 0.287). The degree of agreement between the two to identify AVFs susceptible to intervention was very good (K = 0.834). The time spent using the MI was significantly shorter (P = 0.000) without evidence of variations in the Kt of the measurement sessions (P = 0.201).
ConclusionsThe thermodiluction MI is valid to determine the flow of the vascular access, especially in Qa lower than 700 ml/min, with great time savings, simplification of the procedure and without modifying the dialysis efficiency. The variability between the measurement by MR and MI is similar to that of MR. The concordance between methods in identifying potentially pathological AVFs is very good.
La termodilución es un método ampliamente usado para la medición del flujo de acceso vascular (QA). Entre las posibilidades de la TD, el método inverso (MI) puede ser beneficioso en el tiempo de ejecución, sin repercusión en la eficacia dialítica (Kt). Sin embargo, no es una técnica suficientemente estudiada.
MétodoEstudio trasversal sobre 117 fístulas arteriovenosas (FAV). Se realizaron 2 mediciones de QA con el método descrito por el fabricante (MR) y otra con MI. El MI se basa en la obtención del registro de recirculación invertida al iniciar la sesión y una única medición posterior de recirculación con las líneas en posición normal. En el análisis de concordancia se utilizó el método Bland-Altman y el índice de Kappa de Cohen.
ResultadosSe evidenció muy buena concordancia entre MR y MI para QA inferiores a 700 ml/min, pero empeora a medida que aumenta el flujo. La variabilidad mediana entre las mediciones con MR (variabilidad intramétodo) fue 3,4% (−17,13). Este valor no difirió de la variabilidad mediana generada entre MR y MI (variabilidad intermétodo) que fue 2% (−14, 12) (p = 0,287). El grado de acuerdo entre ambos para identificar FAV susceptibles de intervención fue muy bueno (K = 0,834). El tiempo empleado utilizando el MI fue significativamente menor (p = 0,000) sin evidenciarse variaciones en el Kt de las sesiones de medida (p = 0,201).
ConclusionesEl MI de termodilucción es válido para determinar el flujo del acceso vascular, especialmente en QA inferiores a 700 ml/min, con gran ahorro de tiempo, simplificación del procedimiento y sin modificar la eficacia de diálisis. La variabilidad entre la medición por MR y MI es similar a la propia del MR. La concordancia entre métodos a la hora de identificar FAV potencialmente patológicas es muy buena.
Determination of the access flow (QA) of the arteriovenous fistula (AVF) has become one of the mainstays of the AV follow-up and monitoring programmes.1,2 The use of dilutional methods for the indirect determination of QA has led to a qualitative change in the study of AVF.3
Since the first determination described in 1995 by Nicolai Krivitski,4 with dilutional ultrasonography, various dilutional techniques have been described that allow indirect calculation of the QA during haemodialysis and, therefore, for carrying out functional monitoring of the AVF. There is no clear preference for any of these methods5 and most studies have shown equivalent QA values after simultaneously applying different dilution techniques.6,7 Among all the methods, the thermodilution (TD) described by Schneditz et al.8 has the advantage that it is performed using a biosensor integrated into the dialysis monitor, which makes it more comfortable for nursing professionals, since it does not require an external device.9
The determination of QA with TD is carried out through the quantification of recirculation, modifying the temperature of the blood in a timely manner, with and without reversing the haemodialysis blood lines. If both arterial and venous needles have been inserted into the same arterialised vein, reversing the blood lines creates an artificial recirculation that can be quantified by measuring the temperature of the blood, and allows us to calculate the QA according to the formula described by the manufacturer.1
To do this, first the mean value of two recirculation measurements with correct placement of the haemodialysis lines (RN) must be determined, and then a single recirculation measurement with the lines reversed (RX).8
However, executing this procedure is time consuming. With the intention of a greater operability, the method tends to be simplified by making a single RN measurement. We have not found any studies that analyse the impact of this modification of the method on QA values. Neither does the available bibliography regarding the use of TD specify whether the full reference method described by the manufacturer is applied.10,11
The manipulation necessary to reverse the haemodialysis lines and proceed to measure the RX can cause accidental movement of the needle with the risk of venous rupture. Also there is an increased risk of infection due to multiple manipulation of the lines.12
To optimise the efficiency and safety of the method, we propose a modification of the procedure that is based on exchanging the order of measurement of the recirculation of the access and eliminating the double measurement of RN. When starting dialysis, we do it with the lines reversed and we first obtain the RX data and, later, a single RN value. The duration of the procedure and the number of manipulations is reduced, with the use of a single reversal compared to the two described in the manufacturer’s reference method (MM), which implies a lower risk of the technique. The difference between the two methods is represented in the diagram.
The main objective of this study is to validate the reverse method (RM) for measuring QA with TD through the analysis of the variability generated and its clinical agreement with respect to the MM. The secondary objective was to evaluate the period of time spent to determine the QA and its impact on dialysis efficacy.
Material and methodsA cross-sectional observational study was carried out in which AVFs of patients on regular haemodialysis from three peripheral centres were analysed. All patients were informed and gave their consent. The protocol was approved by the clinical trials committee of the Jiménez Díaz Foundation.
The inclusion criterion was defined as an AVF maturation period of more than one month (n = 131). Eight AVFs in which the venous return needle was punctured in a vein other than the arterialised vein were later excluded, as were three AVFs with the presence of collateral circulation and three AVFs in which a high recirculation of the access itself had been detected. In these three last cases, the access flow cannot be determined with dilutional methods,6 leaving the sample reduced to 117 AVFs.
As a primary variable, QA (ml/min) was recorded by TD. To obtain the measurements, a Blood Temperature Monitor (BTM®) was used. This sensor, incorporated into the Fresenius 5008 haemodialysis monitors, allows the calculation of the percentage of recirculation existing with RN and RX. From these values, the QA is calculated using the following mathematical equation8:
where QS is the effective blood flow (ml/min); UFR is the ultrafiltration rate (ml/min); RN is the recirculation obtained with the haemodialysis lines in the normal position and RX is the recirculation obtained with the haemodialysis lines in the reversed position.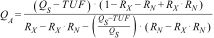
The diagram shows the differences between the MM and RM methods. Three consecutive measurements were made. In the first two (MM1 and MM2) the MM was applied, that is, the one described by the manufacturer. This consists of using, for the mathematical calculation, the mean value of two RN measurements and a single RX measurement, obtained in the same order. In the third measurement, the proposed procedure, the RM, was used. This is based on using, for the mathematical calculation of the QA, a single RX measurement obtained first, at the beginning of the haemodialysis session with the lines reversed, and another single measurement of the RN obtained later Figure Scheme 1.

All determinations were made in the first 90 min of treatment and a constant ultrafiltration ratio was maintained to avoid influences on the QA measurement produced by changes in blood volume.12 In addition, a pump flow of 250 ml/min was used,8 the distance between needles was the same in each process and the punctures were in antegrade position with the bevel down, according to the latest recommendations.1,13
Secondary variables collected were: mean arterial pressure (MAP) at the time of measuring recirculation, the time needed to perform the measurement and the Kt of the haemodialysis session measured by ionic dialysance. As complementary data included, demographic variables (age and time on haemodialysis) and AVF-related variables (type of vascular access, location and time of the same).
All study parameters were collected through the computerised medical history using the Nefrosoft® V.6.7.4 program.
Statistical analysisThe statistical approach was carried out with the IBM® SPSS® Statistics v20 program. The quantitative variables were presented as mean and standard deviation or median and interquartile range, according to the criterion of normality determined through the Kolmogorov-Smirnov test. The comparison of continuous variables was performed as paired data for each patient. The statistical significance analysis was carried out for p ≤ 0.05 using the Student’s t, ANOVA or Wilcoxon test, as appropriate. For the study of concordance, the intraclass correlation coefficient was used before logarithmic transformation of the data to adjust to the normality criterion, the Bland–Altman method and the Cohen’s kappa index (K).
ResultsA total of 117 AVFs were analysed, 107 (91.5%) were native and 10 (8.5%) prosthetic, from patients with a median age of 70 (60–78) years and period of time in the haemodialysis programme was 44 (22–97) months. A 60% (70 of 117) of the AVFs were radial and 40% (44 of 117) were humeral. The median time of permanence of the vascular access was 32 (17–58) months.
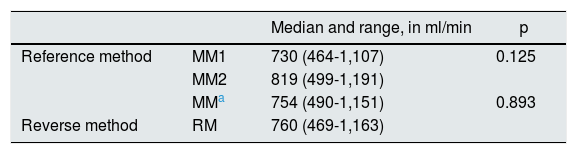
Table 1 shows the QA obtained in the different measurements performed. These measurements were not associated to the values of MAP (p = 0.634), recorded at the different measurement moments: 88.7 ± 14.1 mmHg in MM1, 88.6 ± 13.7 mmHg in MM2, and 87.78 ± 12.1 mmHg in the RM.
Access flow logs.
| Median and range, in ml/min | p | ||
|---|---|---|---|
| Reference method | MM1 | 730 (464-1,107) | 0.125 |
| MM2 | 819 (499-1,191) | ||
| MMa | 754 (490-1,151) | 0.893 | |
| Reverse method | RM | 760 (469-1,163) |
In this study, we have confirmed that the measurements obtained with the procedure proposed are comparable and, therefore, concordant. In the quantitative concordance analysis, the intraclass correlation coefficient for the two MM measurements was 0.907 (95% CI 0.866–0.935). According to the criteria of Landis and Koch,14 both measurements presented almost perfect concordance. This same degree of concordance has also been evidenced between the measurements obtained with the MM and the RM, with value of the intraclass correlation coefficient of 0.946 (95% CI 0.922–0.962).
To confirm the similarity between the proposed measures, the Bland-Altman procedure15 (Fig. 1) was applied. The variability observed (median of the differences) between MM1 and MM2 was −21 ml/min, the proximity to 0 indicates the similarity of both measurements. This similarity is also observed by comparing the measurement with RM and with MM, where the variability was 14 ml/min.
, while the X axis represents the mean value of the two measurements performed with the reference method (MM1 + MM2/2), as the best estimator of the real value of the variable. In addition, limits of concordance are established that represent the range in which differences in values will be found, approximately 95% of the time.")
Graphic representation according to the Bland-Altman method. The Y axis corresponds to the differences between the paired values of the different measurements performed (MM1–MM2 and MM–RM), while the X axis represents the mean value of the two measurements performed with the reference method (MM1 + MM2/2), as the best estimator of the real value of the variable. In addition, limits of concordance are established that represent the range in which differences in values will be found, approximately 95% of the time.
The variability is not the same for any QA, since it is demonstrated that for flow magnitudes greater than 700 ml/min the concordance worsens.
To facilitate understanding of the results, values are expressed as a percentage in Fig. 2. The intra-method variability between MM1 and MM2 was 3.4% (−17.13%). We also did not find significant differences (p = 0.287) between the two methods (inter-method variability), the median value of which was 2% (−14.12%).
, with the corresponding limits of concordance.")
Fig. 3 shows the degree of concordance between the two MM measurements and the MM and RM measurements, depending on the variability that is intended to be accepted. As the variation in the result considered acceptable increases (accepted tolerance by the international societies)5,6 the degree of concordance between measurements increases. In both cases the percentages that mark the concordance are similar, and better results are even obtained with the RM in the reference measurement than with both measurements made with the MM.
 for each subject, and the Y axis shows the proportion of cases in which the discrepancies equal to at least each of the observed differences.")
Fig. 4 shows the classification of AVFs according to whether the QA is less than or greater than 500 ml/min, comparing both methods. The degree of concordance between the QA obtained with the MM and that obtained with the RM was 93% (K = 0.834), almost perfect. Thus, the RM is useful to indicate dysfunction, as is the MM.

The time taken to obtain the recirculation data of the AVF essential for the QA measurement was analysed. There was a significant decrease in the time required by using the RM versus the MM, 48 ± 10 and 67 ± 13 min (p = 0.000), respectively. No significant differences were detected in the Kt obtained when using both measurement methods, its mean value was 45.1 ± 6.8 l using the MM and 45.7 ± 7.6 l using the RM (p = 0.946).
DiscussionIn the measurement of QA by TD the manipulation required to reverse the lines and time to perform the procedure can put patients’ safety at risk. The simplified method evaluated minimizes the risk of infection by reducing handling and provides greater operability to the HD units that are using TD, especially those with a high workload.16
In our study, although both methods show similar results, we cannot say that they are identical, since the inter-method variability is 2% and the intra-method variability is 3.4%.
To confirm the suitability of the method, we have verified that the inter- and intra-method variability is very similar in both. The results show good concordance for QA lower than 700 ml/min, and below these values there is hardly any variability between both methods. But it is observed that as the QA augments, there is an increase in variability, without a clear tendency to underestimate the previous measure. This phenomenon was described previously by other authors, such as Merino et al.17 and Sánchez Tocino et al.9 in their studies on concordance among dilutional methods. This variability was attributed to the mixing conditions of the indicator used, since, at high QA magnitudes, the laminar flow intensifies, creating the worst possible mixing conditions. Part of the indicator may not mix due to the lack of turbulence and would outflow without being detected by the measurement sensor, providing erroneous recirculation data.4
We have not found significant differences in the percentage of variation between the measurements of the reference method and between the MM and the RM. We believe that the double measurement of RN recommended by the MM is unnecessary, as it is not enough to correct this situation. We do not consider the modifications proposed in the RM to be responsible for the variability between methods, but rather the mixing conditions of the indicator is the cause of the differences between measurements.
It must be taken into account that in AVF with normal function, the RN determines only the cardiopulmonary recirculation8 whose variation between patients is less than the RX, which depends directly on how the flow of the fistula influences the indicator. Despite controlling the variables of pump flow, the distance between needles, the position and placement of the bezel, any modification of the needle inside the vessel from one measurement to another may change the conditions of the mixture affecting the indicator, obtaining great variability in recirculation data between measurements, as previously described.9
The MAP also was not the cause of the variability observed between the methods of measurement. This is despite the fact that this parameter is the main determinant of QA variations to the point that a 10% decrease in the MAP may reduce the QA of the AVF by 8%18; in our study no significant differences in the MAP were rcorded at different times of QA measurement.
Even though there are discrepancies in QA measurements between the MM and the RM, these are not relevant and their clinical impact is negligible; therefore the main clinical guidelines to recommend their use indifferently accepting discrepancies between them of up to 300 ml/min,5,6 even up to 600 ml/min when dilutional methods are compared with Doppler ultrasound.7 Thus, taking differences of 300 ml/min as tolerance accepted in the bibliography, the degree of agreement between the MM and the RM is 86% and greater than 95% for tolerances of 600 ml/min. Clinically, our study reports a very good degree of agreement between the MM and the RM to identify AVFs with QA <500 ml/min, so both methods are useful to identify AVFs that require revision.
We consider that intra-method variability should be taken into account in QA follow-up measurements, since a temporal decrease greater than 20–25% with respect to its baseline value has greater diagnostic utility than an isolated QA measurement.19 In this study, only intra-method variability in the use of the MM has been analysed, but we assume a similar behaviour in the RM. The study by Schneditz et al.8 validate TD for the determination of QA and they describe the presence of an intra-method variability that could lead to a decrease in QA of up to 23%, without taking into account haemodynamic changes. For this reason, we believe that one should be prudent when making clinical decisions in AVFs with a prospective decrease in QA greater than 20%, and complete the assessment with primary methods such as physical inspection, changes in dynamic pressures during the session or a decrease in dialysis efficacy.
The time invested in performing the measurement is a fundamental objective in our study. It was found that the time required to complete the mean QA with the MM exceeds that of the RM by approximately 20 min. This is due to the nursing staff having to make one more recirculation measurement and extra lines having to be inserted. Taking into account that it is advisable to carry out the procedure at the beginning of haemodialysis to avoid changes in blood volume20 and that this time coincides with the peak nursing activity, the RM becomes a good option, since it reduces workloads and stress in the dialysis units,15 minimising the possible adverse effects derived from the procedure.
Finally, and unexpectedly, we did not find significant differences between the Kt obtained with the RM versus the MM, despite the fact that, in the proposed method, the time in which dialysis is being carried out at low flows (250 ml/min) is about 20 min lower and it is known that an increase in QA from 200 ml/min to 400 ml/min implies an increase in clearance from 25% to 40%.21 The explanation could be that in a four-hour session the extraction of urea is approximately 65% in the first two hours and only 35% occurs in the last two.22 When starting haemodialysis, if the lines are connected in an inverted position this generates a forced recirculation that neutralises the maximum efficiency of the dialyser, which occurs at the beginning of the haemodialysis.
ConclusionsThe variability observed in the measurement of QA with the RM is similar to that generated by the MM itself when performing a second measurement under the same conditions.
The variability is greater as QA increases, but its clinical impact is negligible. Despite this, when interpreting the measurents after a period of follow-up we must bear in mind that the decreases in flow may be due to the intra-method variation itself and not to AV dysfunction.
The time invested in the measurement process is significantly reduced in the RM. The initiation of haemodialysis with inverted lines (a requirement of the RM) does not imply a reduction in the effectiveness of dialysis.
Therefore, we can affirm that the RM is a procedure to take into account to quantify the QA of AVFs.
Key concepts- •
The RM for the calculation of the QA with TD demonstrates a precision in the measurement which is equal to the MM.
- •
It makes it possible to save 20 min in the procedure time.
- •
It reduces the risk associated to manipulation vascular access.
- •
It has no implication to the dose dialysis in the session in which it is being used.
Data will be made available on request in lsanchez@friat.es
Conflicts of interestThe authors have no conflicts of interest to declare.
Please cite this article as: Sánchez Tocino ML, López González A, Villoria González S, González Sánchez MI, García Macías M, González Horna A, et al. Validación del método inverso para la determinación del flujo de acceso con termodilución. Nefrologia. 2022;42:56–64.


