Autosomal dominant polycystic kidney disease (ADPKD) causes destruction of the renal architecture due to the growth of cysts originated from the tubular epithelium, which primarily affects the collecting tubule.1 There is a reduction in urine concentrating ability, which correlates with renal volume and the number of renal cysts2 and it is present early in the disease, although the precise mechanisms are not fully understood.1,3 The blockade of vasopressin V2 receptors with tolvaptan is capable of delaying the growth in renal volume and slow down ng the deterioration in glomerular filtration.4,5 This blockade of vasopressin V2 receptors causes polyuria, often greater than 6–7l/day, with a reduction in urine osmolality (UOsm) to values sometimes <200mOsm/kg.6 It has been suggested that greater decreases in UOsm could be associated with a benefit in renal function.6 However, achieving UOsm <250mOsm/kg in morning urine may not provide additional benefit, so it would not be necessary to use maximum doses of tolvaptan.6
Measurement of UOsm with osmometer is not always available; thus we decided to compare osmometer values with calculated values.7 We collected data from 78 stable non-diabetic patients with ADPKD, not on tolvaptan, who had 24-h UOsm determined with an Osmomat 030 cryoscopic osmometer (sensitivity 1mOsm/kg, CV <±0.5%). We calculated the UOsm as:
The data are shown in Table 1. Urine Osm (U Osm) correlated (Spearman's Rho) with urine values of urea (r=0.76), creatinine (r=0.71), sodium (r=0.77), potassium (r=0.53) and calcium (r=0.58), all p<0.001, but not with uric acid, proteinuria or albuminuria.
Demographic characteristics and biochemical determinations performed in patients with polycystic kidney disease.
| N | 78 |
| Age (years) | 45±15 (45, 17–75) |
| Gender | 45 males (57.7%) |
| 33 females (42.3%) | |
| Serum | |
| Urea (mg/dl) | 53±28 (43; 20–140) |
| Creatinine (mg/dl)a | 1.50±0.88 (1.26; 0.62–4.30) |
| Urine | |
| Urea (mg/dl) | 1060±399 (1046, 244–2206) |
| Creatinine (mg/dl) | 73.7±31.0 (69; 23.7–183.4) |
| Sodium (mmol/l) | 91±39 (80; 33–194) |
| Potassium (mmol/l) | 32.3±10.7 (33.0; 7.8–64) |
| Calcium (mg/dl) | 6.3±5.3 (5.5; 0.4–27.3) |
| Uric acid (mg/dl) | 27.7±14.5 (26; 5–66.1) |
| Osmolality | |
| Measured (mOsm/kg) | 430±160 (400; 158–872) |
| Calculated (mOsm/kg) | 429±149 (421; 157–844) |
| GFR-MDRD (ml/min/1.73m2) | 64.8±32.0 (14.4–141.5) |
The median and range for quantitative variables and the percentage for gender are shown in parentheses.
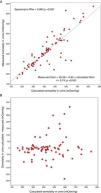
The UOsm measured with an osmometer was +1.1±82.3mOsm/kg higher than the UOsm calculated, median +8.4mOsm/kg, with a range −312.7 and +235.7mOsm/kg. Measured UOsm was higher than calculated UOsm in 60.3% of the patients. Fig. 1A shows the degree of association between the U osm measured and calculated and Fig. 1B shows the absolute bias with respect to the calculated osmolality. The bias between calculated and measured UOsm was not related to values of measured UOsm or the concentration of the measured substances.
A. Correlation between the calculated urine osmolality and the urine osmolality measured with an osmometer in a 24-h urine sample in patients with autosomal dominant polycystic kidney disease. B. Bias between the calculated urine osmolality and the urine osmolality measured with an osmometer versus the calculated osmolality in a 24-h urine sample in patients with autosomal dominant polycystic kidney disease.
Patients were classified in five groups according to UOsm: ≤150, 151–250, 251–350, 351–500 and >500mOsm/kg. The frequency of presentation of each group was 0%, 9%, 26.9%, 33.3% and 30.8%, respectively, for the measured UOsm and 0%, 10.3%, 23.1%, 35.9% and 30.8%, respectively, for the calculated UOsm. The Kappa agreement index was 0.64 (p<0.001), which indicates good correspondence, although with a significant classification error. Based on a calculated UOsm, the correct classification probability was 62.5% for UOsm 151–250mOsm/kg, 72.2% for calculated UOsm 251–350mOsm/kg, 71.4% for 351–500mOsm/kg and 83.3% when it was >500mOsm/kg. To detect UOsm <250mOsm/kg with the calculation formula, the positive predictive value of was 62.5% and a negative predictive value of 97.1%.
The data shows, that in ADPKD there is a significant difference between the UOsm values measured and calculated. The correlation is acceptable, but in some individuals there is no correlation. Most calculated values are somewhat lower than the measured values, since there are metabolites in urine not included in the formula which contribute to the measured UOsm. Other studies have not found good correlation between measured UOsm and the elimination of solutes in patients with ADPKD.2
We detected calculated UOsm values much higher than the measured value; there were cases with calculated UOsm between 300 and 650mOsm/kg. The calculated UOsm is more reliable if the UOsm >500mOsm/kg, however in the lower ranges the overestimation of calculated Oosm may have clinical relevance if the dose of tolvaptan is modified based on the calculated UOsm being <250mOsm/kg. It should be taken into consideration that the UOsm in 24-h urine yields lower values than morning urine, which is what was used in the TEMPO 3:4 trial.7 The UOsm values in 24-h urine are <200mOsm/kg, so it is advisable to measure the UOsm with osmometry.4 Also, in patients with worse renal function, initial UOsm is already reduced and with less than maximum doses of tolvaptan the UOsm could be <250mOsm/kg therefore it is convenient to measure the UOsm with osmometer.
In conclusion, in patients with ADPKD who are not on treatment with tolvaptan, the calculated UOsm shows significant differences as compared with values of UOsm measured with an osmometer. If these results are reproduced in patients who are on tolvaptan, the impact on the monitoring of these patients should be assessed.
Please cite this article as: Borrego Utiel FJ, Camacho Reina MV, Moriana Domínguez C, Merino García E. Osmolalidad urinaria en pacientes con poliquistosis renal: ¿medida o calculada? Nefrologia. 2020;40:202–204.


