The KDIGO guidelines recommend as a criterion for referral to ACKD consultations a risk >10% of requiring renal replacement therapy before 2 years. This risk should be assessed with externally validated prediction models. The prediction models (KFRE) and the Grams model meet these requirements.
In an ACKD unit with a remission criterion of eGFR <30 mL/min, we proposed a retrospective cohort study to evaluate whether the application of a KFRE > 10% as a remission criterion allows differentiation of patients according to their clinical and analytical characteristics and their evolution.
Materials and methodsWe studied 573 patients followed in the ACKD clinic for at least 4 years. In the first consultation we classified them into two groups according to their 2-year KFRE: < or ≥10%. We compared their clinical and analytical characteristics and whether the prognoses made by Grams' model at baseline matched the observed evolution. Both groups were analyzed according to two age ranges: older and younger than 75 years.
ResultsPatients with KFRE ≥ 10% (53.4%), with respect to those with KFRE < 10%, were significantly younger and their annual eGFR loss was greater. They had different evolution: at 2 years, 38.9% vs 3% (p < 0.05) started RRT and 45.8% vs 79.8% (p < 0.05) remained in the clinic; at 4 years, 60.7% vs 15.6% (p < 0.05) started RRT and 16.7% vs 52.3% (p < 0.05) remained in the clinic.
In the group with KFRE < 10% those ≥75 years vs <75 years initiated RRT and died previously in a significantly different proportion at 2 years: 1.2 vs 6.1 % and 23.7 vs 6.1 % respectively (P < 0.05).
In the group with KFRE ≥ 10% those ≥75 years and those <75 years initiated RRT and previously died in a significantly different proportion at 2 years: 25.9 vs 46.4 % and 32.1 vs 5.7 % respectively (P < 0.05).
Prediction models predicted all these differences quite accurately.
ConclusionsA KFRE ≥ 10% at 2 years would be an appropriate criterion for referral to ACKD consultations, since it would select a group of patients who are really going to require RRT in the medium term, regardless of their age, and would avoid the referral of patients at low risk of requiring RRT, mainly elderly patients.
Las guías KDIGO recomiendan como criterio de remisión a las consultas de ERCA un riesgo >10% de precisar tratamiento renal sustitutivo antes de 2 años. Este riesgo se debe evaluar con modelos de predicción validados externamente. Los modelos de predicción (KFRE) y el de Grams cumplen estos requisitos.
En una unidad de ERCA con un criterio de remisión de FGe <30 ml/min, planteamos un estudio de cohortes retrospectivo para evaluar si la aplicación de un KFRE > 10% como criterio de remisión permite diferenciar a los pacientes según sus características clínicas y analíticas y su evolución.
Pacientes y métodosEstudiamos 573 pacientes seguidos en la consulta de ERCA al menos durante 4 años. En la primera consulta los clasificamos en dos grupos según su KFRE a dos años: < o ≥10%. Comparamos sus características clínicas y analíticas y si los pronósticos efectuados por el modelo de Grams al inicio se ajustan a la evolución observada. Ambos grupos se han analizado según dos rangos de edad: mayores y menores de 75 años.
ResultadosLos pacientes con KFRE ≥ 10% (53,4%), con respecto los que tenían KFRE < 10%, eran significativamente más jóvenes y su pérdida anual de FGe fue mayor. Tuvieron diferente evolución: a los 2 años iniciaron TRS el 38,9% vs 3% (p < 0,05) y permanecieron en la consulta el 45,8% vs el 79,8% (p < 0,05), a los 4 años iniciaron TRS el 60,7% vs 15,6% (p < 0,05), permanecieron en la consulta el 16,7% vs 52,3% (p < 0,05).
En el grupo con KFRE < 10% los ≥ 75 años frente a los <75 años iniciaron TRS y fallecieron previamente en una proporción significativamente diferente a los 2 años: 1,2 vs 6,1 % y 23,7 vs 6,1 % respectivamente (P < 0,05).
En el grupo con KFRE ≥ 10% los ≥75 años y los <75 años iniciaron TRS y fallecieron previamente en una proporción significativamente diferente a los 2 años: 25,9 vs 46,4 % y 32,1 vs 5,7 % respectivamente (P < 0,05).
Los modelos de predicción pronosticaron todas estas diferencias con bastante exactitud.
ConclusionesUn KFRE ≥ 10% a dos años sería un adecuado criterio de remisión a las consultas de ERCA, ya que seleccionaría un grupo de pacientes que realmente van a precisar TRS a medio plazo, independientemente de su edad y evitaría la remisión de enfermos con escaso riesgo de precisar TRS, fundamentalmente pacientes de edad avanzada.
The 2012 Kidney Disease: Improving Global Outcomes (KDIGO) guidelines on the evaluation and management of chronic kidney disease (CKD) recommend classifying CKD into different grades according to the estimated glomerular filtration rate (eGFR) and the microalbuminuria/creatine ratio in the urine.1 This classification allows for the assignment of a relative risk of developing different complications regarding the specific degree of CKD. However, although we are aware of the relative risk of initiating renal replacement therapy (RRT) for a specific stage of CKD, the absolute risk of initiating RRT for each patient included in that specific stage of CKD varies in a wide range.
For this reason, the new edition of the 2024 KDIGO guidelines emphasizes the need to individualize the management of patients not only by their stage of CKD but also by determining their absolute risk of requiring RRT.2 In patients with CKD G3-G5, it is proposed that the absolute risk of requiring RRT be estimated using externally validated equations (Grade of recommendation 1A).
The kidney failure risk equation (KFRE)3 is the most widely used model for predicting the need for RRT because of its high accuracy and extensive validation in different populations.4–6
The use of the KFRE as a valid tool to predict the need to initiate RRT has allowed for the KDIGO guidelines to recommend a risk of initiating RRT within 2 years above 10% as a criterion for referral for multidisciplinary advanced chronic kidney disease (ACKD) clinic consultations.2 This would enable the selection of an ideal group of patients who would derive maximum benefit from these highly specialized consultations and avoid the referral of patients with a low risk of progression who would not benefit from early inclusion in ACKD consultations.
The KFRE has also been validated in different age groups,7 although in elderly patients with high mortality, the need to initiate RRT may be overestimated.8
In ACKD consultations, elderly patients are becoming increasingly prevalent, and their management constitutes a major challenge owing to the fact that as age increases, the risk of death exceeds that of requiring RRT even in very advanced stages of CKD.9 It has been reported that over the age of 75 years, the majority of patients with stage IV CKD exhibit a higher risk of death than that of initiating RRT.10,11
The Grams prediction model 12 is also a proven model that, in addition to predicting entry into RRT, provides an estimate of mortality risk, which can be useful in guiding management in populations with high mortality, such as elderly patients with advanced CKD G4+ and high comorbidity 6,13,14.
The objective of this study is to evaluate the consequences of using a risk threshold of 10% of requiring RRT at two years, estimated by KFRE, as a criterion for referral to ACKD consultation. To this end, the evolution of patients with a KFRE greater and less than 10% was compared, considering their age groups. We also analyzed whether the prognostic predictions of the Grams model were fulfilled in each of these groups.
Population and methodsPopulationA retrospective cohort study was conducted in adult patients (older than 18 years) who were referred to the ACKD clinic of the Alcorcón Foundation University Hospital between January 1, 2013, and December 31, 2020. The follow-up of the patients lasted until December 31, 2024, thus guaranteeing a minimum follow-up time of 4 years.
Inclusion criteriaAll incident patients who participated in an ACKD consultation during the indicated time period, who were older than 18 years, and who presented an eGFR < 30 mL/min were included.
Exclusion criteriaThe following patients were excluded from the study:
- 1
Patients referred after an episode of acute renal failure who recovered renal function and achieved an eGFR > 30 mL/min.
- 2
Transplant patients with renal dysfunction who were referred for initiating RRT.
- 3
Patients who initiated RRT on the same day as their first ACKD consultation.
- 4
Patients who were lost to follow-up after the first consultation.
- 5
Patients without sufficient analytical data to perform prognostic calculations on their evolution.
A total of 622 patients met the inclusion criteria; of these patients, 49 were excluded because they met any of the abovementioned criteria. Therefore, the final study population consisted of 573 patients. The population flow diagram is presented in Fig. 1.
Study design
This is a retrospective cohort study analyzing different clinical, analytical, and evolutionary variables from reviews carried out in ACKD consultations, which are collected in a database during each review.
Collection of clinical data and follow-upIn the first consultation, the affiliation data and clinical characteristics of the patients, including age, sex, etiology of CKD, history of cardiovascular pathology (such as stroke, ischemic heart disease, heart failure and peripheral vascular disease), diabetes mellitus, history of smoking and other comorbidities necessary for the calculation of the Charlson comorbidity index, were recorded. Similarly, data involving blood pressure, body mass index (BMI) and basic analytical parameters were obtained, and patients were classified according to the CKD stage.
The frequency of consultations was mainly adjusted according to the clinical evolution of the patient, as well as changes in symptoms and eGFR values, at the discretion of the attending physician. In patients with CKD stage G4A1, a minimum of three visits per year was ensured according to the recommendations of the KDIGO guidelines.1
In the follow-up consultations, the analytical results, blood pressure data, BMI and relevant clinical events were systematically collected. The serial measurements of the eGFR values at each visit allowed for the calculation of the rate of progression of renal deterioration in each patient via simple linear regression using the least squares method.
Evolutionary eventsThe following clinical outcomes were considered in the evolution of patients treated in the ACKD clinic:
- •
Renal failure, which was defined as the start of RRT (either through hemodialysis, peritoneal dialysis or the performance of a preventive kidney transplant).
- •
Death (whether it occurred before or after the initiation of RRT).
- •
Continuation in the ACKD clinic (without requiring RRT or having died before starting RRT).
These evolutionary events were recorded at 2, 4 and 5 years from the date of admission to the ACKD clinic, with the aim of evaluating the different predictive models of evolution.
Predictive models of evolutionIn the first consultation, two prognostic prediction models were applied to estimate the clinical evolution of the patients: the KFRE model with 4 variables (calibrated for the non-North American population), which was applied at 2 and 5 years; and the Grams model, which was applied at 2 and 4 years.
The KFRE model estimates the probability of requiring RRT within 2 or 5 years in patients with an eGFR < 60 mL/min. The adjusted version for non-North American populations was used, which was developed by the Tangri group3; moreover, it utilizes four variables, including age (in years), sex, eGFR (calculated via the CKD-EPI formula, in mL/min) and the albumin/creatinine ratio in the urine (mg/g).
The Grams model is applied to patients with an eGFR < 30 mL/min and offers a more detailed prediction by estimating the probabilities of initiating RRT; dying before initiating RRT; remaining with CKD without initiating RRT or dying; or dying after the initiation of RRT. The forecast is calculated for time periods of 2 and 4 years. The variables included in the model were age, sex, race, eGFR, systolic blood pressure, history of cardiovascular disease, diabetes mellitus status, the urinary albumin/creatinine ratio and history of smoking. The individual probabilities were calculated by using the multinomial formulas provided by the Grams group.12
Based on the KFRE result at 2 years, incident patients were classified into two groups according to their risk of needing RRT: low risk (KFRE < 10%) and high risk (KFRE ≥ 10%).
Subsequently, their clinical and analytical characteristics, initial prognosis and observed evolution were compared, with the aim of assessing whether this risk threshold is adequate as a criterion for referral for an ACKD consultation. In addition, both groups were subdivided according to age (<75 years and ≥75 years) to analyze whether age affects the evolution or accuracy of the predictive model.
Ethical approvalThe study was performed in accordance with the ethical principles established in the Declaration of Helsinki and was approved by the Clinical Research Ethics Committee of the Alcorcón Foundation University Hospital (Alcorcón, Madrid, Spain) with reference number 22/157. Given the retrospective nature of the study and the high proportion of patients who were no longer receiving follow-ups (either due to death or having initiated RRT [dialysis or transplantation] in other centers), the ethics committee waived the need to obtain informed consent.
Statistical analysisContinuous variables are expressed as the means ± standard deviations when they are normally distributed or as the medians and interquartile ranges when they are nonnormally distributed. The categorical variables are presented as absolute frequencies and percentages. The normality of the continuous variables was verified by using the Kolmogorov-Smirnov test. For the comparison of means, the Student’s t-test was used in the case of a normal distribution, and the Mann-Whitney test was used when the distribution was not normal. Categorical variables were compared by using the chi-square test. A p value < 0.05 was considered to indicate statistical significance.
To evaluate the performance of the predictive models, a discrimination analysis of both the KFRE model (at 2 and 5 years) and the Grams model (at 2 and 4 years) was performed after considering the initiation of RRT, continuation in the ACKD clinic without RRT or death and death before the initiation of RRT as events. The discriminative capacity of each model was evaluated by using the area under the receiver operating characteristic (ROC) curve (AUC or C statistic), along with its corresponding 95% confidence interval (CI). Acceptable discrimination was considered if the AUC value was ≥0.70, and it was considered to be excellent if it was ≥0.80. The calibration of the models (specifically, the degree of agreement between the predicted probabilities and the observed events) was analyzed by using the Hosmer-Lemeshow test.15
Statistical analysis was performed by using IBM SPSS Statistics for Windows, version 22.0 (IBM Corp., Armonk, NY, USA).
To estimate the annual loss of renal function, the slope of the linear regression of the eGFR as a function of follow-up time at the ACKD consultation was calculated. This slope represents the estimated annual change in the eGFR, which was obtained by using a least squares linear regression model including all of the eGFR determinations performed during outpatient follow-up, following the recommendations of various authors.16–18
Determinations made during hospital admission were excluded from the analysis. Similarly, seven patients with
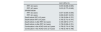
ResultsEvaluation of the performance of the predictive modelsTable 1 shows the discrimination of the two predictive models by calculating the area under the ROC curve with a confidence interval of 95%. The prediction capability of the onset of RRT within 2 years of the two models demonstrated an excellent discrimination, with an AUC value of 0.87 being observed; moreover, discrimination at 4 and 5 years decreased, although it remained >0.8. In the prediction of death before initiating RRT and continuation in the ACKD clinic performed by the Grams model, an acceptable AUC value was maintained at approximately 0.75. These values are similar to those reported in the literature.8,13,14
Discrimination of KFRE with 4 variables at 2 and 5 years and the Grams model results at 2 and 4 years.
| AUC (95% CI) | |
|---|---|
| RRT at 2 years | 0.872 (0.838–0.905) |
| RRT at 5 years | 0.810 (0.773–0.848) |
| GRAMS Model | |
| RRT at 2 years | 0.877 (0.845–0.909) |
| RRT at 4 years | 0.839 (0.807–0.872) |
| Death before RRT at 2 years | 0.746 (0.694–0.797) |
| Death before RRT at 4 years | 0.755 (0.712–0.797) |
| Death before or after RRT at 2 years | 0.725 (0673–0.777) |
| Death before or after RRT at 4 years | 0.738 (0.696–0.781) |
| Continuation in the ACKD clinic at 2 years | 0.758 (0.716–0.799) |
| Continuation in the ACKD clinic at 4 years | 0.748 (0.709–0.788) |
RRT: renal replacement therapy; ACKD: advanced chronic kidney disease.
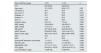
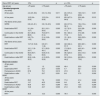
Upon arrival at the ACKD consultation, 267 patients (46.6%) demonstrated a KFRE < 10% and were classified as patients with a low risk of initiating RRT; the remaining 306 patients (53.4%) demonstrated a KFRE ≥ 10% and were classified as patients at a high risk of initiating RRT. Compared with high-risk patients, low-risk patients were significantly older, had a higher Charlson Index, smoked less, exhibited less hypertension, and demonstrated higher eGFR values, whereas their proteinuria and annual decrease in eGFR values were significantly lower (Table 2).
Comparison of the clinical and analytical characteristics at the beginning of follow-up in the ACKD consultation of patients with a risk of initiating RRT within 2 years (estimated via the KFRE with 4 variables) < 10% vs. those with a risk equal to or greater than 10%.
| Risk of SDB at 2 years | <10% | ≥ 10% | p |
|---|---|---|---|
| n/% | 267/46.6% | 306/53.4% | |
| Age, years | 76.1 (10.5) | 68.8 (13.7) | 0.00 |
| <75 years, % | 36.7 | 63.4 | 0.00 |
| Sex, men, % | 60.1 | 70.8 | 0.010 |
| Diabetes, % | 54.7 | 59.5 | 0.247 |
| Smoker, % | 11.6 | 20.3 | 0.005 |
| ECV, % | 56.6 | 49.0 | 0.072 |
| Charlson Index | 8 (6–10) | 7 (5–9) | 0.000 |
| SBP, mmHg | 139.4 (20.5) | 148.9 (23.7) | 0000 |
| DBP, mmHg | 71.9 (11.7) | 77.2 (12.9) | 0.000 |
| IMC, kg/m2 | 28.7 (25.8–32.3) | 28.5 (25–32.3) | 0.258 |
| eGFR, mL/min | 23.8 (20.2–23.8) | 18.0 (14.6–21.7) | 0.000 |
| Mau/cro ratio, mg/g | 48.6 (10.9–153.7) | 999.2 (428–1949) | 0.000 |
| A3% | 15.4 | 82.4 | 0.000 |
| G5% | 3.0 | 28.4 | 0.000 |
| Annual eGF decrease, mL/min/year | −3.1 (3.1) | −5.9 (5.3) | 0.000 |
| Albumin, g/dL | 4.2 (4–4.2) | 4.1 (3.8–4.3) | 0.000 |
| Hemoglobin, g/dL | 12.1 (11.1–13.1) | 11.6 (10.7–12.7) | 0.000 |
| PTH, pg/mL | 93.9 (55.1–133.5) | 123.8 (76.3–211.3) | 0.000 |
| LDL Cholesterol, mg/dL | 73 (59–92) | 73 (58–94) | 0.789 |
A3: patients with a microalbuminuria/creatine ratio in the urine (mau/cro) > 300 mg/g; CVD: cardiovascular disease; G5: patients with an eGFR by CKD-EPI < 15 mL/min; SBP: systolic blood pressure; DBP: diastolic blood pressure; BMI: body mass index; eGFR: estimated glomerular filtration rate; PTH: parathyroid hormone.
The data are shown as the means (standard deviations), medians (interquartile ranges) or numbers and percentages.
The annual decrease in the eGFR is expressed as the mean decrease in the eGFR in patients who exhibited decreases in the eGFR during follow-up (in the low-risk group, 81.2% demonstrated decreases in the eGFR during follow-up; in the high-risk group, 95% demonstrated decreases).
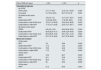
The observed progression at 2, 4 and 5 years was significantly different between patients who were at low risk and those who were at high risk (Table 3); specifically, at 2 years, 3% vs. 38.9% had initiated RRT (p < 0.05), whereas at 4 years, 52.3% vs. 16.7% had initiated RRT (p < 0.05), and 32.1% vs. 22.6% had died before initiating RRT (p < 0.05).
Comparison of the prognosis at the beginning of follow-up in the ACKD clinic of patients with a risk of initiating RRT within 2 years of < 10% compared to those who had a risk equal to or greater than 10%. We also compared the evolution observed at 2, 4 and 5 years in patients in both groups.
| Risk of SDB at 2 years | < 10% | ≥ 10% | p |
|---|---|---|---|
| Calculated prognosis | |||
| By KFRE | |||
| At two years | 3.7 (1.7–6.3) | 21.5 (15.1–35.6) | 0.000 |
| Five years | 13.7 (6.4–22.3) | 60.7 (47–81.9) | 0.000 |
| By Grams at two years | |||
| RRT | 4.9 (2.4–7.3) | 21.7 (16.1–32.7) | 0.000 |
| Death before RRT | 16.3 (9.8–22.2) | 17.8 (8.3–29.3) | 0.152 |
| Continuation in the ACKD clinic | 79.3 (71.5–84.9) | 55.4 (44.3–66.8) | 0.000 |
| Death before or after RRT | 17.3 (10.7–23.6) | 22.5 (12.7–36.1) | 0.000 |
| By Grams at four years | |||
| SRRD | 9.8 (4.9–14.3) | 36.0 (26.4–50.3) | 0.000 |
| Death before RRT | 30.8 (20.2–41.7) | 29.8 (12.6–45.6) | 0.238 |
| Continuation in the ACKD clinic | 59.5 (46.9–70.9) | 28.1 (18.7–41.5) | 0.000 |
| Death before or after RRT | 33.7 (21.9–46.0) | 44.7 (27.9–62.9) | 0.000 |
| Observed evolution | |||
| At two years | |||
| RRT | 3.0 | 38.9 | 0.000 |
| Death before RRT | 17.2 | 15.4 | 0.545 |
| Continuation in the ACKD clinic | 79.8 | 45.8 | 0.000 |
| Death before or after RRRT | 17.6 | 19.3 | 0.606 |
| At four years | |||
| SRRD | 15.6 | 60.7 | 0.000 |
| Death before RRT | 32.1 | 22.6 | 0.012 |
| Continuation in the ACKD clinic | 52.3 | 16.7 | 0.000 |
| Death before or after RRT | 34 | 35.5 | 0.698 |
| At five years | |||
| SRRa | 21.2 | 65.5 | 0.000 |
RRT: renal replacement therapy; ACKD: advanced chronic kidney disease.
The prognostic estimates are presented as medians (interquartile ranges), and the observed evolutions are presented as percentages.
These different evolutions were fairly accurately predicted by the prediction models (Table 3). The evolution of low-risk patients observed at 2 and 4 years is shown in Fig. 2, along with the prediction made by the Grams model upon initial ACKD clinic consultation for the same time periods. The model demonstrated a good predictive capability for the initiation of RRT, continuation of treatment at the ACKD clinic or death before initiating RRT. The main discrepancy was observed in the initiation of RRT at 4 years, which is possibly attributable to the inclusion of patients with autosomal dominant polycystic kidney disease (ADPKD) in the low-risk group. These patients (when presenting with nonproteinuric nephropathy) were classified as low risk by the model, although in clinical practice, they require RRT at a high percentage. If we excluded these patients, the rate of initiation of RRT at 4 years would be 11.3% observed vs. 9.6% predicted.

Observed evolution and initial prognosis according to the Grams model at 2 years (A) and at 4 years (B) in patients with a risk <10% of initiating RRT.
The calculated prognosis (a quantitative variable) is expressed as the mean, and its standard deviation is presented. The observed evolution (qualitative variable) represents the percentage of patients in each category.
The Hosmer-Lemeshow test was used to compare the goodness of fit between the calculated prognosis and observed evolution (a p value closer to 1 indicates a better fit; if p < 0.05, the fit is not significant). A) RRT: p = 0.523; death before RRT: p = 0.933; continuation in the ACKD clinic: p = 0.189. B) RRT: p = 0.516; death before RRT: p = 0.392; continuation in the ACKD clinic: p = 0.023.
RRT: renal replacement therapy; ACKD: advanced chronic kidney disease.
When the risk of initiating RSRD was observed to be high, the agreement between the prediction and the observed evolution was not as precise (Fig. 3). The percentage of patients initiating RRT was much greater than that predicted by the Grams model and increased over the years. At 2 years, the prediction of initiating RRS was 25.2%; however, 38.9% initiated RRT. At 4 years, the difference increased at 39.2% predicted vs. 60.7% observed. The observed mortality was always lower than predicted.

Observed evolution and initial prognosis according to the Grams model at 2 years (A) and at 4 years (B) in patients with a risk ≥10% of initiating RRT.
The calculated prognosis (a quantitative variable) is expressed as the mean, and its standard deviation is presented. The observed evolution (qualitative variable) represents the percentage of patients in each category.
The Hosmer-Lemeshow test was used to compare the goodness of fit between the calculated prognosis and observed evolution (a p value closer to 1 indicates a better fit; if p < 0.05, the fit is not significant). A) RRT: p = 0.813; death before RRT: p = 0.620; continuation in the ACKD clinic: p = 0.207. B) RRT: p = 0.703; death before RRT: p = 0556; V: p = 0.047.
RRT: renal replacement therapy; ACKD: advanced chronic kidney disease.
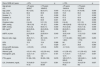
Among patients with a low risk of initiating RRT, those patients ≥ 75 years demonstrated more cardiovascular comorbidities and a higher Charlson comorbidity index, along with smoking at a lower frequency; moreover, their analytical characteristics were similar to those of patients < 75 years, with a similar rate of decrease in the eGF being observed, in addition to being referred to the ACKD clinic with lower eGF values (Table 4). With respect to evolution (Table 5), the mortality before the need for RRT was observed to be high (23.7% at 2 years), with a minimal need to initiate RRT (1.2% at 2 years), whereas patients < 75 years exhibited a significantly different mortality and requirement for SRRD (with a mortality rate before RRT within 2 years of 6.1% and an RRT of 6.1%). This evolution was quite accurately predicted via the prediction models (Table 5).
Comparison of the clinical and analytical characteristics at the beginning of follow-up in the ACKD clinic of patients with a risk of initiating RRT within 2 years of less than or greater than 10% (calculated via the KFRE with 4 variables), according to the specific age group: younger or older than 75 years.
| Risk of SDB at 2 years | <10% | p | ≥ 10% | p | ||
|---|---|---|---|---|---|---|
| Age groups | <75 years | ≥ 75 years | <75 years | ≥ 75 years | ||
| n/% | 98/36.7 | 169/63.3 | 194/64.4 | 112/36.6 | ||
| Age, years | 65.1 (8.3) | 82.5 (4.7) | 0.000 | 61.2 (11.2) | 81.9 (4.8) | 0.000 |
| Sex, men, % | 60.2 | 60.9 | 0.905 | 74.5 | 65.2 | 0.093 |
| Smoker, % | 17.3 | 8.3 | 0.026 | 25.8 | 10.7 | 0.002 |
| Diabetes, % | 52.0 | 56.2 | 0.509 | 57.2 | 63.4 | 0.289 |
| ECV, % | 43.9 | 63.9 | 0.001 | 44.8 | 56.2 | 0.055 |
| Charlson Index | 6 (4–8) | 9 (7–10) | 0.000 | 6 (4–8) | 8 (7–10) | 0.000 |
| SBP, mmHg | 136.6 (19) | 141 (21) | 0.084 | 146.8 (24.8) | 152.5 (21.4) | 0.035 |
| DBP, mmHg | 75.5 (12) | 69.8 (11) | 0.000 | 79.3 (12.9) | 73.6 (11.9) | 0.000 |
| IMC, kg/m2 | 28.9 (25.8–33,1) | 28.3 (25.8–32.3) | 0.358 | 28.8 (25.1–32.5) | 28.5 (24.9–32.1) | 0.839 |
| eGFR, mL/min | 24.5 (20.6–75) | 23.5(19.9–26) | 0.040 | 18.9 (14.9–23.0) | 17.0 (13.2–19.6) | 0.000 |
| Mau/cro ratio, mg/g | 49.9 (15.1–140.9) | 46.1 (8.9–174.1) | 0.771 | 1.111.2 (440–1.951) | 944.4 (397–1.775) | 0.263 |
| A3% | 15.3 | 15.4 | 0.986 | 84 | 79.5 | 0.314 |
| G5% | 0 | 4.7 | 0.029 | 24.7 | 34.8 | 0.060 |
| Annual eGF decrease, mL/min/year | −3.5 (3.3) | −2.9 (3) | 0.253 | −6.1 (5.4) | −5.6 (5.1) | 0.431 |
| Albumin, g/dL | 4.3 (4.1–4.4) | 4.2 (3.9–4.4) | 0.003 | 4.1 (3.8–4.3) | 4.1 (3.8–4.2) | 0.491 |
| Hemoglobin, g/dL | 12.2 (11.4–13.2) | 12.0 (11–13) | 0.181 | 11.7 (10.7–12.7) | 11.5 (10.7–12.6) | 0.457 |
| PTH, pg/mL | 91 (59–132) | 95 (53–138) | 0.876 | 125.5 (70.7–229.2) | 122.9 (83.1–162.8) | 0.453 |
| LDL Cholesterol, mg/dL | 75.5 (60.5–91.5) | 72.0 (57–93.59 | 0.581 | 72.0 (57.5–94.5) | 75.0 (57.8–93) | 0.637 |
The data are shown as the means (standard deviations), medians (interquartile ranges), or numbers and percentages.
A3: patients with a microalbuminuria/creatine ratio in the urine (mau/cro) > 300 mg/g; CVD: cardiovascular disease; G5: patients with an eGFR by CKD-EPI < 15 mL/min; SBP: systolic blood pressure; DBP: diastolic blood pressure; BMI: body mass index; eGFR: estimated glomerular filtration rate; PTH: parathyroid hormone.
Comparison of the prognosis of patients younger or older than 75 years at the start of follow-up in the ACKD clinic, according to the risk group involving the initiation of RRT within 2 years (as estimated via the KFRE with 4 variables). Additional comparison of the evolution observed at 2, 4 and 5 years in the patients in the respective groups.
| Risk of RRT at 2 years | 10% | p | p ≥ 10% | p | ||
|---|---|---|---|---|---|---|
| Age groups | <75 years | ≥ 75 years | <75 years | ≥ 75 years | ||
| Calculated prognosis | ||||||
| Por KFRE | ||||||
| At two years | 4.4 (2.5–6.8) | 3.3 (1.4–5.8) | 0.011 | 24.3 (15.3–38.5) | 18.9 (14.7–26.8) | 0.001 |
| Ar five years | 16.2 (9.4–23.9) | 12.3 (5.4–20.8) | 0.010 | 65.9 (47.5–84.8) | 55.6 (46–70.1) | 0.010 |
| Per Grams at two years | ||||||
| SRRD | 6.8 (4.3–9.1) | 3.6 (1.8–6.5) | 0.000 | 24.6 (17.6–36.1) | 18.4 (13.4–24.5) | 0.000 |
| Death before RRT | 9.1 (6.4–12.7) | 20.1 (16.1–26.3) | 0.000 | 10.7 (5.3–17.1) | 32.0 (28–39.6) | 0.000 |
| Continuation in the ACKD clinic | 84.1 (80.2–88.0) | 75.3 (67.7–81.4) | 0.000 | 63,1 (50.4–71.5) | 47.0 (38–54.5) | 0.000 |
| Death before or after RRT | 9.9 (7.0–14.0) | 21.4 (16.8–28.0) | 0.000 | 15.1 (8.5–21.8) | 39.9 (32.5–46.9) | 0.000 |
| Per Grams at four years | ||||||
| RRT | 13.7 (9–18.2) | 6.9 (3.7–11.8) | 0.000 | 42.6 (32.4–57.7) | 28.0 (20.1–35.1) | 0.000 |
| Death before RRT | 18.1 (11.9–24.7) | 37.1 (30.2–48.1) | 0.000 | 17.8 (8.2–28.8) | 49.5 (41–59.4) | 0.000 |
| Continuation in the ACKD clinic | 68.4 (59.7–76.0) | 53.8 (41.5–65.0) | 0.000 | 36.3 (23.9–47.5) | 20.3 (14.3–26.8) | 0.000 |
| Death before or after RRT | 20.6 (14.8–30.5) | 41.3 (32.5–52.9) | 0.000 | 32.3 (19.6–44.2) | 66.3(59.1–73.6) | 0.000 |
| Observed evolution | ||||||
| At two years | ||||||
| RRT | 6.1 | 1.2 | 0.023 | 46.4 | 25.9 | 0.000 |
| Death before RRT | 6.1 | 23.7 | 0.000 | 5.7 | 32.1 | 0.000 |
| Permanence in ACKD | 87.8 | 75.1 | 0.013 | 47.9 | 42 | 0.312 |
| Death before or after RRRT | 7.1 | 23.7 | 0.001 | 8.8 | 37.5 | 0.000 |
| At four years | ||||||
| SRRD | 29.5 | 7.8 | 0.000 | 71.6 | 41.4 | 0.000 |
| Death before RRT | 13.7 | 42.5 | 0.000 | 9.8 | 45 | 0.000 |
| Permanence in ACKD | 56.8 | 49.7 | 0.266 | 18.6 | 13.5 | 0.256 |
| Death before or after RRRT | 16.8 | 43.7 | 0.000 | 21.8 | 59.5 | 0.000 |
| At five years | ||||||
| RRT a | 36.5 | 12.3 | 0.000 | 78.4 | 42.7 | 0.000 |
RRT: renal replacement therapy; ACKD: advanced chronic kidney disease.
The prognostic estimates are presented as medians (interquartile ranges), and the observed evolutions are presented as percentages.
When comparing the evolution observed at 2 and 4 years with that predicted by the Grams model in the same time periods, in the two age groups (Table 5 and Appendix A; Figs. 1 and 2 of the Supplement), we observed that in both cases, the prediction and evolution were very similar, although in individuals < 75 years, the initiation of RRT was observed to be greater than estimated, especially in the long term (29.5% vs. 13.7% at 4 years, which was likely conditioned by the inclusion of patients with ADPKD, due to the fact that if we excluded these patients, the differences were reduced at 19.2% vs. 13.04%).
Comparison of patients with KFRE ≥ 10% according to age group (<75 years vs. ≥75 years)Among patients with a KFRE ≥ 10% who were aged ≥75 years, those patients aged <75 years demonstrated significantly greater hypertension, a higher Charlson comorbidity index, and a lower frequency of smoking; moreover, their analytical characteristics were similar, with a similar rate of deterioration of the eGFR being observed, although they were able to achieve an ACKD with a lower eGFR (Table 4).
In terms of evolution, both groups initiated RRT in very high percentages at both 2 and 4 years, although patients < 75 years accounted for a significantly greater proportion (46.4% vs. 25.9% at 2 years and 71.6% vs. 41.4% at 4 years, respectively; p < 0.05) (Table 5). Patients aged ≥75 years demonstrated significantly greater mortality prior to the initiation of RRS than those <75 years (32.1% vs. 5.7% at 2 years and 45% vs. 9.8% at 4 years; p < 0.05). The persistence in AKD consultations at 4 years was only 18.6% for patients <75 years and 13.5% for those ≥75 years (p = 0.26). The prediction models detected the same differences in terms of mortality and initiation of SRRD between the two groups.
The evolution observed at 2 and 4 years and that predicted by the Grams model in the same time periods in the two age groups are described in Table 5 and shown in Appendix A (Figs. 3 and 4 of the Supplement). We observed that in those patients older than 75 years, the observed evolution was quite similar to the predicted evolution, although patients initiated RRT at a higher percentage than what was predicted, especially at 4 years (41.4% vs. 28%). However, in high-risk patients <75 years, the prediction model was not very accurate with respect to predicting observed evolution, due to the fact that in both time periods, the differences were considered to be important in the three possible evolutions (initiation of RRT, exit from the study before initiating RRT and continuation in the ACKD clinic), with the beginning of RRS representing the greatest difference (71.6% at 4 years vs. 42.6% predicted).
DiscussionIn this study, we described how an estimated risk of requiring RRT within 2 years of 10% (which was calculated by using the KFRE model in patients with CKD disease stages of G4 or higher) serves as an adequate threshold for referral to ACKD consultations. Patients with a risk lower than 10% do not benefit from this referral, due to the fact that they demonstrate a very low probability of requiring RRT and conversely demonstrate a high risk of mortality, especially elderly patients (as predicted by the Grams model). In contrast, patients with a risk equal to or greater than 10% truly benefit from referral to ACKD consultations (regardless of their age) due to their high probability of initiating RRT in the short or medium term.
CKD is associated with a significant increase in the risks of cardiovascular events, mortality and progression to end stage renal disease requiring RRT.19 The rate of progression and incidence of these events increase as renal function deteriorates, although there is considerable interindividual variability.20 Therefore, the accurate identification of patients with an increased risk of progression is essential to properly plan their follow-up and prepare the initiation of RRT (involving dialysis or transplantation). In this context, the use of predictive models in high-risk patients (such as those with CKD stages of G4 or higher) has attracted special interest.21
Among the multiple available models, the KFRE and the Grams models are the most commonly used because of their ease of calculation, good prognostic accuracy and wide validation in different populations.4,22 The KFRE can exclusively predict the probability of the initiation of RRT in patients with an eGFR < 60 mL/min but does not consider death as a competing event, which can lead to an overestimation of the risk of RRT in populations with high mortality.23 Conversely, the Grams model is specifically designed for patients with CKD G4+, in consideration of the initiation of RRT and death as competing events; thus, it provides a more complete prognosis regarding mortality, the initiation of RRT and continuation in the ACKD clinic.
Both models have been simultaneously evaluated in patients with CKD G4+8,14; specifically, the Grams model has been investigated in elderly patients with CKD G4+,13 and the KFRE has been evaluated as a function of age in this population.5,7 With respect to stage G5 CKD in the elderly population, both models have been simultaneously compared.24,25 Unlike these studies, our research covers a broader population, from CKD G4A1 to G5A3, generating two groups that are comparable in terms of clinical characteristics and progression, classified according to a two-year RRT risk greater than or less than 10%, the threshold suggested by the K-DIGO guidelines.2 In addition, we have stratified both groups by age (< 75 and ≥ 75 years), an analysis not previously performed with both models together.
Due to this design, we confirmed that a risk threshold of 10% within2 years is adequate for referral for an ACKD consultation. The inclusion of patients with KFRE < 10% results in referring a considerable number of individuals with a very low probability of requiring RRT in the short or medium term. These patients, who demonstrated eGFR values < 30 mL/min but also demonstrated low proteinuria levels and an annual loss of moderate renal function, remained in the ACKD clinic for a long duration. Among these patients, elderly patients with more comorbidities represented the predominant group, with significant mortality prior to the initiation of RRT being observed. In this group, the prediction of the Grams model has demonstrated good accuracy, which aligns with previous studies reporting of adequate calibration for risks lower than 20%.8,14
Conversely, patients with a KFRE ≥ 10% demonstrated a considerable annual decrease in the eGFR, which translates to a high probability of requiring RRT in the short or medium term. In general, these patients demonstrated lower eGFR values; more proteinuria and hypertension; and a greater decrease in eGFR. Moreover, males and active smokers were the predominant groups among these patients. Within this group, elderly patients exhibited clinical and analytical characteristics that were similar to those of younger patients; additionally, they demonstrated a high rate of initiation of RRT. Therefore, age should not be an exclusive criterion for early referral to ACKD consultations, although the high comorbidity and mortality associated with this subgroup should be considered.
When the Grams model was applied to this high-risk population, several limitations were observed, as previously reported.13,14,25 In our study, this model tended to underestimate the risk of initiation of RRT, especially in elderly patients with high mortality and longer-term prognoses. Similar results were obtained by Provost et al.25 in elderly patients with CKD G5, who reported suboptimal calibration and discrimination. With respect to mortality, the calibration in our cohort was somewhat better than that described in the literature,13,14,24 although similar to other studies, we observed that predicted mortality was overestimated compared with observed mortality.
Our study demonstrates important strengths, such as a homogeneous follow-up performed by a small group of nephrologists throughout the study period, with minimal patient loss being reported. The simultaneous application of both models allows for a comprehensive risk assessment and the revalidation of these models in a broader Spanish population than the population that we previously examined in 2023.6 However, this study has several limitations. For example, it is a unicentric and retrospective study; moreover, the subdivision by age and risk generates subgroups with reduced sizes, which limits the statistical power. In addition, the high-risk group (KFRE ≥ 10%) included patients with wide ranges of risk, which may explain the discrepancies between the observed and calculated risks. The definition of the initiation of RRT was based on the original criteria of the models, although in current clinical practice, the indication for conservative treatment in elderly individuals is becoming increasingly common. Finally, patients did not receive current treatments such as SGLT2-i, GLP1-a or ns-MRA at significantly high rates; thus, the generalization of these findings to populations receiving these therapies should be performed with caution.
ConclusionsIn our population, the adoption of a KFRE ≥ 10% within 2 years as a criterion for referral to ACKD consultations is appropriate.
Referrals of patients with a KFRE < 10% results in including a large number of patients who will not require RRT in the short and medium term. In this group, the Grams model provides accurate prognoses, especially in elderly individuals, with this model predicting a low probability of initiating RRT and a high probability of remaining in the ACKD clinic or dying before requiring RRT, thus indicating little benefit from referral.
In contrast, patients with a KFRE ≥ 10% demonstrate a high probability of initiating RRSD in the short to medium term, although the Grams model tended to underestimate this need and overestimated mortality and continuation in the ACKD clinic. Regardless of age, these patients clearly benefit from referral to ACKD clinics because of their high risk of requiring RRT.
CRediT authorship contribution statementEGV designed the study. EGV, ARC, and SLSR collected the data. EGV performed the analysis. EGV, ARC, ELM, AMTR, DR, AMA, CCC, and EG analyzed and interpreted the data. EGV wrote the article and has final responsibility for its content. All of the authors contributed to the review and final approval of the manuscript.
FinancingThis research has not received specific support from public sector agencies, the commercial sector or nonprofit entities.
Ethical considerationsThe present study was approved by the CEIm of the Hospital Universitario Fundación Alcorcón (N. 22/157) and was performed in accordance with the Declaration of Helsinki, the International Council for Harmonization guidelines for Good Clinical Practice and Spanish laws.
The authors declare that they have no conflicts of interest.
The following is Supplementary data to this article: