
The impact of hepatitis virus infection on arterial calcification (AC) was not studied.
ObjectiveTo study the prevalence, severity and distribution of AC in incident hemodialysis patients with hepatitis B and C viral infection.
Cases and methods172 stage 5 CKD adults (98 male and 74 female) were included; 58 of them were seronegative for both hepatitis B and C (SN group), 48 were positive for hepatitis B virus infection (HBV group) and 66 were hepatitis C virus positive (HCV group). Beside histopathology of the obtained arterial samples, all these cases were examined for body mass index (BMI), serum calcium (Ca), phosphorus (P), alkaline phosphatase (AP), serum albumin, uric acid (UA), alanine transaminase (ALT), parathormone (PTH), fibroblast growth factor 23(FGF23), interleukin 6 (IL6), and 25 hydroxy vitamin D (25 (OH) vit D), hemoglobin concentration, and serum ferritin.
Results86 (50%) of the cases had AC; 11 of them were in SN group (19%), 9 in HBV group (18.8%) and all the 66 HCV group (100%). In SN group, 4 had intimal calcification, 5 had medial calcification, and 2 had both intimal and medial calcification. In HBV group, 9 had intimal calcification, while no cases were encountered with either medial or both site calcifications. In HCV group, 16 had intimal calcification, 31 had medial calcification, and 19 had both intimal and medial calcification. Calcification was in the form of spots in one case in SN group, and 6 cases in HBV group, a single plaque of calcification in 5 cases of SN group, 3 cases of HBV group, and 16 cases of HCV group, multiple plaques were detected in 4 cases in SN group, and 31 cases in HCV group, and diffuse calcification in one case in SN group, and 19 cases in HCV group.
In HBV group, calcification was only detected in patients with high viremia, while all patients with low or moderate viremia were devoid of calcification. In HCV group, all patients with low viremia had intimal solitary plaque of calcification, all patients with moderate viremia had multiple plaques of medial calcification, while all patients with high viremia had diffuse intimal and medial calcification. Both groups of viral hepatitis were significantly different in comparison to SN group in either distribution or calcification score (P<0.001 in all).
HBV group had significantly lower serum P, CaxP and PTH in comparison to SN group (4.6±0.66 vs. 5.45±0.77mg/dL, 36.4±7.2 vs. 44.1±8.69, and 348±65.4 vs. 405.9±83.2pg/mL, P<0.001, <0.001, and 0.035 respectively). On the other hand, HCV group did not show any significant difference in any of the studied parameters compared to SN group.
ConclusionHCV positive patients are more prone to develop AC that is more extensive. HBV positive patients were less likely to have arterial medial calcification, probably related to lower serum phosphorus, CaxP product and PTH. HCV infection should be added as risk factor for AC among CKD patients. Further studies are needed to confirm these findings.
No se había estudiado el impacto de la infección por el virus de la hepatitis en la calcificación arterial (CA).
ObjetivoEstudiar la prevalencia, la intensidad y la distribución de la CA en nuevos pacientes en hemodiálisis con infección por hepatitis B y C.
Casos y métodosSe incluyeron 172 pacientes con ERC en estadio 5 (98 varones 74 mujeres); 58 de ellos eran seronegativos para el virus de la hepatitis B y de la hepatitis C (grupo SN), 48 eran positivos para infección por el virus de la hepatitis B (grupo VHB) y 66 eran positivos para el virus de la hepatitis C (grupo VHC). Además de analizar la histopatología de las muestras arteriales obtenidas, todos estos casos se examinaron para determinar el índice de masa corporal (IMC), la concentración sérica de calcio (Ca), el fósforo (P), la fosfatasa alcalina (FA), la albúmina sérica, el ácido úrico (AU), la alanina transaminasa (ALT), la paratohormona (PTH), el factor de crecimiento de fibroblastos 23 (FGF23), la interleucina 6 (IL6) y la 25 hidroxivitamina D (25 (OH)), la concentración de hemoglobina y la ferritina sérica.
ResultadosOchenta y seis (50%) de los casos presentaron CA; 11 del grupo SN (19%), 9 del grupo VHB (18,8%) y los 66 del grupo VHC (100%). En el grupo SN, 4 presentaron calcificación de la íntima, 5 calcificación de la media y 2 calcificación tanto de la íntima como de la media. En el grupo de VHB, 9 presentaron calcificación de la íntima, mientras que no se hallaron casos de calcificación de la media ni de calcificación de ambas capas. En el grupo de VHC, 16 presentaron calcificación de la íntima, 31 calcificación de la media y 19 calcificación tanto de la íntima como de la media. La calcificación se presentó en forma de puntos en un caso del grupo SN y en 6 casos del grupo VHB; en forma de una sola placa de calcificación en 5 casos del grupo SN, 3 casos del grupo VHB y 16 casos del grupo VHC; en forma de múltiples placas en 4 casos del grupo SN y 31 casos del grupo VHC; y en forma de calcificación difusa en un caso del grupo SN y 19 casos del grupo VHC.
En el grupo VHB, solo se detectó calcificación en pacientes con viremia alta, mientras que todos los pacientes con viremia baja o moderada no presentaron calcificación. En el grupo VHC, todos los pacientes con viremia baja presentaron una sola placa de calcificación en la íntima, todos los pacientes con viremia moderada presentaron múltiples placas de calcificación de la media y todos los pacientes con viremia alta presentaron calcificación difusa de la íntima y la media. Ambos grupos de hepatitis vírica fueron significativamente diferentes en comparación con el grupo SN tanto en la distribución como en la puntuación de calcificación (p<0,001 en todos).
El grupo VHB presentó concentraciones séricas de P, CaxP y PTH, significativamente menores respecto a las del grupo SN (4,6±0,66 frente a 5,45±0,77mg/dl, 36,4±7,2 frente a 44,1±8,69 y 348±65,4 frente a 405,9±83,2pg/ml; p<0,001, p<0,001 y p<0,035, respectivamente). Por el contrario, el grupo VHC no mostró ninguna diferencia significativa en ninguno de los parámetros estudiados respecto al grupo SN.
ConclusiónLos pacientes positivos para el VHC tienen más tendencia a desarrollar CA más extensa. Los pacientes positivos para el VHB presentaron menor probabilidad de presentar calcificación de la media arterial, probablemente relacionada con concentraciones séricas menores de fósforo, producto de CaxP y PTH. La infección por VHC debe añadirse como factor de riesgo para la CA en los pacientes con ERC. Se precisan más estudios para confirmar estos resultados.
AC is one of the predictors of increased cardiovascular mortality among CKD patients.1 AC affects almost all arteries within the body of CKD patients.2,3 In these patients, AC develops within the tunica intima on top of atherosclerotic disease or in the tunica media induced by local inflammation, elastin degradation, vascular smooth muscle cell degeneration, or phenotypic switch within smooth muscle cells.4,5 Beside the variations in anatomical location and histologic site within the arterial wall, AC in CKD patients also varies in its pattern of presentation. Micro calcification or spotty calcification usually complicates atherosclerotic plaques. This type of calcification is usually difficult to diagnose using regular radiologic techniques. AC might present as solitary plaque of calcification within the intimal or the medial layers, as multiple plaques or diffuse calcification that usually involve the medial layer.5–9 While spotty calcification negatively affects atheromatous plaque stability,9 plaque and diffuse calcification increase arterial wall stiffness.7 The underlying risk factors of accelerated AC in CKD patients are divided into classic and non-classic factors.10
Hepatitis B and C viral infections are frequently encountered among pre-dialysis CKD patients.11,12 The association between viral hepatitis and AC among incident hemodialysis CKD patients was not previously looked for.
Aim of workThe aim of this study is to estimate the prevalence, severity and distribution of arterial wall calcification in incident hemodialysis patients undergoing radio-cephalic vascular access surgery for hemodialysis in a trial to look for the impact of hepatitis B and C viral infection on these parameters.
Patients and methodsThe patients recruited in this study were candidates for creation of radio-cephalic fistula as a vascular access for hemodialysis. All sero-negative patients underwent this procedure in Cairo University hospitals, while most of the hepatitis positive patients underwent this procedure in 2 fever hospitals within the Cairo city capital, namely, Abbasia and Imbaba fever hospitals. 172 stage 5 CKD adults (98 male and 74 female) were included; 58 of them were sero-negative for both hepatitis B and C (SN group), 48 were positive for hepatitis B virus infection (HBV group) and 66 were hepatitis C virus positive (HCV group). Polymease chain reaction (PCR) was done for HBV DNA polymerase to confirm active infection in HBV group. According to the magnitude of viremia, HBV patients were subdivided into low (16–103copies/mL), moderate (>103–105copies/ml), and high viremia (>105copies/ml). Similarly, PCR for HCV RNA was done for HCV group and were subdivided into low (16–103copies/ml), moderate (>103–106copies/ml), and high viremia (>106copies/ml).
An arterial tissue biopsy including all layers of the artery wall was selected carefully during the creation of the radio-cephalic fistula and thoroughly excised from both arterial walls dedicated for the anastomosis with an approximate length equal to the planned anastomotic suture line and a width of 1mm. The arterial biopsy specimens were formalin-fixed, processed in alcohol, cleared in xylene and incubated in paraffin blocks. Four sets of slides were prepared from serial cuts (5μ thick); stained with hematoxylin/eosin, Masson's trichrome, Alizarin red and Verhoeff-van Gieson stains. All stained slides were examined under light microscope to evaluate the presence of arterial wall calcification, the site of calcification if restricted to intimal, medial or both layers and the extent of the deposits in the arterial wall if discrete intimal spots of calcification, single segment of calcification involving one 10× field, more than one 10× field of calcification, or diffuse arterial wall calcification.
In addition, BMI, serum Ca, P, AP, serum albumin, UA, ALT, intact PTH, intact FGF23, IL6, and 25 (OH) vit D, hemoglobin concentration, and serum ferritin were estimated in all cases. Blood samples were collected after 6h fasting and then centrifuged to separate plasma that was either immediately assayed or stored below −70°C. Serum level of Intact PTH was determined by enzyme-amplified sensitivity immunoassay (Roche Diagnostics, IN, USA). Intact FGF23 was measured by using a two-site (NH2-terminal/C-terminal) enzyme-linked immunosorbent assay (Immutopics, CA, USA). Serum IL6 was measured using ELISA (Bioscience, ESP) immediately after blood collection. Assays were performed according to the manufacturer's guidelines. The sensitivity of the kit was 2pg/ml and inter- and intra-assay assessments of reliability of the kits were conducted. Serum 25 (OH) vit D was assessed using HPLC.
Statistical analysis was done by SPSS computer package. Quantitative variables were summarized using mean±S.D. Comparison between groups was evaluated using Student's t-test. Comparison between more than 2 independent groups was evaluated using ANNOVA test. Chi square was used to look for impact of age, gender and diabetic state on the pattern and distribution of arterial calcification.
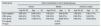
ResultsResults are summarized in Tables 1–9. AC was encountered in 86 of the study cases; 66 of them in HCV group, 9 in HBV group and 11 in SN group. Calcification was more extensive in HCV group; while four of the eleven patients in SN had intimal calcification, 5 cases had medial calcification and only 2 had both intimal and medial calcification, 16 patients in HCV group had intimal calcification, 31 had medial calcification and 19 had calcification in both sites. On the other hand all cases of AC in HBV group had only intimal calcification (P<0.001) (Table 1). In addition, the score of calcification was significantly higher in HCV group; while one case of SN group had calcification spots, 5 cases had single plaque, 4 had multiple plaques and only one case had diffuse calcification, none of the cases of HCV group had calcification spots, 16 had single plaque, 31 had multiple plaques and 19 had diffuse calcification. On the other hand, 6 cases in HBV group had calcification spots and 3 had single plaque of calcification, while non of the cases in this group had either multiple plaques or diffuse calcification (P<0.001 in all) (Table 2).
Site and Pattern of calcification in the 3 studied groups.
| Site of calcification in the 3 studied groups | |||
|---|---|---|---|
| Site of calcification | Intimal | Medial | Intimal & medial |
| Study group | |||
| Sero-negative group | 4/58 (6.9%) | 5/58 (8.6%) | 2/58 (3.45%) |
| HBV group | 9/48 (18.8%) | 0/48 (0%) | 0/48 (0%) |
| HCV group | 16/66 (24.2%) | 31/66 (47%) | 19/66 (28.9%) |
| P value | <0.001 | ||
| Pattern of calcification in the 3 studied groups | ||||
|---|---|---|---|---|
| Pattern of calcification | Spots | Single segment | Multiple segments | Diffuse |
| Study group | ||||
| Sero-negative group | 1/58 (1.7%) | 5/58 (8.6%) | 4/58 (6.9%) | 1/58 (1.7%) |
| HBV group | 6/48 (12.5%) | 3/48 (6.25%) | 0/48 (0%) | 0/48 (0%) |
| HCV group | 0/66 (0%) | 16/66 (24.1%) | 31/66 (47%) | 19/66 (28.9%) |
| P value | <0.001 | |||
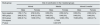
Site of calcification and calcification score in seronegative versus hepatitis B & C positive patients according to severity of viremia.
| HBV viremia | |||||
|---|---|---|---|---|---|
| None | Low | Moderate | High | P value | |
| Site of calcification | |||||
| Mean±SD | 1.25±1.14 | 0±0 | 0±0 | 1±0 | <0.001 |
| Median(iqr) | 1(0–2) | 0(0–0) | 0(0–0) | 1(1–1) | |
| Calcification score | |||||
| Mean±SD | 1.84±1.56 | 0±0 | 0±0 | 1.33±0.5 | <0.001 |
| Median(iqr) | 2(0–3) | 4(0–0) | 0(0–0) | 1(1–2) | |
| HCV viremia | |||||
|---|---|---|---|---|---|
| None | Low | Moderate | High | P value | |
| Site of calcification | |||||
| Mean±SD | 0.27±0.64 | 1±0 | 2±0 | 3±0 | <0.001 |
| Median(iqr) | 0(0–0) | 1(1–1) | 2(2–2) | 3(3–3) | |
| Calcification score | |||||
| Mean±SD | 1.18±0.53 | 2±0 | 3±0 | 4±0 | <0.001 |
| Median(iqr) | 1(1–1) | 2(2–2) | 3(3–3) | 4(4–4) | |
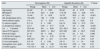
Demographic and laboratory parameters in seronegative versus hepatitis B positive patients.
| Item | Seronegative (58) | Hepatitis B positive (48) | P value | ||
|---|---|---|---|---|---|
| Range | Mean±S.D. | Range | Mean±S.D. | ||
| Age (years) | 24–62 | 41±9.63 | 25–62 | 42±9.79 | 0.52 |
| BMI (kg/m2) | 17.5–30 | 22.9±3.28 | 17.5–30 | 22.6±3.26 | 0.91 |
| ALT (IU/L) | 15–94 | 37±25.6 | 15–78 | 26.5±9.9 | <0.001 |
| Alk. phosphatase (IU/L) | 134–200 | 160±17.02 | 124–200 | 161±14.6 | 0.81 |
| Serum albumin (g/dL) | 3–4.1 | 3.7±0.23 | 3–4.1 | 3.6±0.26 | 0.3 |
| S. calcium (mg/dL) | 6.7–10 | 8±0.85 | 6.2–10 | 8.05±0.73 | 0.81 |
| S. phosphorus (mg/dL) | 3.5–7 | 5.45±0.77 | 3–5.8 | 4.6±0.66 | <0.001 |
| Ca×P product | 25.2–64 | 44.1±8.69 | 23.1–56.3 | 36.4±7.2 | <0.001 |
| Serum PTH (pg/mL) | 307–613 | 405.9±83.2 | 307–536 | 348±65.4 | 0.035 |
| Serum IL6 (ng/L) | 21–41 | 25±5.58 | 21–41 | 24±4.6 | 0.082 |
| S. 25 OH vit D (ng/mL) | 8–32 | 15.4±5.76 | 8.7–32 | 17.7±6.07 | 0.24 |
| S.FGF23 (ng/mL) | 209–312 | 257±24.1 | 211–310 | 261±24.5 | 0.27 |
| S. Uric acid (mg/dL) | 2.5–14 | 5±2.44 | 2.5–11 | 5.1±1.6 | 0.58 |
| Hemoglobin conc. (g/dL) | 6.5–14.3 | 9.55±1.86 | 5.9–15.6 | 9.55±1.95 | 0.21 |
| S. ferritin (ng/mL) | 113–191.1 | 162±21.71 | 113–195 | 167±18.7 | 0.19 |
BMI, body mass index; ALT, serum alanine transaminase; PTH, parathyroid hormone; IL6, interleukin 6; 25 OH vit D, 25 hydroxy vitamin D; FGF23, fibroblast growth factor 23.
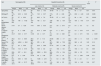
Demographic and laboratory parameters in seronegative versus hepatitis B positive patients according to severity of viremia.
| Item | Seronegative (58) | Hepatitis B positive (48) | F value | P | ||||||
|---|---|---|---|---|---|---|---|---|---|---|
| Low viremia (14) | Moderate viremia (25) | Severe viremia (9) | ||||||||
| Range | Mean±S.D. | Range | Mean±S.D. | Range | Mean±S.D. | Range | Mean±S.D. | |||
| Age (years) | 24–62 | 41±9.63 | 25–62 | 40.5±14.6 | 30–55 | 41±7.3 | 41–55 | 45±5.7 | 0.81 | 0.49 |
| BMI (kg/m2) | 17.5–30 | 22.9±3.28 | 17.5–27 | 19.5±3.37 | 17.5–28 | 23±2.24 | 18.5–30 | 22.6±4.43 | 2.49 | 0.065 |
| ALT (IU/L) | 15–94 | 37±25.6 | 15–37 | 26.5±7.6 | 18–78 | 27±11.97 | 17–36 | 26±6.6 | 5.5 | 0.0012 |
| Alk. phosphatase (IU/L) | 134–200 | 160±17.02 | 144–194 | 163±12.7 | 138–200 | 160±15.4 | 124–170 | 158±14.6 | 0.77 | 0.51 |
| Serum albumin (g/dL) | 3–4.1 | 3.7±0.23 | 3–4.1 | 3.65±0.33 | 3.2–3.9 | 3.6±0.19 | 3.2–4 | 3.4±0.3 | 1.2 | 0.3 |
| S. calcium (mg/dL) | 6.7–10 | 8±0.85 | 7.2–9.7 | 8.15±0.64 | 6.9–10 | 8±0.77 | 6.2–8.5 | 7.9±0.73 | 0.77 | 0.51 |
| S. phosphorus (mg/dL) | 3.5–7 | 5.45±0.77 | 3–5.8 | 4.6±0.71 | 3.4–5.4 | 4.8±0.63 | 3–5.5 | 4.3±0.71 | 10.6 | <0.001 |
| Ca×P product | 25.2–64 | 44.1±8.69 | 26.4–56.3 | 37±7.13 | 24.48–54 | 38.5±7.7 | 23.1–43.5 | 35.7±6 | 6.34 | <0.001 |
| Serum PTH (pg/mL) | 307–613 | 405.9±83.2 | 307–466 | 378±62 | 307–536 | 383±73.5 | 307–439 | 360±42 | 1.63 | 0.19 |
| Serum IL6 (ng/L) | 21–41 | 25±5.58 | 21–33 | 23.9±2.88 | 21–41 | 23.7±5.44 | 21–33 | 24±4.4 | 1.15 | 0.33 |
| S. 25 OH vit D (ng/mL) | 8–32 | 15.4±5.76 | 10.6–23 | 18.8±4.8 | 8.7–32 | 16.8±6.5 | 8.7–26.8 | 16.8±7.2 | 0.5 | 0.68 |
| S.FGF23 (ng/mL) | 209–312 | 257±24.1 | 225–310 | 258.5±25.5 | 220–298 | 274±19.4 | 211–274 | 226±20 | 5.3 | 0.002 |
| S. Uric acid (mg/dL) | 2.5–14 | 5±2.44 | 2.5–8 | 4.8±1.38 | 3.5–11 | 5.9±1.6 | 2.5–8.2 | 5.1±2.08 | 0.46 | 0.71 |
| Hemoglobin conc. (g/dL) | 6.5–14.3 | 9.55±1.86 | 8–15.6 | 10.65±2.19 | 7.3–15 | 9.3±1.58 | 5.9–14.3 | 10±2.4 | 1.7 | 0.17 |
| S. ferritin (ng/mL) | 113–191.1 | 162±21.71 | 141–184.5 | 172.5±13.6 | 113–195 | 162±22 | 127–176 | 169±14.8 | 1.04 | 0.37 |
BMI, body mass index; ALT, serum alanine transaminase; PTH, parathyroid hormone; IL6, interleukin 6; 25 OH vit D, 25 hydroxy vitamin D; FGF23, fibroblast growth factor 23.
demographic and laboratory parameters in seronegative versus hepatitis C positive patients.
| Item | Seronegative (58) | Hepatitis C positive (66) | P value | ||
|---|---|---|---|---|---|
| Range | Mean±S.D. | Range | Mean±S.D. | ||
| Age (years) | 24–62 | 41±9.63 | 24–62 | 41±9.48 | 0.88 |
| BMI (kg/m2) | 17.5–30 | 22.9±3.28 | 17.5–28 | 22±2.53 | 0.086 |
| ALT (IU/L) | 15–94 | 37±25.6 | 15–96 | 33.5±25.6 | 0.8 |
| Alk. Phosphatase (IU/L) | 134–200 | 160±17.02 | 134–186 | 162±11.25 | 0.98 |
| Serum albumin (g/dL) | 3–4.1 | 3.7±0.23 | 3–4.1 | 3.6±0.25 | 0.26 |
| S. calcium (mg/dL) | 6.7–10 | 8±0.85 | 6.7–9.3 | 8.1±0.56 | 0.98 |
| S. phosphorus (mg/dL) | 3.5–7 | 5.45±0.77 | 3.4–7.5 | 5.3±0.95 | 0.65 |
| Ca×P product | 25.2–64 | 44.1±8.69 | 25.5–63.8 | 42.9±8.8 | 0.68 |
| Serum PTH (pg/mL) | 307–613 | 405.9±83.2 | 307–613 | 397±89.8 | 0.88 |
| Serum IL6 (ng/L) | 21–41 | 25±5.58 | 21–41 | 25±5.66 | 0.89 |
| S. 25 OH vit D (ng/mL) | 8–32 | 15.4±5.76 | 8.7–32 | 16.8±5.94 | 0.69 |
| S. FGF23 (ng/mL) | 209–312 | 257±24.1 | 205–316 | 256.5±24.3 | 0.63 |
| S. Uric acid (mg/dL) | 2.5–14 | 5±2.44 | 2.5–11 | 5.8±1.67 | 0.91 |
| Hemoglobin conc. (g/dL) | 6.5–14.3 | 9.55±1.86 | 5.7–12.8 | 9±1.6 | 0.34 |
| S. ferritin (ng/mL) | 113–191.1 | 162±21.71 | 113–191 | 163.5±19.5 | 0.5 |
BMI, body mass index; ALT, serum alanine transaminase; PTH, parathyroid hormone; IL6, interleukin 6; 25 OH vit D, 25 hydroxy vitamin D; FGF23, fibroblast growth factor 23.
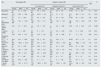
demographic and laboratory parameters in seronegative versus hepatitis C positive patients according to severity of viremia.
| Item | Seronegative (58) | Hepatitis C positive (66) | F value | P | ||||||
|---|---|---|---|---|---|---|---|---|---|---|
| Low viremia (16) | Moderate viremia (31) | Severe viremia (19) | ||||||||
| Range | Mean±S.D. | Range | Mean±S.D. | Range | Mean±S.D. | Range | Mean±S.D. | |||
| Age (years) | 24–62 | 41±9.63 | 33–62 | 45±8.55 | 24–55 | 38±9.9 | 27–62 | 41±8.9 | 1.4 | 0.24 |
| BMI (kg/m2) | 17.5–30 | 22.9±3.28 | 18.9–28 | 22.75±2.6 | 17.5–26 | 21±2.2 | 17.5–26 | 22.6±2.4 | 3.8 | 0.012 |
| ALT (IU/L) | 15–94 | 37±25.6 | 18–62 | 25±15.9 | 15–92 | 34±25.7 | 15–96 | 34±30.2 | 1.34 | 0.26 |
| Alk. phosphatase (IU/L) | 134–200 | 160±17.02 | 134–170 | 160±10.1 | 146–184 | 164±10.6 | 140–186 | 160±12.6 | 0.78 | 0.50 |
| Serum albumin (g/dL) | 3–4.1 | 3.7±0.23 | 3.3–4.1 | 3.6±0.21 | 3–4.1 | 3.6±0.26 | 3–3.9 | 3.6±0.24 | 2.15 | 0.098 |
| S. calcium (mg/dL) | 6.7–10 | 8±0.85 | 6.7–8.5 | 8±0.5 | 7.3–9.2 | 8.2±0.53 | 7–9.3 | 8±0.63 | 0.78 | 0.50 |
| S. phosphorus (mg/dL) | 3.5–7 | 5.45±0.77 | 3.4–5.9 | 4.75±0.8 | 3.6–7.5 | 5.3±0.99 | 4–7 | 6±0.8 | 3.88 | 0.011 |
| Ca×P product | 25.2–64 | 44.1±8.69 | 25.5–49.3 | 38±7.87 | 27–63.8 | 42.3±9 | 28–58 | 47.3±7.4 | 3.1 | 0.03 |
| Serum PTH (pg/mL) | 307–613 | 405.9±83.2 | 307–577 | 473±82.1 | 307–613 | 341.5±98.1 | 307–591 | 369.2±72.7 | 1.78 | 0.15 |
| Serum IL6 (ng/L) | 21–41 | 25±5.58 | 22.6–41 | 23.6±6.3 | 21–41 | 24±4.97 | 21–39 | 27±5.85 | 1.43 | 0.24 |
| S. 25 OH vit D (ng/mL) | 8–32 | 15.4±5.76 | 8.7–26.8 | 16.5±5.8 | 8.7–26.8 | 15.4±5.9 | 9–32 | 17.5±6.27 | 0.27 | 0.85 |
| S.FGF23 (ng/mL) | 209–312 | 257±24.1 | 220–293 | 241±22.8 | 205–316 | 257±25 | 219–294 | 268±23.2 | 1.37 | 0.25 |
| S. Uric acid (mg/dL) | 2.5–14 | 5±2.44 | 2.5–10 | 5.5±2.07 | 3.5–11 | 6±1.5 | 2.5–8.2 | 5±1.5 | 0.4 | 0.75 |
| Hemoglobin conc. (g/dL) | 6.5–14.3 | 9.55±1.86 | 5.7–11.1 | 9±1.7 | 6–12.5 | 9±1.65 | 7.4–12.8 | 9.5±1.4 | 1.43 | 0.23 |
| S. ferritin (ng/mL) | 113–191.1 | 162±21.71 | 113–191 | 162.8±22.7 | 113–191 | 163.5±18.8 | 114.5–183 | 169±18.5 | 0.26 | 0.85 |
BMI, body mass index; ALT, serum alanine transaminase; PTH, parathyroid hormone; IL6, interleukin 6; 25 OH vit D, 25 hydroxy vitamin D; FGF23, fibroblast growth factor 23.
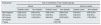
Impact of diabetes on site and pattern of calcification.
| Study group | Site of calcification in the 3 studied groups | |||||
|---|---|---|---|---|---|---|
| Intimal | Medial | Intimal & medial | ||||
| Diabetic cases | Non-diabetic | Diabetic cases | Non-diabetic | Diabetic cases | Non-diabetic | |
| Sero-negative | 2/58 (3.4%) | 2/58 (3.4%) | 2/58 (3.4%) | 3/58 (5.2%) | 0/58 (0%) | 2/58 (3.4%) |
| HBV group | 2/48 (4.2%) | 7/48 (14.6%) | 0/48 (0%) | 0/48 (0%) | 0/48 (0%) | 0/48 (0%) |
| HCV group | 3/66 (4.5%) | 13/66 (20%) | 6/66 (9%) | 25/66 (38%) | 3/66 (5%) | 17/66 (26%) |
| Chi-square | 0.0062 | |||||
| P value | 0.937458 | |||||
| Study group | Pattern of calcification in the 3 studied groups | |||||||
|---|---|---|---|---|---|---|---|---|
| Spots | Single segment | Multiple segments | Diffuse | |||||
| Diabetic cases | Non-diabetic | Diabetic cases | Non-diabetic | Diabetic cases | Non-diabetic | Diabetic cases | Non-diabetic | |
| Sero-negative | 0/58 (0%) | 1/58 (1.7%) | 2/58 (3.4%) | 3/58 (5.2%) | 2/58 (3.4%) | 2/58 (3.4%) | 0/58 (0%) | 1/58 (1.7%) |
| HBV group | 2/48 (4.2%) | 4/48 (8.4%) | 0/48 (0%) | 3/48 (6.3%) | 0/48 (0%) | 0/48 (0%) | 0/48 (0%) | 0/48 (0%) |
| HCV group | 0/66 (0%) | 0/66 (0%) | 3/66 (4.5%) | 13/66 (19.7%) | 6/66 (9.1%) | 25/66 (37.9%) | 3/66 (4.5%) | 17/66 (25.8%) |
| Chi-square | 0.0062 | |||||||
| P value | 0.937458 | |||||||
Impact of Age on site and pattern of calcification.
| Study group | Site of calcification in the 3 studied groups | |||||
|---|---|---|---|---|---|---|
| Intimal | Medial | Intimal & medial | ||||
| Age 52–62 | Age<52 | Age 52–62 | Age<52 | Age 52–62 | Age<52 | |
| Sero-negative | 2/58 (3%) | 2/58 (3.4%) | 1/58 (2%) | 4/58 (6.9%) | 1/58 (0%) | 1/58 (1.7%) |
| HBV group | 2/48 (4%) | 7/48 (15%) | 0/48 (0%) | 0/48 (0%) | 0/48 (0%) | 0/48 (0%) |
| HCV group | 2/66 (3%) | 14/66 (21%) | 3/66 (5%) | 28/66 (42%) | 3/66 (5%) | 16/66 (24%) |
| Chi-square | 0.1812 | |||||
| P value | 0.6703 | |||||
| Study group | Pattern of calcification in the 3 studied groups | |||||||
|---|---|---|---|---|---|---|---|---|
| Spots | Single segment | Multiple segments | Diffuse | |||||
| Age 52–62 | Age<52 | Age 52–62 | Age<52 | Age 52–62 | Age<52 | Age 52–62 | Age<52 | |
| Sero-negative | 1/58 (1.7%) | 0/58 (0%) | 1/58 (1.7%) | 4/58 (6.8%) | 2/58 (3.4%) | 2/58 (3.4%) | 0/58 (0%) | 1/58 (1.7%) |
| HBV group | 1/48 (2.1%) | 5/48 (10.4%) | 1/48 (2.1%) | 2/48 (4.2%) | 0/48 (0%) | 0/48 (0%) | 0/48 (0%) | 0/48 (0%) |
| HCV group | 0/66 (0%) | 0/66 (0%) | 2/66 (3%) | 14/66 (21.2%) | 3/66 (4.5%) | 28/66 (42.4%) | 3/66 (4.5%) | 16/66 (24.2%) |
| Chi-square | 0.1812 | |||||||
| P value | 0.670307 | |||||||
Impact of Gender on site and pattern of calcification.
| Study group | Site of calcification in the 3 studied groups | |||||
|---|---|---|---|---|---|---|
| Intimal | Medial | Intimal & medial | ||||
| Male | Female | Male | Female | Male | Female | |
| Sero-negative | 1/58 (1.7%) | 2/58 (3.4%) | 0/58 (0%) | 2/58 (3.4%) | 0/58 (0%) | 2/58 (3.4%) |
| HBV group | 3/48 (6.3%) | 6/48 (12.5%) | 0/48 (0%) | 0/48 (0%) | 0/48 (0%) | 0/48 (0%) |
| HCV group | 6/66 (9.1%) | 10/66 (15%) | 19/66 (29%) | 12/66 (18%) | 15/66 (23%) | 4/66 (6.1%) |
| Chi-square | 0.7039 | |||||
| P value | 0.401479 | |||||
| Study group | Pattern of calcification in the 3 studied groups | |||||||
|---|---|---|---|---|---|---|---|---|
| Spots | Single segment | Multiple segments | Diffuse | |||||
| Male | Female | Male | Female | Male | Female | Male | Female | |
| Sero-negative | 1/58 (1.7%) | 0/58 (0%) | 0/58 (0%) | 3/58 (5.2%) | 0/58 (0%) | 3/58 (5.2%) | 0/58 (0%) | 0/58 (0%) |
| HBV group | 2/48 (4.2%) | 4/48 (8.3%) | 1/48 (2.1%) | 2/48 (4.2%) | 0/48 (0%) | 0/48 (0%) | 0/48 (0%) | 0/48 (0%) |
| HCV group | 0/66 (0%) | 0/66 (0%) | 6/66 (9.1%) | 10/66 (15.2%) | 19/66 (28.8%) | 12/66 (18.2%) | 15/66 (22.7%) | 4/66 (6.1%) |
| Chi-square | 0.7039 | |||||||
| P value | 0.401479 | |||||||
In HBV group, calcification was only encountered in patients with high viremia, while all patients in HCV group had calcification. The level of viremia had an influence on the site and pattern of calcification in HCV group. While all low viremia cases showed intimal solitary plaque of calcification, all cases with moderate viremia had multiple plaques of medial calcification, all patients suffering high viremia had diffuse calcification involving both intimal and medial layers (P<0.001 in all) (Table 2).
Table 3 shows statistical analysis of the different clinical and biochemical parameters studied in HBV group in comparison to SN group. HBV group had significantly higher serum ALT and lower serum P, CaxP product and PTH in comparison to SN group. On comparison of SN group to HBV subgroups with different grades of viremia, significant differences were encountered. In addition there was significant difference in serum FGF23 likely due to lower level in patients with high viremia (Table 4).
There is no significant difference between the SN and HCV group in any of the studied clinical and laboratory parameters (Table 5). On the other hand, there was significant difference in BMI, serum P and serum Ca x P product between SN group and HCV subgroups with different grades of viremia (Table 6).
Diabetic status, patient age or gender did not have any significant impact on the incidence, pattern or distribution in the different studied groups (Tables 7–9).
DiscussionIn our previous study of the prevalence of hepatitis virus infection among incident hemodialysis patients, HCV antibody was encountered in 22.9% 0f patients and HBsAg was detected in 1.4% of patients.13 Although arterial calcification was thoroughly studied in incident hemodialysis patients,2,14–16 its association with hepatitis infection was not analyzed. The only study of arterial calcification in HCV infected CKD patient has looked for aortic arch calcification among prevalent hemodialysis patients.17 On the other hand, the association of HBV infection with vascular calcification among CKD patients was not studied before.
In the current study, we used arterial samples obtained during the creation of radio-cephalic fistula before starting hemodialysis treatment. Although the histo-pathologic examination can detect tiny calcification spots not readily detected by radiologic techniques, this examination is limited to the site of sampling contrary to radiologic examination. However, histo-pathologic examination did facilitate the proper judgment of the site and pattern of arterial calcification.
The findings obtained in the current study were striking. First, they confirmed the increased tendency of HCV patients to develop calcification. Second, the HCV group did develop AC whatever the magnitude of viremia. Third, contrary to SN and HBV groups, HCV patients do not develop calcification spots; all HCV patient had either segmental or diffuse calcification. Fourth, the higher the level of viremia the more is the calcification score; while patients with low viremia had solitary calcification plaque, patients with moderate viremia showed multiple calcification plaques and high viremia patients had diffuse calcification. If these findings would be confirmed by future studies, they should stimulate for early detection and treatment of HCV infection among CKD patients.
On the contrary, HBV infection seems to suppress the development of medial calcification. This finding needs verification in future studies. All patients that had calcification in this group were in the high viremia subgroup. All these patients had intimal calcification that was in the form of microcalcification in two-thirds of the affected cases while the remaining one third had solitary calcification plaque. Although there was a significant difference in serum P and Ca×P product in between the SN and HBV subgroups, these parameters were lower in the high viremia group that developed intimal calcifications. A similar finding is observed among low viremia HCV subgroup. Disturbance in mineral metabolism cannot thus explain the increased tendency and severity of calcification among the HCV group nor the intimal calcification among the high viremia HBV subgroup. This can be also applied to age, gender, diabetic state, serum PTH, 25 (OH) vit. D, FGF23 and IL6.
According to this study, HCV infection should be added as one of the non-traditional risk factors of AC in CKD patients. However, many inquiries have been created and need further intensive work to find the proper answers.
FundsThis study did not receive funds.
Conflict of interestThe authors have declared that no conflict of interest exists.
Professor Usama suggested this study, he also revised the manuscript. Prof. Mona Salem has put the study design, Dr. Ahmed Fayed, collected the biopsy and blood samples and shared in statistical analysis, Dr. Hossam El Mahdy is the vascular surgeon that offered the arterial samples. Dr. Wael Hamza is the pathologist that examined the arterial samples. Dr. Dina, and Dr. Ahmed Soliman collected the references and wrote the manuscript.