


Protein-bound uremic toxins (PBUTs) have a high affinity for albumin and they are associated with increased cardiovascular morbidity and mortality in hemodialysis patients. Among them, p-cresyl sulfate (pCS) and indoxyl sulfate (IS) stand out due to their high toxicity. Postdilution hemodiafiltration (HDF) is one of the dialysis techniques that has shown the greatest benefits in terms of patient survival.
Materials and methodsThis observational, single-center, cross-sectional study evaluated PBUT clearance in 137 patients undergoing post-dilution HDF, analyzing the factors that influence their removal. Reduction ratios (RRs) of IS and pCS were measured, as well as their correlation with dialysis parameters and clinical variables.
ResultsThe mean RR for IS was 53.4% ± 9.3%, and for pCS, 48.2% ± 11.3%. A significant correlation was observed between the RR of both toxins (r = 0.606; P < .01), suggesting similar elimination mechanisms. In addition, total convective volume showed a positive correlation with the RR of pCS (r = 0.19; P = .027) and a weak correlation with the RR of IS (r = 0.155; P = .07). A significant difference in clearance was found according to sex, with higher RRs in women (P < .001 for IS and P = .008 for pCS).
ConclusionsThe clearance of PBUTs is primarily diffusive. Enhancing all variables related to this physical principle will improve the elimination of these toxins. Postdilution HDF with high convective volume slightly increases this clearance. However, the results remain insufficient given the high toxicity of these molecules. New strategies, such as the use of adsorptive membranes and competitive molecules, are needed to optimize their removal and reduce the negative cardiovascular impact in hemodialysis patients.
Las toxinas urémicas unidas a proteínas (PBUT) presentan una elevada afinidad por la albúmina y se relacionan con un incremento en la morbilidad y mortalidad cardiovascular en pacientes en hemodiálisis. Entre ellas, el p-cresil sulfato (pCS) y el indoxil sulfato (IS) destacan por su elevada toxicidad. La hemodiafiltración postdilucional (HDF) es una de la técnica de hemodiálisis que mayores beneficios ha demostrado en la supervivencia de los pacientes en hemodiálisis.
Material y métodosEste estudio observacional, unicéntrico y transversal evaluó la depuración de PBUT en 137 pacientes en HDF postdilucional, analizando los factores que influyen en su eliminación. Se midieron los porcentajes de reducción (PR) de IS y pCS, así como su correlación con parámetros de diálisis y variables clínicas.
ResultadosLos resultados mostraron que el PR medio de IS fue del 53,4% ± 9,3% y el de pCS del 48,2% ± 11,3%. Se observó una correlación significativa entre el PR de ambas toxinas (r = 0,606; P < ,01), sugiriendo mecanismos de eliminación similares. Además, el volumen convectivo total mostró una correlación positiva con el PR de pCS (r = 0,19; P = ,027) y una correlación débil con el PR de IS (r = 0,155; P = ,07). Se encontró una diferencia significativa en la depuración según el sexo, con mayores PR en mujeres (P < ,001 para IS y P = ,008 para pCS).
ConclusionesLa depuración de PBUT es fundamentalmente difusiva. Incrementar todas las variables relacionadas con este principio físico, aumentará la eliminación de dichas toxinas. La HDF postdilucional con alto volumen convectivo incrementa discretamente esta depuración. No obstante, los resultados siguen siendo insuficientes dada la alta toxicidad de estas moléculas. Se requieren nuevas estrategias, como el uso de membranas adsortivas y moléculas competidoras, para optimizar su depuración y reducir el impacto negativo en la salud cardiovascular de los pacientes en hemodiálisis.
Uremic toxins are classified according to their physicochemical characteristics and purification capacity according to conventional hemodialysis techniques, following the current classification of the European Uremic Toxins Working Group (EUTox).1 Of these, protein-bound uremic toxins (PBUTs) include various groups of molecules2,3 with high affinity for plasma proteins, mainly albumin.4 These toxins are produced after the hepatic metabolism of precursors formed by the metabolism of dietary proteins of the intestinal microbiota; subsequently, PBUTs are eliminated by the kidneys by tubular secretion.5 PBUTs are associated with increased cardiovascular morbidity and mortality in hemodialysis patients.6–8 Among these compounds, p-cresyl sulfate (pCS) and indoxyl sulfate (IS) are the most studied and have demonstrated the greatest toxicity to the cardiovascular system.3 In fact, pCS has the highest index of uremic toxicity (grade 4), which affects up to 7 organs, whereas has a toxicity grade of 3, with 6 organs affected.9,10
Significant variability in the percentage reduction (PR) of PBUT exists.10 Conventional techniques of hemodialysis using high-flux hemodialysis, postdilution hemodiafiltration (HDF)11 or expanded hemodialysis12 present clearance rates lower than 55% and 50% for IS and pCS, respectively.10 Owing to the small molecular weight of PBUT and its fundamentally diffusive depuration, extended-time techniques are the best available strategy for achieving the greatest degree of depuration.13,14 Currently, other strategies are being developed, such as the use of competing molecules or the development of membranes with adsorptive capacity.15
The objective of this study was to evaluate the clearance of PBUT in our dialysis unit, in postdilution HDF mode, and to evaluate the main factors that influence its clearance.
Materials and methodsThis observational, single-center, cross-sectional study was performed using a cohort of monthly blood tests from the chronic hemodialysis unit. A total of 137 patients were included (47 women, 34%), with a mean age of 70 ± 17 (range: 21–96); these patients had been stable on HDF for a mean duration of 44 ± 54 months (range: 3–315). Adult patients were included in a standard schedule of 3 sessions/week of 4–5 h of duration, or in a nocturnal regimen of 8 h of duration (117 and 20, respectively). Patients with acute or unstable conditions were excluded. The underlying renal diseases included nephroangiosclerosis (16), diabetic nephropathy (17), glomerulonephritis (14), systemic disease (14), unknown (14), tubulointerstitial nephritis (12), urological nephritis (11) and renal polycystosis (3). All patients signed an informed consent form. The study was approved by the local Ethics Committee and was conducted in accordance with the Declaration of Helsinki.
All patients participated in a regular dialysis session in postdilution HDF mode with the following parameters: bicarbonate-buffered dialysate, blood flow (Qb) of 421 ± 30 mL/min, dialysate flow (Qd) of 400 mL/min and a dialysis time (Td) of 304 ± 56 min (range: 240–480). The net ultrafiltration was individually configured according to the clinical needs of the patient. Vascular access was achieved using an arteriovenous fistula in 74 patients, a prosthetic arteriovenous fistula in 7 patients, and a tunneled catheter in 56 patients. Low-molecular-weight heparin (tinzaparin) was used for anticoagulation in 57.6% of the patients, sodium heparin was used in 30.7%, and the remaining 11.7% were dialyzed without anticoagulation. Fresenius 5008 CorDiax or 6008 CARE system dialysis monitors (Fresenius, Bad Homburg, Germany) were used. The following dialyzers were used: 72 FX60 (Fresenius, Bad Homburg, Germany), 39 Clearum (Bellco, Mirandola, Italy), 12 CorAL60 (Fresenius, Bad Homburg, Germany), 12 Solacea (Nipro, Osaka, Japan) and 2 FX50 (Fresenius, Bad Homburg, Germany).
The following dialysis parameters were collected: actual duration, dialyzer, Qb, recirculation index measured by the temperature module, initial and final hematocrit measured automatically using the BVM biosensor, initial and final body weights, total volume of blood processed, and replacement volume.
Blood samples were obtained from each patient for analysis. Laboratory measurements included concentrations of urea (molecular weight [MW] 60) and creatinine (MW 113) in serum at the beginning and at the end of each session to calculate the reduction rate (RR) of these solutes. Uremic toxins bound to proteins, namely, pCS (MW 108) and IS (MW 213), were also evaluated. The final IS and pCS concentration were corrected for the degree of hemoconcentration and the volume of distribution (approximate extracellular volume) according to Bergström and Wehle.16
Urea and creatinine were measured using molecular absorption spectrometry in an Atellica Solution analyzer (Siemens Healthineers, Tarrytown, NY, USA). IS and pCS levels in serum were measured using liquid chromatography‒mass spectrometry (LC‒MS) according to the methodology specified in a previous study.17
The results are expressed as the arithmetic mean ± standard deviation. To analyze the statistical significance of the quantitative parameters, we performed a Student’s t-test for independent data. To identify the factors that predict greater or lesser clearance of PBUT, univariate and multivariate logistic regression models were developed. The Pearson correlation coefficient was calculated to evaluate the linear relationship between IS RR and pCS RR and the different variables that were significant. P values < .05 were considered to indicate statistical significance. The analyses were performed using SPSS version 23 (SPSS, Chicago, IL, USA).
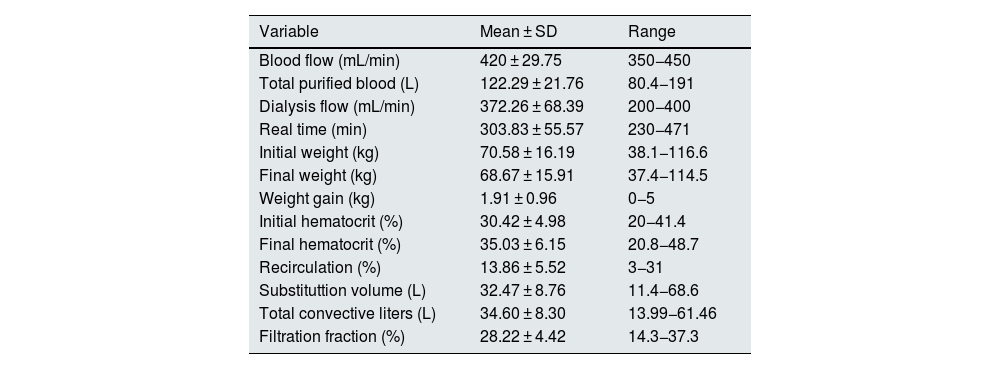
ResultsAll the sessions were performed without noteworthy incidents. The variables related to the dialysis technique are shown in Table 1. Table 1: Qb, total volume of blood processed, actual duration, vascular access recirculation index, initial weight, final weight, weight gain, initial and final hematocrit, replacement volume in HDF, total convective volume (replacement volume plus ultrafiltered volume) and the calculation of the filtration fraction (FF).
Variables related to the dialysis session.
| Variable | Mean ± SD | Range |
|---|---|---|
| Blood flow (mL/min) | 420 ± 29.75 | 350−450 |
| Total purified blood (L) | 122.29 ± 21.76 | 80.4−191 |
| Dialysis flow (mL/min) | 372.26 ± 68.39 | 200−400 |
| Real time (min) | 303.83 ± 55.57 | 230−471 |
| Initial weight (kg) | 70.58 ± 16.19 | 38.1−116.6 |
| Final weight (kg) | 68.67 ± 15.91 | 37.4−114.5 |
| Weight gain (kg) | 1.91 ± 0.96 | 0−5 |
| Initial hematocrit (%) | 30.42 ± 4.98 | 20−41.4 |
| Final hematocrit (%) | 35.03 ± 6.15 | 20.8−48.7 |
| Recirculation (%) | 13.86 ± 5.52 | 3−31 |
| Substituttion volume (L) | 32.47 ± 8.76 | 11.4−68.6 |
| Total convective liters (L) | 34.60 ± 8.30 | 13.99−61.46 |
| Filtration fraction (%) | 28.22 ± 4.42 | 14.3−37.3 |
%, percentage; SD, standard deviation, kg, kilograms; L, liters; min, minutes; mL, milliliters.
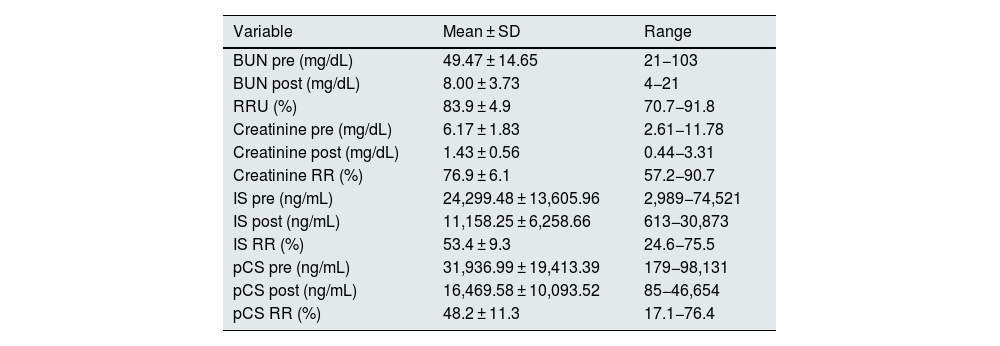
The serum concentrations of uremic toxins (BUN, creatinine, IS and pCS) and the reduction ratios are shown in Table 2. The IS RR was 53.4 ± 9.3% (range: 24–76), and that for pCS was 48.2 ± 11.3% (range: 17–76).
Serum concentrations of uremic toxins.
| Variable | Mean ± SD | Range |
|---|---|---|
| BUN pre (mg/dL) | 49.47 ± 14.65 | 21−103 |
| BUN post (mg/dL) | 8.00 ± 3.73 | 4−21 |
| RRU (%) | 83.9 ± 4.9 | 70.7−91.8 |
| Creatinine pre (mg/dL) | 6.17 ± 1.83 | 2.61−11.78 |
| Creatinine post (mg/dL) | 1.43 ± 0.56 | 0.44−3.31 |
| Creatinine RR (%) | 76.9 ± 6.1 | 57.2−90.7 |
| IS pre (ng/mL) | 24,299.48 ± 13,605.96 | 2,989−74,521 |
| IS post (ng/mL) | 11,158.25 ± 6,258.66 | 613−30,873 |
| IS RR (%) | 53.4 ± 9.3 | 24.6−75.5 |
| pCS pre (ng/mL) | 31,936.99 ± 19,413.39 | 179−98,131 |
| pCS post (ng/mL) | 16,469.58 ± 10,093.52 | 85−46,654 |
| pCS RR (%) | 48.2 ± 11.3 | 17.1−76.4 |
SD, standard deviation; BUN, blood urea nitrogen; pre, predialysis; post, postdialysis; mg, milligrams; dL, deciliters; ng, nanograms; mL, milliliters; RR, reduction ratio; U, urea; IS, indoxyl sulfate; pCS, p-cresyl sulfate. The final pCS and IS concentrations were corrected for the degree of hemoconcentration and the volume of distribution (approximate extracellular volume) according to Bergström and Wehle (16).
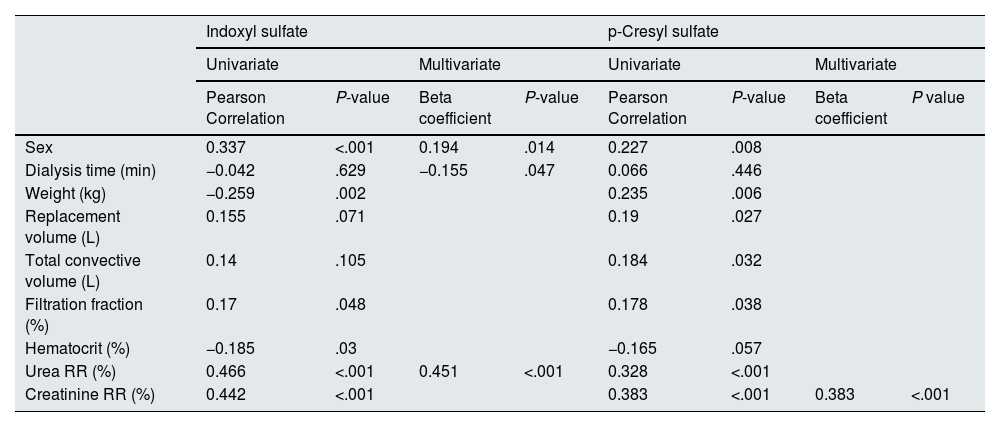
The greatest association was found between the RR of both PBUTs analyzed (r = 0.606; P < .01). This finding shows that both toxins are eliminated by similar mechanisms.
Univariate analysis revealed that for IS, the greatest correlation occurred with the urea and creatinine RR (Fig. 1), followed by sex (Fig. 2), weight, hematocrit (Supplementary Fig. 1 in Appendix B) and the convective volume expressed as FF (Supplementary Fig. 2 in Appendix B); however, the correlation did not reach statistical significance with albumin, dialysis time, replacement volume or total convective volume (Table 3).
, creatinine (C) and p-cresyl sulfate (B and D, respectively). The Pearson coefficients and the corresponding P values are shown.")
 and pCS RR (right) by sex. The P values obtained using the Student’s t-test are shown for each variable.")
Correlation analysis.
| Indoxyl sulfate | p-Cresyl sulfate | |||||||
|---|---|---|---|---|---|---|---|---|
| Univariate | Multivariate | Univariate | Multivariate | |||||
| Pearson Correlation | P-value | Beta coefficient | P-value | Pearson Correlation | P-value | Beta coefficient | P value | |
| Sex | 0.337 | <.001 | 0.194 | .014 | 0.227 | .008 | ||
| Dialysis time (min) | −0.042 | .629 | −0.155 | .047 | 0.066 | .446 | ||
| Weight (kg) | −0.259 | .002 | 0.235 | .006 | ||||
| Replacement volume (L) | 0.155 | .071 | 0.19 | .027 | ||||
| Total convective volume (L) | 0.14 | .105 | 0.184 | .032 | ||||
| Filtration fraction (%) | 0.17 | .048 | 0.178 | .038 | ||||
| Hematocrit (%) | −0.185 | .03 | −0.165 | .057 | ||||
| Urea RR (%) | 0.466 | <.001 | 0.451 | <.001 | 0.328 | <.001 | ||
| Creatinine RR (%) | 0.442 | <.001 | 0.383 | <.001 | 0.383 | <.001 | ||
%, percentage; kg, kilograms; L, liters; Min, minutes; RR, reduction ratio.
Regarding pCS, the highest correlation was also observed with the urea and creatinine RR (Fig. 1), followed by sex (Fig. 2), weight, hematocrit (Supplementary Fig. 1 in Appendix B), substitution volume, total convective volume and FF (Supplementary Fig. 2 in Appendix B); the correlation with albumin or dialysis time did not reach statistical significance (Table 3). Unlike the IS RR, pCS RR shows a statistically significant correlation with the replacement volume and with the total convective volume. It also had a positive correlation with the final weight but not with the final hematocrit.
In the multivariate linear regression analysis, only 3 variables remained as independent predictors of the IS RR: sex, Td and URR (Table 3). Thus, multivariate analysis of the IS RR provides us with the following formula:
where, sex was coded as 0 for men and 1 for women, the Td is expressed in minutes, and the URR is expressed as a percentage. This model presents a multiple correlation coefficient (R) of 0.531, with a coefficient of determination (R2) of 0.282. This indicates that 28.2% of the variability in the IS RR is explained by these 3 variables.On the other hand, with respect to the pCS RR in the multivariate analysis, only its correlation with the creatinine RR remained statistically significant. In this case, unlike the IS RR, the creatinine RR had more statistical value than the URR did.
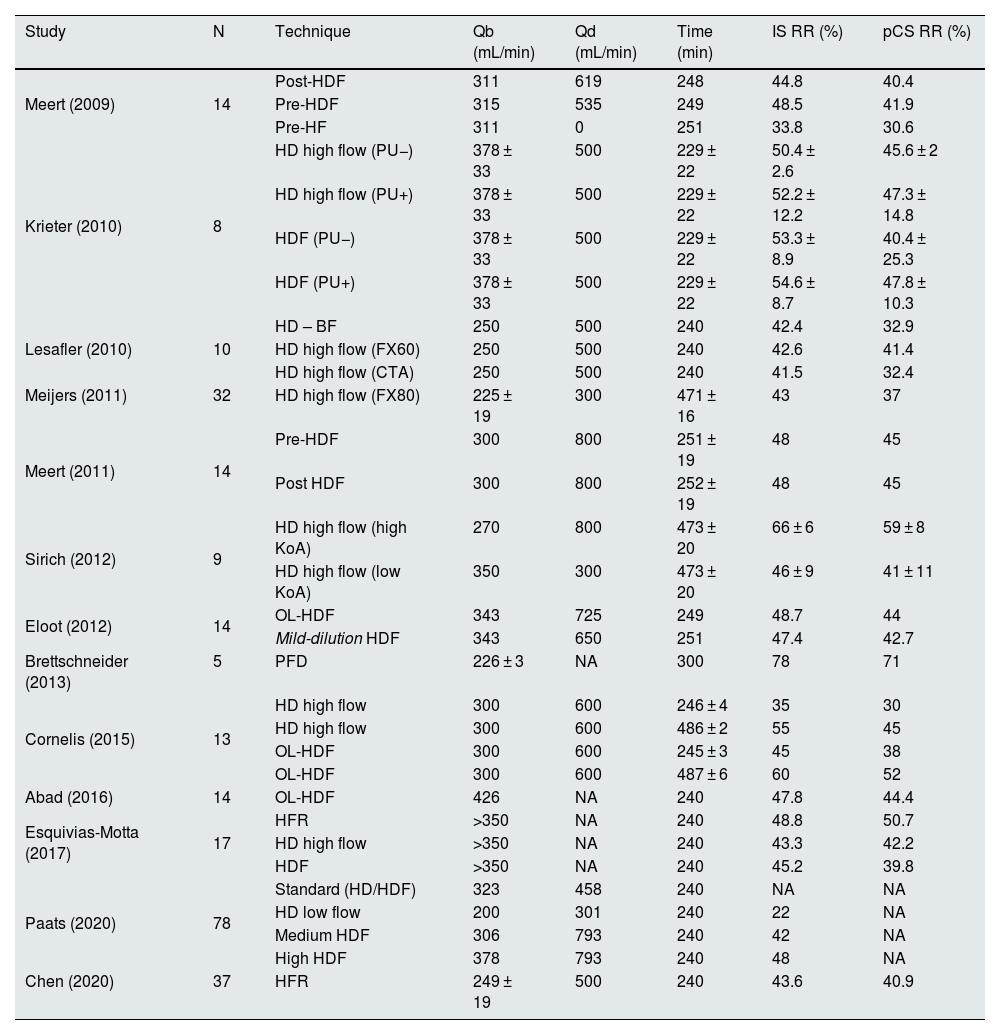
DiscussionThe clearance of uremic toxins bound to proteins by HDF with high convective volumes in our unit is approximately 53% and 48% for IS and pCS, respectively; these results are similar to those published in the literature (Table 4). The association analysis revealed a clearance directly proportional to the clearance of small molecules, indicating the fundamentally diffusive clearance of PBUT.
Percentages of reduction in uremic toxins bound to proteins reported in the main published studies.
| Study | N | Technique | Qb (mL/min) | Qd (mL/min) | Time (min) | IS RR (%) | pCS RR (%) |
|---|---|---|---|---|---|---|---|
| Meert (2009) | 14 | Post-HDF | 311 | 619 | 248 | 44.8 | 40.4 |
| Pre-HDF | 315 | 535 | 249 | 48.5 | 41.9 | ||
| Pre-HF | 311 | 0 | 251 | 33.8 | 30.6 | ||
| Krieter (2010) | 8 | HD high flow (PU−) | 378 ± 33 | 500 | 229 ± 22 | 50.4 ± 2.6 | 45.6 ± 2 |
| HD high flow (PU+) | 378 ± 33 | 500 | 229 ± 22 | 52.2 ± 12.2 | 47.3 ± 14.8 | ||
| HDF (PU−) | 378 ± 33 | 500 | 229 ± 22 | 53.3 ± 8.9 | 40.4 ± 25.3 | ||
| HDF (PU+) | 378 ± 33 | 500 | 229 ± 22 | 54.6 ± 8.7 | 47.8 ± 10.3 | ||
| Lesafler (2010) | 10 | HD – BF | 250 | 500 | 240 | 42.4 | 32.9 |
| HD high flow (FX60) | 250 | 500 | 240 | 42.6 | 41.4 | ||
| HD high flow (CTA) | 250 | 500 | 240 | 41.5 | 32.4 | ||
| Meijers (2011) | 32 | HD high flow (FX80) | 225 ± 19 | 300 | 471 ± 16 | 43 | 37 |
| Meert (2011) | 14 | Pre-HDF | 300 | 800 | 251 ± 19 | 48 | 45 |
| Post HDF | 300 | 800 | 252 ± 19 | 48 | 45 | ||
| Sirich (2012) | 9 | HD high flow (high KoA) | 270 | 800 | 473 ± 20 | 66 ± 6 | 59 ± 8 |
| HD high flow (low KoA) | 350 | 300 | 473 ± 20 | 46 ± 9 | 41 ± 11 | ||
| Eloot (2012) | 14 | OL-HDF | 343 | 725 | 249 | 48.7 | 44 |
| Mild-dilution HDF | 343 | 650 | 251 | 47.4 | 42.7 | ||
| Brettschneider (2013) | 5 | PFD | 226 ± 3 | NA | 300 | 78 | 71 |
| Cornelis (2015) | 13 | HD high flow | 300 | 600 | 246 ± 4 | 35 | 30 |
| HD high flow | 300 | 600 | 486 ± 2 | 55 | 45 | ||
| OL-HDF | 300 | 600 | 245 ± 3 | 45 | 38 | ||
| OL-HDF | 300 | 600 | 487 ± 6 | 60 | 52 | ||
| Abad (2016) | 14 | OL-HDF | 426 | NA | 240 | 47.8 | 44.4 |
| Esquivias-Motta (2017) | 17 | HFR | >350 | NA | 240 | 48.8 | 50.7 |
| HD high flow | >350 | NA | 240 | 43.3 | 42.2 | ||
| HDF | >350 | NA | 240 | 45.2 | 39.8 | ||
| Paats (2020) | 78 | Standard (HD/HDF) | 323 | 458 | 240 | NA | NA |
| HD low flow | 200 | 301 | 240 | 22 | NA | ||
| Medium HDF | 306 | 793 | 240 | 42 | NA | ||
| High HDF | 378 | 793 | 240 | 48 | NA | ||
| Chen (2020) | 37 | HFR | 249 ± 19 | 500 | 240 | 43.6 | 40.9 |
FPAD, fractionated plasma separation and adsorption technique; HD, hemodialysis; OL-HDF, online hemodiafiltration; Pre-HF, predilution hemofiltration; HFR, hemodiafiltration with endogenous reinfusion; IS, indoxyl sulfate; min, minutes; mL, milliliters; n, number; NA, not available; pCS, p-cresyl sulfate; RR, reduction ratio; pre-HDF, predilution hemodiafiltration; post-HDF, postdilutional hemodiafiltration; PU, PUREMA membrane; Qb, blood flow; Qd, dialysis flow; CTA, cellulose triacetate.
These toxins have a high degree of binding to albumin, with up to 95% binding for IS and pCS.18,19 3-Carboxy-4-methyl-5-propyl-2-furan-propanoic acid is the PBUT with the highest documented degree of binding (99%–100%).19 These toxins bind to albumin at the Sudlow I and II binding sites; the Sudlow II site is predominant for IS and pCS.18 This high degree of protein binding limits their clearance with conventional hemodialysis techniques despite being molecules with small molecular sizes.15
Table 4 shows the results of different studies that have analyzed the clearance of PBUT using different hemodialysis techniques. Low-flux hemodialysis reaches a IS RR of 22% with Qb and Qd values of 200 mL/min and 300 mL/min, respectively.20 High-flux hemodialysis reaches RRs of approximately 33%–52% and 27%–47% for IS and pCS, respectively, in a conventional 4-h session13,21–23 (Table 4). Predilution HDF achieves a IS RR of 48% and pCS RR of 41%–45%,24,25 whereas postdilution HDF achieves a similar RR or a RR with discrete increases of 45%–55% and 38%–48% for IS and pCS, respectively.11,13,23,26,27 As time increases (8 h), these techniques achieve RR values of 60% and 52% for IS and pCS, respectively. In addition, postdilution HDF values of 43%–55% and 37%–45% are obtained for IS and pCS, respectively, with high-flux hemodialysis13,28 and up to 66% and 59%, respectively, with high-flux hemodialysis with high-KoA membranes14 because of the constant dissociation and the greater availability of the free fraction of the PBUT.13 The disparity of results in the literature could be explained by the heterogeneity of variables that influence the clearance of small molecules, namely, Qb, Qd and Td, as well as by the small number of patients studied, which limits their external validity (Table 4). Expanded hemodialysis does not achieve higher RRs than previous techniques.12 In this study, the RR values of IS and pCS are 53% and 48%, respectively, for HDF with high convective volume. The results are consistent with published works (Table 4). In our case, the nocturnal cohort did not reach a higher RR than the daytime cohort. This difference may be due to the lower Qd prescribed (200 mL/min) compared with that reported by Cornelis et al.13 and Sirich et al.,14 which had Qd values of 600 mL/min and 800 mL/min, respectively, as well as the difference between the two cohorts in our study (20 vs. 117). More recently, our group evaluated the possible hemoadsorption added value for the clearance of various uremic toxins using various hemodialysis modalities. Among the modalities, HDF achieved the greatest reduction in IS (55%) and pCS (51%) compared with low- or high-flux hemodialysis (a reduction that was approximately 5% lower); however, no differences in the clearance of PBUT were observed when the hemoadsorption cartridge was added in any of the 3 treatment modalities studied.29
The correlation analysis revealed a relationship between the clearance of IS and pCS and the clearance of small-molecular-weight uremic toxins because diffusion is the main mechanism of their elimination10,13 (Fig. 1). In this sense, increasing the variables that increase the diffusive capacity of the hemodialysis technique, such as Qb, Qd, Td, or frequency of therapy, increases the clearance of PBUT in a directly proportional way. In addition, the differences in PBUT clearance between men and women (Fig. 2 and Supplementary Fig. 1 in Appendix B) are inversely proportional to the volume of distribution, since it is generally lower in females.30 Postdilution HDF increases PBUT clearance by the discrete increase it provides in the clearance of small molecules (URR and creatinine RR) rather than by the convective effect,31,32 as previously observed by Abad et al.26 (Supplementary Fig. 2 in Appendix B).
Currently, different strategies are being developed to increase the clearance of PBUT. The use of competing molecules during dialysis sessions seems to be the most common in the clinical setting.33 Specifically, the use of tryptophan, furosemide and ibuprofen has been demonstrated in several in vitro studies,34 the latter of which demonstrated the greatest competitive capacity for IS and pCS.35 The use of salvianolic acids36 and lipid emulsions (Intralipid™, Fresenius KABI SSPC, Jiangsu, China) have also been studied in murine models37; however, no data from humans or on its possible safety have been reported to date.38 The only competitor used clinically in patients was ibuprofen,39 and clearance increased from 6 to 20.2 mL/min and from 4.4 to 14.9 for IS and pCS, respectively. Our group showed increases of 14.2% and 12.9% in the IS and pCS RR, respectively, after arterial line infusion for one hour, reaching RRs of 58.8% and 54.6%, respectively.40 Another strategy is the development of dialysis membranes capable of adsorbing PBUT by incorporating adsorbent particles such as activated carbon,38 zeolites41 or metalloorganic zirconium structures.42 In addition, the combination of both strategies with membranes containing competing molecules adhered to the luminal surface has been proposed.43 However, no clinical data on adsorptive strategies are available to date.
Another strategy reported in the literature to reduce the PBUT concentration is dietary intervention or the use of oral adsorbents.44 With respect to dietary modification, the MEDIKA study, a prospective crossover study conducted in patients with advanced chronic kidney disease, revealed that a very-low-protein diet (protein concentration of 0.3–0.5 g/kg per day, along with that of keto analogs), followed by a Mediterranean diet (protein concentration of 0.7–0.8 g/kg per day with a predominance of vegetable origin), resulted in reduced IS and pCS concentrations compared with a standard diet (1 g/kg per day with a predominance of animal origin).45 The authors explain this effect using a double mechanism. The first mechanism involves a reduction in protein intake, which is the initial substrate of protein-bound uremic toxins, and the second mechanism involves a modulatory effect on the intestinal microbiota, with a reduction in proteobacteria and an increase in saccharolytic and butyrate-forming species.43 With respect to the use of oral adsorbents as chelators of the products of the metabolism of the intestinal microbiota, there are only data on the use of Kremezin® (spherical activated carbon, AST-120; Kureha Chemical Industry Co Ltd, Tokyo, Japan) in patients with advanced chronic kidney disease,46 in whom a dose-dependent reduction in IS was observed. In addition, in hemodialysis patients,47 the total IS and total pCS levels were reduced by 45% and 31%, respectively.
This study has several notable limitations. First, the absence of a control group with another modality of hemodialysis prevents a direct comparison of the effect of postdilution HDF. Second, despite the influence of the duration of dialysis on the diffusion capacity of these molecules, the large difference between the 2 cohorts presented (117 vs. 20 patients) could explain the lack of statistically significant differences, as well as the discrepancies with the results of other studies. Third, only the clearance of 2 PBUT (IS and pCS) was measured, which makes it difficult to generalize to other uremic toxins bound to proteins. Finally, although the multivariate model explains part of the variability in IS clearance, other factors not considered could potentially influence the results. However, the main strength of this work is that it represents the largest cohort studied on the clearance of PBUT. In addition, our results reinforce the idea of the use of high blood and dialysate flows, along with an increase in therapy duration within each unit, to improve the diffusive capacity of these uremic toxins.
In summary, postdilution HDF with high convective volumes achieves clearance rates of protein-bound uremic toxins similar to those reported by other groups but higher than those obtained with high-flux hemodialysis or expanded hemodialysis. However, these results are insufficient given the demonstrated toxicity of these toxins, which cause increased cardiovascular mortality in hemodialysis patients. To optimize clearance, future studies should evaluate combined strategies, such as the integration of adsorptive membranes with hemodialysis techniques or the use of competing molecules.
FinancingThis research has not received specific support from public sector agencies, the commercial sector or nonprofit entities.
The authors declare that they have not received financial support for this project. FM has received fees from Amgen, Baxter, Fresenius Medical Care, Medtronic, Nipro, Palex and Vifor. The remaining authors declare that they have no conflicts of interest.
We would like to express our gratitude to all the patients who participated and to all the staff of the Dialysis Section of the Hospital Clínic de Barcelona for their collaboration in this study.
The following are Supplementary data to this article:
Scatter plot of the percentages of reduction in indoxyl sulfate with respect to final weight (A) and hematocrit (B) as well as p-cresyl sulfate (B and D, respectively). The Pearson coefficients and the corresponding p values are shown.
Scatter plot of the reduction percentages of indoxyl sulfate with the volume of substitution (A) and the filtration fraction (B) as well as of p-cresyl sulfate (B and D, respectively). The Pearson coefficients and the corresponding p values are shown.


