


Cardiovascular disease (CVD) is the main cause of death in children with chronic kidney disease (CKD). Inflammation and endothelial dysfunction (ED) are found in the majority of these patients and are factors associated to CVD. Flow mediated dilatation (FMD) is a surrogate marker validated for evaluating ED. Our objective was to identify risk factors associated to ED in children with CKD.
Materials and MethodsChildren 2–16 years of age were studied. Clinical information and biochemical variables were gathered, including intact parathyroid hormone (iPTH), interleukins 6 and 1b, high sensitivity C reactive protein (hsCRP), reduced glutathione, nitric oxide, malondialdehyde and homocysteine. FMD was measured, and considered altered if <7%.
ResultsIncluded were 129 patients aged 13.1 ± 2.6 years. FMD < 7% was found in 69 (52.7%). Patients with altered FMD had higher levels of triglycerides and hsCRP than those with normal FMD (145.5 mg/dl vs. 120.0 mg/dl, P = .042, y 1.24 U/L vs. 0.55 U/L, P = .007, respectively), as well as higher frequency of low iPTH (19.1% vs. 4.9%, P = .036). Levels of hsCRP correlated significantly with FMD (Rho = −0.28, P = .003). Patients with low iPTH (OR = 4.41, 95%CI 1.13–17.27, P = .033) and increased hsCRP (OR = 2.89, 95%CI 1.16–7.17, P = .022) had higher adjusted risk of having FMD < 7%.
ConclusionsHypertriglyceridemia, inflammation and low iPTH associated significantly with altered FMD. They are frequent, treatable risk factors for CVD.
La enfermedad cardiovascular (ECV) es la principal causa de muerte en niños con Enfermedad Renal Crónica (ERC). La inflamación y la disfunción endotelial (DE) se presenta en la mayoría de estos pacientes y son factores asociados a ECV. La dilatación mediada por flujo (DMF) <7% es un marcador subrogado validado en la evaluación de la DE. Nuestro objetivo fue identificar los factores de riesgo asociados a DE en niños con ERC.
Materiales y MétodosSe estudió a niños de 2–16 años de edad. Se recopiló su información clínica y variables bioquímicas, incluidos Hormona Paratiroidea Intacta (iPTH), interleucinas 6 y 1b, Proteína C Reactiva de alta sensibilidad (hsCRP), Glutatión reducido, óxido nítrico, malondialdehído, y homocisteína. Se consideró DMF alterada <7%.
ResultadosSe incluyó a 129 pacientes con edad de 13.1 ± 2.6 años. Tuvieron DMF < 7% 69 (52.7%). Los pacientes con DMF < 7% tuvieron niveles más altos de triglicéridos y de hsCRP que aquellos con DMF ≥ 7% (145.5 mg/dl vs. 120.0 mg/dl, P = .042, y 1.24 U/L vs. 0.55 U/L, P = .007, respectivamente), así como una mayor frecuencia de iPTH baja (19.1% vs. 4.9%, P = .036). Los niveles de hsCRP se correlacionaron significativamente con la DMF (Rho = −0.28, P = .003). Los pacientes con iPTH baja (OR = 4.41, 95% CI 1.13–17.27, P = .033) y con hsCRP incrementada (OR = 2.89, 95%CI 1.16–7.17, P = .022) tuvieron un riesgo ajustado mayor de DMF < 7%.
ConclusionesLa hipertrigliceridemia, la inflamación e iPTH baja se asociaron significativamente a una DMF alterada. Son factores de riesgo de ECV frecuentes y tratables.
According to data from the United States Renal Data System, the exact prevalence of chronic kidney disease (CKD) in children and adolescents was 9721 (99.1 per million inhabitants) as of 31 December 2016.1 During the period 2011–2015, the adjusted mortality for all causes was 39 per 1000 patients per year. The most frequently reported cause of death on the Death Report Form was attributed to cardiac causes. During this period, the adjusted mortality for cardiovascular disease (CVD) was 8 per 1000 patients per year. The rate of hospitalisation for CVD in the first year for incident patients under 22 years of age with terminal CKD was 55 per 1000 patients-year from 2006 to 2010, and 41 for the period 2011−2015. The highest rates of hospitalisation in incident patients were observed in children aged five to nine and young adults 18–21 years and in children treated with dialysis.1
Children with CKD have a high cardiovascular risk that may not become apparent until early adulthood. There is growing evidence that children with CKD have, in turn, a high frequency of cardiovascular risk factors and develop, from the early stages of their disease, cardiac and vascular alterations that are surrogate markers of early CVD, including left ventricular hypertrophy, left ventricular dysfunction, atherosclerosis, calcifications with aortic stiffness, carotid artery intimal thickening and endothelial dysfunction (ED).2
ED represents an early and persistent manifestation of CVD in CKD and has been shown to be an early change in the atherosclerosis process. The physiology and biochemistry of ED have been studied previously in children with CKD. Numerous factors can contribute to the presence of ED in CKD, such as dyslipidaemia, the drugs used to treat the disease itself and its complications, the increase in oxidative stress and other metabolic consequences such as alterations in calcium-phosphorus and parathyroid hormone metabolism.
ED in CKD involves abnormalities in the production and metabolism of nitric oxide (NO). A decrease in its synthesis may be due to the presence of high levels of l-arginine analogues, such as asymmetric dimethylarginine and symmetric dimethylarginine, which increase proportionally to the severity of CKD and competitively antagonise with NO synthetase.3–5 In addition, these have been shown to increase vascular tone and promote atherogenesis.6 Additionally, l-arginine levels are reduced. An increased inactivation of NO may also be due to oxidative stress and an increase in the concentration of free radicals.5
In CKD patients, as in other high-risk groups for CVD, such as patients with type 1 diabetes mellitus, lipid levels even at high normal limits may have an impact on endothelial function. Furthermore, the habitually high levels of triglycerides in CKD patients receiving peritoneal dialysis may play a role in ED, although their influence on the development of atherogenesis is still controversial.7–9
Alterations in calcium-phosphorus metabolism are also universal in these patients and are important determinants of CVD in CKD. Flow-mediated dilation (FMD), a validated surrogate marker of ED, has been correlated positively with blood calcium concentrations and negatively with alkaline phosphatase in children with stage 4 CKD.10 In contrast, a study of 80 predialysis patients did not find a significant association between clinical variables (age, gender, arterial hypertension, body mass index [BMI] z-score) and biochemical variables (haemoglobin, calcium-phosphorus product [Ca x P] and profile lipids) with carotid intima media thickness (cIMT) or with FMD.11
In patients undergoing haemodialysis (HD) replacement therapy, a study that compared 10 patients with this treatment modality versus 10 healthy controls demonstrated a decrease in FMD in children treated with HD.12
There are very few studies regarding the role of both traditional and non-traditional cardiovascular risk factors on endothelial function in children with CKD and none, as far as we know, that have included a complete analysis of them in children with CKD stages 2–5. Our objective was to identify the risk factors associated with ED in children with CKD both predialysis and on replacement therapy with automated peritoneal dialysis (APD) or with HD.
Material and methodsWith prior authorisation by the Research Ethics Committee and the National Scientific Research Committee of the Instituto Mexicano del Seguro Social [Mexican Social Security Institute], children from two to 16 years of age with a diagnosis of CKD stages two to five who were treated in the Paediatric Nephrology departments of the two tertiary care hospitals of the Instituto Mexicano del Seguro Social in Mexico City were invited to participate: the Hospital de Pediatría del Centro Médico Nacional Siglo XXI [Paediatric Hospital of the XXI Century National Medical Centre] and Hospital General del Centro Médico Nacional La Raza [La Raza National Medical Centre General Hospital]. Patients included were those with an established diagnosis of CKD at least one month prior and, in the case of stage five patients, who had remained in current replacement treatment: APD or HD, at least for the previous three months, and whose parents gave their informed consent for them to participate, as well as the children themselves giving their informed consent if they were over eight years old and in a position to do so. Patients suffering from CKD as a consequence of a rheumatic disease predetermining vasculitis, such as generalised lupus erythematosus, polyarteritis nodosa, acute vascular purpura, granulomatosis with polyangiitis, etc., were not included; nor were those who presented with clinical evidence, at the discretion of the researchers, of a source of infection at the time of the study or in the week prior to taking the laboratory samples and/or vascular ultrasound, carriers of known familial hyperlipidaemia, those taking immunosuppressants, and those patients who were expected not to cooperate with the requirements of the studies.
The day before the measurement of the FMD, the following were collected from the clinical history: age, weight, height (the BMI was calculated as the quotient of the kilograms of weight between the square of the height in metres, as well as its z-score), blood pressure, complete blood count and blood chemistry with lipid profile, liver function tests and electrolytes. Total cholesterol, high-density lipoprotein cholesterol, triglycerides, albumin, calcium, and phosphorus were measured with a Synchron CX® analyser (Beckman Systems, Fullerton, CA, USA) in accordance with the manufacturer's instructions. The coefficient of variation for total cholesterol and high-density lipoprotein cholesterol was 3.3% and 2.5%, respectively.
Measurement of FMD was performed in all patients by the same cardiologist specialising in imaging, with high resolution ultrasound (MicroMaxx® Fuji Film Sonosite Inc., Tokyo, Japan) with B-mode (real time), colour Doppler and spectral duplex Doppler equipped with a 7−12 MHz linear transducer. The patients treated with HD underwent the study during the day, between sessions. Before the study, patients had abstained from exercising (≥12 h), ingesting caffeine (≥12 h), and taking medications (≥4 half-lives of the drug), including anti-inflammatory drugs (non-steroidal for one day and acetylsalicylic acid for three days), and they were fasting (≥12 h). The study was carried out in supine position, with the patient resting in a quiet room, and with a controlled temperature (between 22 and 24 °C) for at least the previous 20 min.13 The basal diameter of the brachial artery was measured in the non-dominant arm, or on the opposite side if the former had an arteriovenous fistula. Reactive hyperaemia was obtained by insufflating the blood pressure cuff above the patient's systolic blood pressure for at least five minutes. Then, the pressure was suddenly released and the arterial diameter was measured again. The FMD was the product of (post-ischaemic reactive diameter—pre-ischaemic reactive diameter)/pre-ischaemic reactive diameter × 100, and was expressed as a percentage. If this percentage was equal to or greater than 7% it was considered normal, and if it was less than 7% it was considered altered, indicating ED.
On the same day as the FMD measurement, after fasting for 12 h, a sample was taken to determine the concentrations of high-sensitivity C-reactive protein (hsCRP) in blood and the cytokine profile. Interleukins 6 and 1β, as well as tumour necrosis factor alpha, were measured by enzyme-linked immunosorbent assay (ELISA; Quantikine® HS Human Immunoassay Kits, R&D Systems, Minneapolis, MN, USA). The hsCRP was also measured using an ELISA kit for hsCRP (Alpha Diagnostic, San Antonio, TX, USA ), and the results were read by the ELISA Sunrise® reader (Tecan US, Inc., Durham, NC, USA). Reduced glutathione was measured with a Lambda 25 spectrophotometer® (Perkin Elmer, Waltham, MA, USA). NO was measured with ELISA KontroLab EliRead (RT-2100C®) using the Griess method. Homocysteine was measured through chemiluminescence in Immulite 1000® equipment (Siemens, Munich, Germany).
The time of evolution of the disease referred to the time from the diagnosis of CKD to the measurement of FMD. In relation to nutritional status, patients were considered malnourished when their height z-score was <2,14 and overweight or obese according to International Obesity Task Force criteria.15 Patients who had at least two units above the 95th percentile for their height, gender and age in their personal record book in the last week were considered hypertensive, according to the Clinical Practice Guidelines for the search and management of hypertension in children and adolescents, from the American Academy of Pediatrics.16 Patients had anaemia if their haemoglobin levels were below the lower limit of those recommended by the World Health Organization according to their age and gender.17 To define whether intact parathyroid hormone (iPTH) levels were normal, low or high for the age and stage of CKD, the Guidelines from the Kidney Disease Outcomes Quality Initiative18 and Kidney Disease: Improving Global Outcomes19 were followed.
For descriptive statistics, simple frequencies and proportions were used, as well as means with standard deviation or medians and interquartile ranges. For the univariate inferential analysis, Student t-test or Mann-Whitney U test and the Chi test2 or Fisher's exact test were used, as well as the Pearson's r test or Spearman's Rho test, and ANOVA and Kruskal-Wallis tests, as necessary. For the multivariate analysis, the logistic regression model was used to identify the risk factors associated with altered FMD, all with the statistical package SPSS® v20.0 and considering P values <.05 as significant.
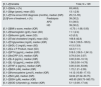
ResultsIn total, 129 patients were included: 63 girls (48.8%) and 66 boys (51.2%). The mean age was 13.1 ± 2.6 years, with a median time from CKD diagnosis of 25 months (interquartile range 12−55). 36 patients (27.9%) had adequate nutritional status, 12 (9.3%) were obese or overweight, and 81 (62.8%) were undernourished. 63 (48.8%) had hypertension, 78 (60.5%) anaemia, 36 (27.9%) albumin <4 g/dl, 63 (48.8%) hypercholesterolaemia, 97 (75.2%) hypertriglyceridaemia, 57 (44.2%) decreased high-density lipoprotein cholesterol, 12 (9.3%) elevated Ca x P product, 51 (39.5%) normal iPTH levels for CKD stage and age, 62 (48.1%) high iPTH and 16 (12.4%) low iPTH. Table 1 summarises the studied patients' biochemical characteristics.
Clinical and laboratory characteristics of patients.
| [0,1–2]Variable | Total, N = 129 | |
|---|---|---|
| [0,1–2]Girls, n (%) | 63 (48.8) | |
| [0,1–2]Age (years), mean (SD) | 13.1 (2.6) | |
| [0,1–2]Time since CKD diagnosis (months), median (IQR) | 25 (12−55) | |
| [2,0]Form of treatment, n (%) | Predialysis | 39 (30.2) |
| APD | 51 (39.5) | |
| HD | 39 (30.2) | |
| [0,1–2]BMI z-score, median (IQR) | −0.73 (−1.68; 0.00) | |
| [0,1–2]Haemoglobin (g/dl), mean (SD) | 11.1 (2.4) | |
| [0,1–2]Albumin (g/dl), mean (SD) | 4.3 (0.5) | |
| [0,1–2]Total cholesterol (mg/dl), mean (SD) | 169.8 (42.8) | |
| [0,1–2]Triglycerides (mg/dl), median (IQR) | 134.0 (109.5−195.5) | |
| [0,1–2]HDL-C (mg/dl), mean (SD) | 41.5 (13.9) | |
| [0,1–2]Ca x P Product, mean (SD) | 44.3 (11.1) | |
| [0,1–2]iPTH (pg/mL), median (IQR) | 519.0 (136.5−1,341.0) | |
| [0,1–2]hsCRP (U/l), median (IQR) | 0.79 (0.34−3.07) | |
| [0,1–2]IL-6 (pg/mL), median (IQR) | 0.00 (0.00−10.10) | |
| [0,1–2]IL-1β (pg/mL), median (IQR) | 1.58 (0.00−14.76) | |
| [0,1–2]TNF-α (pg/mL), median (IQR) | 0.00 (0.00−53.96) | |
| [0,1–2]MDA (nM), median (IQR) | 1.72 (1.21−2.39) | |
| [0,1–2]Homocysteine (μmol/l), median (IQR) | 14.12 (10.80−17.15) | |
| [0,1–2]NO (µM), median (IQR) | 34.94 (27.02–53.75) | |
| [0,1–2]GSH (µM), median (IQR) | 463.65 (363.75−563.75) | |
| [0,1–2]SOD (UI/protein g), median (IQR) | 5.11 (0.00−17.44) | |
APD: automated peritoneal dialysis; BMI: body mass index; CKD: chronic kidney disease; GSH: reduced glutathione; HD: haemodialysis; HDL-C: high-density lipoprotein cholesterol; hsCRP: high-sensitivity C-reactive protein; IL: interleukin; iPTH: intact parathyroid hormone; IQR: interquartile range; MDA: malondialdehyde; NO: nitric oxide; SD: standard deviation; SOD: superoxide dismutase; TNF-α: tumour necrosis factor alpha.
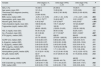
Thirty-nine patients had CKD stage 2–4 of and 90 CKD stage 5, of which 51 were on APD and 39 on HD. Patients in stages 2–4 had higher concentrations of haemoglobin and reduced glutathione, and lower concentrations of iPTH, as well as a lower frequency of anaemia and reduced glutathione below the first quartile. Patients on peritoneal dialysis had lower concentrations of albumin and higher cholesterol and triglycerides; they were the ones who most frequently presented with hypoalbuminaemia and hypertriglyceridaemia. Patients on HD had a longer evolution time since the diagnosis of the disease, as well as lower BMI z-scores, Ca x P products and NO concentrations; they had a higher frequency of arterial hypertension and NO below the first quartile. Median FMD was higher in stage two to four patients and lower in HD-treated patients, while the proportion of patients who had decreased FMD (<7%) was higher in HD-treated stage 5 patients and lower in patients in stages 2–4. However, these differences were not statistically significant (Tables 2 and 3).
Clinical and biochemical characteristics of the patients according to the stage of chronic kidney disease.
| Variable | CKD stages 2−4, n = 39 | CKD stage 5 APD, n = 51 | CKD stage 5 HD, n = 39 | P |
|---|---|---|---|---|
| Girls, n (%) | 19 (48.7) | 25 (49.0) | 19 (48.7) | .999 |
| Age (years), mean (SD) | 12.5 (3.4) | 13.28 (2.08) | 13.35 (2.28) | .322 |
| Time since CKD diagnosis (months), median (IQR) | 25.00 (13.00−83.00) | 16.00 (7.00−38.00) | 39.00 (21.00−82.00) | .002 |
| BMI z-score, median (IQR) | −0.25 (−1.31; 0.65) | −0.50 (−1.44; −0.05) | −1.13 (−2.27; −0.49) | .004 |
| Haemoglobin, (g/dl), mean (SD) | 12.73 (1.75)a,b,c | 10.49 (2.48)a,b | 10.51 (2.33)a,c | <.001 |
| Albumin (g/dl), mean (SD) | 4.40 (0.44)a | 3.97 (0.44)a,b | 4.43 (0.40)b | <.001 |
| Total cholesterol (mg/dl), mean (SD) | 169.59 (54.09) | 179.71 (33.25)a | 157.23 (38.89)a | .047 |
| Triglycerides (mg/dl), median (IQR) | 119.00 (88.00−189.00) | 160.39 (129.00−214.00) | 122.00 (102.00−169.00) | .001 |
| HDL-C (mg/dl), mean (SD) | 44.40 (15.23) | 38.93 (13.65) | 42.26 (12.67) | .172 |
| Ca x P product, mean (SD) | 45.13 (8.32) | 47.17 (10.92)a | 39.91 (12.65)a | .007 |
| iPTH (pg/mL), median (IQR) | 121.00 (61.70−359.00) | 896.00 (370.00−1,692.00) | 694.00 (238.00−1,604.00) | <.001 |
| hsCRP (U/l), median (IQR) | 0.53 (0.28−3.07) | 0.88 (0.29−2.95) | 1.26 (0.50−5.47) | .083 |
| IL-6 (pg/mL), median (IQR) | 0.00 (0.00−3.57) | 0.00 (0.00−16.08) | 0.00 (0.00−13.24) | .241 |
| IL-1β (pg/mL), median (IQR) | 2.66 (0.00−22.03) | 2.93 (0.00−23.65) | 0.23 (0.00−6.15) | .269 |
| TNF-α (pg/mL), median (IQR) | 0.00 (0.00−59.37) | 10.09 (0.00−66.59) | 0.00 (0.00−28.12) | .304 |
| MDA (nM), median (IQR) | 1.80 (1.10−2.86) | 1.71 (1.03−2.33) | 1.72 (1.28−2.36) | .600 |
| Homocysteine (μmol/l), median (IQR) | 13.10 (9.91−16.50) | 14.12 (10.40−16.50) | 14.12 (12.30−18.70) | .093 |
| NO (µM), median (IQR) | 32.07 (26.14−50.18) | 47.27 (30.65−61.40) | 31.15 (25.02−43.92) | .012 |
| GSH (µM), median (IQR) | 506.25 (392.50−670.00) | 390.00 (324.90−491.76) | 492.50 (363.75−577.50) | .001 |
| SOD (UI/protein g), median (IQR) | 3.28 (0.00−11.93) | 7.57 (1.43−23.37) | 3.80 (0.00−17.61) | .032 |
| FMD, median (IQR) | 8.00 (0.00−17.00) | 6.00 (0.00−17.00) | 3.00 (0.00−8.00) | .134 |
APD: automated peritoneal dialysis; BMI: body mass index; CKD: chronic kidney disease; FMD: flow-mediated dilation; GSH: reduced glutathione; HD: haemodialysis; HDL-C: high-density lipoprotein cholesterol; hsCRP: high-sensitivity C-reactive protein; IL: interleukin; iPTH: intact parathyroid hormone; IQR: interquartile range; MDA: malondialdehyde; NO: nitric oxide; SD: standard deviation; SOD: superoxide dismutase; TNF-α: tumour necrosis factor alpha.
For frequencies and proportions, Chi2 was used for comparisons.
For means with standard deviations, the one-way ANOVA test was used.
For medians with interquartile intervals, the Kruskal-Wallis test was used. Data in bold show p-values that were significant.
a,b,c They show the differences between the groups obtained with the Bonferroni post hoc test in ANOVA.
Clinical and biochemical characteristics of the patients according to the stage of chronic kidney disease.
| Variable | CKD stages 2−4, n = 39 | CKD stage 5 APD, n = 51 | CKD stage 5 HD, n = 39 | P |
|---|---|---|---|---|
| Nutritional condition | ||||
| Well nourished | 10 (25.6) | 16 (31.4) | 10 (25.6) | .080 |
| Overweight-obese | 7 (17.9) | 5 (9.8) | 0 (0.0) | |
| Malnourished | 22 (56.4) | 30 (58.8) | 29 (74.4) | |
| Hypertension | 11 (28.2) | 28 (54.9) | 24 (61.5) | .007a |
| Anaemia | 14 (35.9) | 36 (70.6) | 28 (71.8) | .001a |
| Albumin < 4 g/dl | 7 (17.9) | 25 (49.0) | 4 (10.3) | <.001 |
| Hypercholesterolaemia | 20 (51.3) | 29 (56.9) | 14 (35.9) | .134 |
| Hypertriglyceridaemia | 22 (56.4) | 47 (92.2) | 28 (71.8) | <.001 |
| Low HDL-C | 17 (43.6) | 27 (52.9) | 13 (33.3) | .178 |
| Increased Ca x P product | 2 (5.1) | 6 (11.8) | 4 (10.3) | .545 |
| iPTH | ||||
| High | 22 (56.4) | 24 (47.1) | 16 (41.0) | .185 |
| Normal | 16 (41.0) | 20 (39.2) | 15 (38.5) | |
| Low | 1 (2.6) | 7 (13.7) | 8 (20.5) | |
| hsCRP > 3Q | 8 (20.5) | 11 (21.6) | 12 (30.8) | .496 |
| IL-6 > 3Q | 5 (12.8) | 15 (29.4) | 11 (28.2) | .145 |
| IL-1β > 3Q | 11 (28.2) | 14 (27.5) | 6 (15.4) | .317 |
| TNF-α > 3Q | 10 (25.6) | 13 (25.5) | 7 (17.9) | .643 |
| MDA > 3Q | 13 (33.3) | 10 (19.6) | 8 (20.5) | .265 |
| Homocysteine > 3Q | 7 (17.9) | 12 (23.5) | 11 (28.2) | .562 |
| NO < 1Q | 31 (79.5) | 30 (58.8) | 35 (89.7) | .003 |
| GSH < 1Q | 23 (59.0) | 46 (90.2) | 29 (74.4) | .003 |
| SOD < 1Q | 35 (89.7) | 33 (64.7) | 29 (74.4) | .024 |
| FMD < 7 | 17 (43.6) | 27 (52.9) | 24 (61.5) | .283 |
APD: automated peritoneal dialysis; CKD: chronic kidney disease; FMD: flow-mediated dilation; GSH: reduced glutathione; HD: haemodialysis; HDL-C: high-density lipoprotein cholesterol; hsCRP: high-sensitivity C-reactive protein; IL: interleukin; iPTH: intact parathyroid hormone; MDA: malondialdehyde; NO: nitric oxide; SOD: superoxide dismutase; TNF-α: tumour necrosis factor alpha; 1Q first quartile; 3Q third quartile.
Frequencies and percentages are reported; the Chi2 test was used.
Data in bold show p-values that were significant.
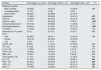
Sixty-eight patients (52.7%) had FMD < 7% and 61 (47.3%) had FMD ≥ 7%. In patients with FMD < 7%, triglyceride and hsCRP concentrations were significantly higher than in patients with FMD ≥ 7%. Similarly, the proportion of patients with hypertriglyceridaemia, with low iPTH concentrations and who had hsCRP above the third quartile were significantly higher in the first group. There were no significant differences in any of the other variables compared (Tables 4 and 5).
Clinical and laboratory characteristics of patients according to flow-mediated dilation.
| Variable | FMD < 7%, n = 68 | FMD ≥ 7%, n = 61 | P |
|---|---|---|---|
| Girls, n (%) | 31 (45.6) | 32 (52.5) | .436 |
| Age (years), mean (SD) | 13.1 (2.5) | 13.1 (2.7) | .659 |
| Time since CKD diagnosis (months), median (IQR) | 24 (11−47) | 29 (12−58) | .436 |
| Form of treatment, n (%) | |||
| Predialysis | 17 (25.0) | 22 (36.1) | .283 |
| APD | 27 (39.7) | 24 (39.3) | |
| HD | 24 (35.3) | 15 (24.6) | |
| BMI z-score, median (IQR) | −0.50 (−1.31; −0.02) | −1.03 (−2.09; 0.05) | .207 |
| Haemoglobin, (g/dl), mean (SD) | 11.4 (2.2) | 10.9 (2.6) | .312 |
| Albumin (g/dl), mean (SD) | 4.2 (0.4) | 4.2 (0.5) | .615 |
| Total cholesterol (mg/dl), mean (SD) | 169.1 (38.4) | 170.7 (47.6) | .779 |
| Triglycerides (mg/dl), median (IQR) | 145.5 (115.7−214.0) | 120.0 (101.0−181.0) | .042 |
| HDL-C (mg/dl), mean (SD) | 40.2 (13.2) | 43.1 (14.6) | .280 |
| Ca x P product, mean (SD) | 43.7 (11.4) | 44.9 (10.8) | .847 |
| iPTH (pg/mL), median (IQR) | 495.5 (130.0−1,088.2) | 519.0 (137.5−1,648.0) | .266 |
| hsCRP (U/l), median (IQR) | 1.24 (0.49−5.41) | 0.55 (0.28−2.14) | .007 |
| IL-6 (pg/mL), median (IQR) | 0.00 (0.00−14.08) | 0.00 (0.00−5.55) | .820 |
| IL-1β (pg/mL), median (IQR) | 1.17 (0.00−18.80) | 2.11 (0.00−7.90) | .895 |
| TNF-α (pg/mL), median (IQR) | 0.00 (0.00−41.34) | 5.28 (0.00−62.98) | .230 |
| MDA (nM), median (IQR) | 1.72 (1.08−2.36) | 1.72 (1.27−2.56) | .512 |
| Homocysteine (μmol/l), median (IQR) | 13.96 (10.10−17.40) | 14.12 (11.30−16.50) | .639 |
| NO (µM), median (IQR) | 35.19 (26.41−53.29) | 34.94 (27.74−54.33) | .976 |
| GSH (µM), median (IQR) | 461.7 (353.7−557.4) | 491.7 (370.0−578.3) | .583 |
| SOD (UI/protein g), median (IQR) | 6.28 (0.00−17.80) | 2.47 (0.00−17.19) | .457 |
APD: automated peritoneal dialysis; BMI: body mass index; FMD: flow-mediated dilation; GSH: reduced glutathione; HD: haemodialysis; HDL-C: high-density lipoprotein cholesterol; hsCRP: high-sensitivity C-reactive protein; IL: interleukin; iPTH: intact parathyroid hormone; IQR: interquartile range; MDA: malondialdehyde; NO: nitric oxide; SD: standard deviation; SOD: superoxide dismutase; TNF-α: tumour necrosis factor alpha.
For frequencies and proportions, Chi2 was used for comparisons.
For means with standard deviations, Student's t-test was used for comparisons.
For medians with interquartile ranges, the Mann-Whitney U test was used for comparisons.
Data in bold show p-values that were significant.
Clinical and laboratory characteristics of patients according to flow-mediated dilation.
| Variable | FMD < 7%, n = 68 | FMD ≥ 7%, n = 61 | P |
|---|---|---|---|
| Nutritional condition | |||
| Well nourished | 21 (30.9) | 15 (24.6) | .728 |
| Overweight-obese | 6 (8.8) | 6 (9.8) | |
| Malnourished | 41 (60.3) | 40 (65.6) | |
| Hypertension | 30 (44.1) | 33 (54.1) | .258 |
| Anaemia | 40 (58.8) | 38 (62.3) | .687 |
| Albumin < 4 g/dl | 15 (22.1) | 21 (34.4) | .118 |
| Hypercholesterolaemia | 32 (47.1) | 31 (50.8) | .670 |
| Hypertriglyceridaemia | 56 (82.4) | 41 (67.2) | .047 |
| Low HDL-C | 31 (45.6) | 26 (42.6) | .735 |
| Increased Ca x P product | 9 (13.2) | 3 (4.9) | .104 |
| iPTH | |||
| High | 28 (41.2) | 34 (55.7) | .036 |
| Normal | 27 (39.7) | 24 (39.3) | |
| Low | 13 (19.1) | 3 (4.9) | |
| hsCRP > 3Q | 22 (32.4) | 9 (14.8) | .020 |
| IL-6 > 3Q | 19 (27.9) | 12 (19.7) | .272 |
| IL-1β > 3Q | 18 (26.5) | 13 (21.3) | .494 |
| TNF-α > 3Q | 14 (20.6) | 16 (26.2) | .449 |
| MDA > 3Q | 15 (22.1) | 16 (26.2) | .580 |
| Homocysteine > 3Q | 18 (26.5) | 12 (19.7) | .361 |
| NO < 1Q | 52 (76.5) | 44 (72.1) | .573 |
| GSH < 1Q | 53 (77.9) | 45 (73.8) | .580 |
| SOD < 1Q | 50 (73.5) | 47 (77.0) | .644 |
FMD: flow-mediated dilation; GSH: reduced glutathione; HDL-C: high-density lipoprotein cholesterol; hsCRP: high-sensitivity C-reactive protein; IL: interleukin; iPTH: intact parathyroid hormone; MDA: malondialdehyde; NO: nitric oxide; SOD: superoxide dismutase; TNF-α: tumour necrosis factor alpha; 1Q first quartile; 3Q third quartile.
Frequencies and percentages are reported; the Chi2 test was used.
Data in bold show p-values that were significant.
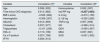
In the correlation analysis, only the blood concentrations of hsCRP were significantly (negatively) correlated with FMD (Rho = −0.25, P = .003), as shown in Table 6.
Analysis of correlation of flow-mediated dilation with clinical and biochemical variables.
| Variable | Correlation (P)a | Variable | Correlation (P)a |
|---|---|---|---|
| Age | 0.008 (.932) | Homocysteine | 0.052 (.557) |
| Time since CKD diagnosis | 0.013 (.882) | hsCRP log | −0.257 (.003) |
| BMI z-score | −0.020 (.824) | IL-6 log | −0.210 (.139) |
| Haemoglobin | −0.008 (.927) | IL-1β log | −0.025 (.826) |
| Albumin | 0.012 (.893) | TNFα log | 0.057 (.656) |
| Cholesterol | 0.037 (.677) | NO | −0.089 (.314) |
| Triglycerides | −0.101 (.254) | GSH | −0.060 (.497) |
| HDL-C | 0.115 (.196) | MDA | 0.037 (.681) |
| Ca x P product | 0.027 (.766) | SOD | −0.091 (.302) |
| iPTH | 0.058 (.513) |
BMI: body mass index; GSH: reduced glutathione; HDL-C: high-density lipoprotein cholesterol; hsCRP: high-sensitivity C-reactive protein; IL: interleukin; iPTH: intact parathyroid hormone; MDA: malondialdehyde; NO: nitric oxide; SOD: superoxide dismutase; TNF-α: tumour necrosis factor alpha.
Data in bold show p-values that were significant.
In the logistic regression model, which included the variables that demonstrated a significant association with FMD in the univariate analysis, as well as the stage of CKD and the form of treatment (stages 2–4 vs. stage 5 on PD vs. stage 5 on HD), it was found that patients with low iPTH for their age and CKD stage (OR 4.41, 95% CI 1.13–17.27, P = .033) and with hsCRP levels above the third quartile (OR 2.89, 95% CI 1.16–7.17, P = .022) had a greater probability of having FMD < 7%, regardless of the other variables included (Table 7).
Logistic regression model for the probability of having flow-mediated dilation <7%.
| Variable | B | P | OR | [0,5–6]95% CI | |
|---|---|---|---|---|---|
| Lower | Higher | ||||
| CKD stage 5 in APD | −0.082 | .863 | 0.921 | 0.361 | 2.353 |
| CKD stage 5 on HD | 0.328 | .511 | 1.388 | 0.521 | 3.696 |
| Hypertriglyceridaemia | 0.919 | .051 | 2.508 | 0.997 | 6.308 |
| Low iPTH | 1.484 | .033 | 4.409 | 1.126 | 17.267 |
| hsCRP > 3Q | 1.060 | .022 | 2.888 | 1.163 | 7.171 |
APD: automated peritoneal dialysis; CKD: chronic kidney disease; HD: haemodialysis; hsCRP: high-sensitivity C-reactive protein; iPTH: intact parathyroid hormone; 3Q: third quartile.
Variables included in the model: stage of CKD and form of treatment (CKD stage 2−4 is the baseline category), hypertriglyceridaemia, low iPTH, hsCRP > 3Q.
CVD is the leading cause of death in children with CKD and is the product of a lethal combination of several traditional and non-traditional risk factors, and their effects on cardiac and vascular structure and function. ED is an early and persistent manifestation of CVD and its risk factors have previously been extensively studied in adults in various diseases characterised by their high cardiovascular risk. However, there are very few studies in children with CKD and we have not identified, to date, any that included patients in stages 2–4 together with patients in stage 5 on peritoneal dialysis and HD, and even fewer in a multivariate approach that considers both traditional and non-traditional risk factors.
FMD has proven to be a reliable surrogate marker for ED. In this study, just over half of the patients had decreased FMD (<7%) and the patients on HD had lower FMD than those on APD, and in these, in turn, it was lower than in predialysis patients. Like other authors, we found that ED was more frequent in children on HD and APD, although it was present even in children from predialysis stages.11,20 Recent studies have shown ED even in children with nephrotic syndrome.21
Attempts to demonstrate the association found between hypertriglyceridaemia and altered FMD had been made before, although in studies with other designs and in more limited populations. Khandelwal et al. evaluated, in 80 predialysis children, the effect of clinical variables (age, gender, hypertension, BMI) and biochemical variables (haemoglobin, Ca x P product and lipid profile) on cIMT and on FMD, finding a significant association between cholesterol linked to low-density lipoproteins and cIMT, but no association of these variables with FMD.11 Similarly, a recent study by Kosmeri et al. also demonstrated a significant association between blood lipid alterations with cIMT, but not with FMD.22 Hussein et al. demonstrated, in 34 children with stage 4 CKD, a positive correlation between FMD and blood calcium. However, they did not find any association with the duration of the disease, estimated glomerular filtration rate or blood pressure.10 Lilien et al. studied, in kidney transplanted children, the association of FMD with age, gender, BMI, blood pressure, lipid profile, glomerular filtration rate and the use of cyclosporine and antihypertensive drugs, only finding a significant association between the need to use antihypertensives and baseline vascular diameter.23 The frequency of hypertriglyceridaemia was greater in CKD patients treated with peritoneal dialysis, which is expected given the high glycaemic load they receive at each dialysis change and the secondary hyperinsulinism that this causes. However, hypertriglyceridaemia was not exclusive to this group of patients and is also a risk factor that deserves particular attention, regardless of the form of treatment.
Another relevant finding of the study was the association between FMD and low concentrations of iPTH. The adverse effects of CKD adynamic bone disease on the cardiovascular system include vascular damage, usually manifested as vascular calcifications (VC). Through the use of bone biopsies, Tomiyama et al. found a significant association between the presence of VC and a decreased trabecular bone volume, as well as with a low rate of bone formation in predialysis patients.24 London et al. reported a significant association between the dose of calcium-based phosphorus binders, bone activity, VC and aortic stiffness. Calcium load has been shown to have a significant impact on VC and aortic stiffness in patients with adynamic-type bone disease when compared to patients with more active bone metabolism.25 Barreto et al. reported, in a prospective study, a negative correlation between coronary calcifications and bone volume; and a state of low bone exchange was the only independent risk factor predictor of progression of coronary calcifications in patients treated with HD.26 We have previously reported that high iPTH concentrations were independently associated as a risk factor for aortic stiffness, but so were low iPTH concentrations.27 To our knowledge, this is the first study that demonstrates an association between low iPTH and alterations in FMD and that may contribute to confirming that adynamic bone disease (ABD) can be associated with vascular damage even in early stages of CKD, and even before VCs become obvious. An area of opportunity for further studies exists regarding the search for an association between levels of vitamin D, fibroblast growth factor 23 (FGF-23) and klotho with alterations in FMD in children with CKD, since they are closely related to renal control of phosphorus. Increasing FGF-23 has previously been shown to reduce blood calcium concentrations increasing iPTH. CKD decreases the expression of α-klotho, the co-receptor for FGF-23. Reduced klotho activity can lead to resistance to FGF-23.28 Klotho has been shown to affect endothelial function by increasing smooth muscle cells and by generating NO.29 Endothelial function can also be enhanced by vitamin D and vitamin D receptor agonists.30–32 FGF-23 has various effects, including those on the renin-angiotensin-aldosterone system, mediators of inflammation, and as a vitamin D agonist.33 A recent study has associated FGF-23 with iPTH and mineral metabolism disorders in CKD.34
In this study, we found a consistent association in both univariate and multivariate analyses between blood hsCRP concentrations and FMD. To our knowledge, this association had not been previously described in children with CKD, despite the fact that inflammation is practically constant in patients with this disease. Inflammation is a central mechanism of ED and there is abundant evidence of the association between inflammation and oxidative stress. The dysfunctional endothelium promotes the generation of reactive oxygen species that aggravate vascular inflammation. Oxidative stress can amplify vascular inflammation, and the increase in inflammatory cells increases, in turn, the production of superoxides.35 A close relationship between ED, assessed by FMD, and vascular inflammation has been demonstrated in subjects with even low cardiovascular risk factors.36 HsCRP contributes to atherosclerosis in early stages of CVD, increasing its deposit in the vascular intima even before the appearance of monocytes.37 This affects the bioavailability of NO and leads to intimal hyperplasia of the vessels. It appears that hsCRP acts on oxidised low-density lipoprotein, which plays a central role in ED induced by oxidised low-density lipoprotein in endothelial cells.38 This pro-inflammatory environment is also exacerbated by the overexpression of tumour necrosis factor alpha and interleukin 1β, which promote leukocyte migration and adhesion.39 These chemokines induce endothelial cells and leukocytes to express vascular cell adhesion molecules and intercellular adhesion molecules, monocyte chemotactic protein 1, E-selectin and P-selectin, which in turn contribute to the worsening of the ED.40
ED is a multifactorial, early and permanent manifestation of CVD. In children with CKD, the association of the different risk factors, both traditional and non-traditional, in patients in stages 2–5 undergoing medical treatment as well as APD or HD, and with a multivariate analysis approach, had not been studied previously. Our results confirm the detrimental effect of inflammation and hypertriglyceridaemia on endothelial function and point to the need to pay more attention to ABD, which can be the consequence of a sometimes excessive treatment of metabolic bone disease, as a cause of ED.
A limitation of our study, but an area of opportunity for further studies, was the incomplete study of the patients' bone metabolism.
ConclusionsHypertriglyceridaemia, increased hsCRP and low iPTH concentrations were significantly associated with altered FMD in children with stages two to five CKD included in our study. These are common and potentially preventable and treatable CVD risk factors.
FundingThis work has been funded by the Fondo para Investigacion en Salud, Mexico (grant number FIS/IMSS/PROT/G11/932).
Conflicts of interestThe authors declare that they have no conflicts of interest.
The authors would like to thank Susan Drier-Jonas for her assistance with the manuscript.
Please cite this article as: García-Bello JA, Gómez-Díaz RA, Contreras-Rodríguez A, Sánchez-Barbosa L, Mondragón-González R, Gallardo-Montoya JM, et al. Disfunción endotelial en niños con enfermedad renal crónica. Nefrologia. 2021;41:436–445.