El péptido natriurético cerebral (BNP) es una hormona que se libera a la circulación en respuesta de dilatación ventricular. Sus niveles se correlacionan con la masa del ventrículo izquierdo y con la disfunción ventricular. Los pacientes en diálisis presentan valores elevados a consecuencia de la situación de expansión de volumen y la reducción de su aclaramiento. Objetivo: analizar los niveles de BNP en pacientes sometidos a diferentes técnicas de hemodiafiltración: on-line diaria (HDFOLd), on-line (HDFOL) y con bajo volumen convectivo (HDF). Se determinaron las concentraciones séricas pre y posdiálisis de 15 pacientes (cinco de cada grupo) durante ocho semanas. Se efectuaron dos determinaciones, una a principio de semana (período largo) y otra al final de semana (período corto), con el fin de determinar si existían diferencias significativas entre técnicas y entre períodos. Al comparar los valores globales de BNP prehemodiálisis entre el período corto (BNPpreC) y el largo (BNPpre-L), se objetivaron diferencias significativas. Igualmente, se apreciaron diferencias entre el BNP pos del período corto y del largo. Asimismo, entre el BNP pre-C vs. BNPpos-C y entre BNPpre-L vs. BNPpos-L. El estudio comparativo entre técnicas mostró diferencias significativas en el período corto entre el BNPpre-C y BNPpos-C de HDFOLd con respecto a las mismas determinaciones en HDF y HDFOL. Conclusión: aunque la determinación del BNP tiene un potencial limitado para la evaluación del estado de hidratación en los pacientes en hemodiálisis, en este trabajo hemos comprobado que tras la sesión de diálisis se produce un descenso significativo del BNP, tanto en el período corto como en el largo, y que de manera significativa los pacientes del grupo de diaria presentan concentraciones inferiores de BNP, lo que se explicaría por la menor ganancia de peso interdiálisis y la mejor tolerancia hemodinámica a la técnica.
IB-type natriuretic peptide is a cardíac neurohormone secreted by the cardíac ventricules in response to ventricular dilatation so plasma BNP level correlate with left ventricular mass and dysfunction. Dialysis patients have much greater levels of BNP due to the volume overload and because of reduced renal clearance. The aim of this study was to mesure and compare the BNP levels in three groups of patients who received different hemodiafiltration techniques: Daily online hemodiafiltration (HDFOLd), on-line hemodiafiltration (HDFOL) and low convective volume hemodiafiltration (HDF). Fifteen patients were included, five in each group. Pre and postdialysis BNP leves were measured during 8 weeks. The measure was done at the beginning of the week (long period), and at the end (short period), in order to study if there were significative differences between techniques and periods. We found significative differences between predialysis BNP levels in the short period (BNPpreC) and the long period (BNPpre-L). We also found significative differences with the posdialysis BNP in both periods; BNPpre-L vs. BNPpos-L (1069±1031 vs. 612 ± 540). After comparing the three techniques the study showed significative differences between BNPpreC in HDF and HDFOL compared with HDFOld. And also after dialysis between BNPpos-C in HDFOLd compared with the other techniques. Conclusion: Although previous papers have shown that BNP levels have limited potential for assessment of hydration in hemodialysis patients, in this study our data demonstrate that after dialysis BNP levels decline in a significative way in the long and short period and we have found that patients on daily hemodialysis show lower BNP levels, and maybe this could be explained because daily on-line haemodiafiltration patients had lower weight rise between dialysis sessions and also better haemodynamic tolerance.
INTRODUCTION
The mortality of patients affected by terminal chronic kidney disease is fundamentally determined by cardiovascular disease. Heart failure is extremely prevalent among patients on haemodialysis. Recently, different subtypes of natriuretic peptides have been discovered that serve as diagnostic markers of heart failure and as prognostic factors of mortality. They can be divided into two subtypes: atrial (ANP) and type B (BNP), which is fundamentally secreted by cardiomyocytes. BNP is released into the bloodstream in response to ventricular dilation and an excess of pressure. BNP causes natriuresis, vasodilation, inhibition of the renin-angiotensin system and of sympathetic nervous system activity. The main sources of BNP production are the ventricles.1 The plasmatic concentration is correlated with the left ventricular (LV) mass and with its dysfunction which is very common in patients undergoing haemodialysis (HD). It has also been observed to be closely related to coronary filling pressure and atrial volume. Some previous studies suggest the possible use of BNP concentration as an indicator of excessive volume and LV dysfunction in patients undergoing dialysis. However, its possible usefulness for this purpose remains unclear.1 Apart from the glomerular filtration, BNP is eliminated from the plasma through natriuretic peptide receptors and degraded by endopeptidases.2
The BNP concentration is increased in patients undergoing haemodialysis.3 Following the haemodialysis session, there is a significant reduction in the serum BNP concentration. This reduction may be explained by a decrease in BNP production caused by a decrease in plasmatic volume, its elimination through haemodialysis, or both factors.2-4
OBJECTIVE
The objective of this study is to evaluate and compare the serum BNP concentration in three groups of uraemic patients undergoing dialysis with different haemodiafiltration techniques in order to study the influence of weight gain on BNP concentration during the different methods of haemodiafiltration.
a) On-line haemodiafiltration three times a week (OLHDF).
b) Haemodiafiltration (HDF).
c) Daily on-line haemodiafiltration (D-OL-HDF six times a week).
MATERIAL AND METHODS
The study includes 15 stable patients in a haemodialysis programme for more than six months presenting a constant dry weight for more than a month.
Exclusion criteria
Patients who presented stage III or IV heart failure, extreme malnutrition or those who had needed a dry weight adjustment in the previous month as a result of experiencing oedema or dyspnoea were excluded. We decided not to exclude patients with coronary artery disease, because although the condition leads to higher BNP levels, its prevalence was similar for all three groups.
Collection of samples
Blood samples were collected during eight consecutive weeks from March to April 2007. The samples were taken at the beginning of the week (long period; Monday or Tuesday) and at the end of the week (short period; Friday or Saturday). We collected 20-25ml of blood in an EDTA-anticoagulant tube before and just after the dialysis session. All of the samples were immediately centrifuged, stored at -70º C and analysed at the same time.
Variables studied
The BNP concentration was measured for each sample using the ADVIA Centaur Kit by Bayer.
We determined the concentration of troponin 1 before and after the haemodialysis session for both the long and short dialysis intervals (pre-L troponin; post-L troponin; pre-S troponin; post-S troponin) and the normal haemodialysis parameters: std Kt/V, KT, EKR, albumin and haemoglobin. The systolic, diastolic and mean arterial pressures and pulse rate were recorded before and after dialysis in both dialysis intervals (SAP pre-L; SAP post-L; DAP pre-L; DAP post-L; SAP pre-S; SAP post-S; DAP pre-S; DAP post-S). Weight loss and gain were measured in both periods. In all of the groups, haemodiafiltration was post-dilution. The composition of the dialysis fluid was as follows: sodium 140mEq/l, potassium 3mEq/l, calcium 3mEq/l, magnesium 1.5mEq/l, chlorine 117mEq/l, bicarbonate 30mEq/l and acetic acid 2mEq/l
Statistical analysis
The results were expressed as the mean ± standard deviation. The Student T-test and the Kruskal-Wallis test were used. The Pearson method was used for analysing the correlations. Values of p < 0.05 were considered to be statistically significant.
RESULTS
Table 1 shows the principle characteristics of each patient included in the study.
Patients in the D-OL-HDF group received dialysis six times weekly with an average duration of 138 ± 7 minutes per session. They had a mean age of 71 years and had been receiving haemodialysis for an average of 10 ± 5 years. We used 1.88m2 polysulphone membrane high-flux dialysers for four of the D-OL-HDF patients and 2m2 for one patient.
Patients in the OL-HDF group received dialysis three times a week with an average duration of 261 ± 10 minutes per session. The mean age of these patients was 73 ± 5 years and they had been receiving haemodialysis for 8 ± 4 years. They all used high-flux 2m2 polysulphone dialysers.
In turn, HDF group patients also received dialysis three times weekly for 267 ± 15 minutes per session. The average age was 76 ± 8 and they had undergone haemodialysis for 5 ± 4 years. They also used high-flux 2m2 polysulphone dialysers. No significant differences were found between groups regarding patient age or time on dialysis.
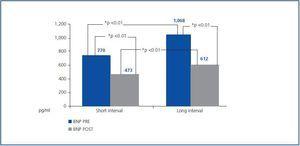
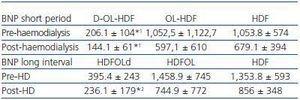
In general, the serum BNP concentration before haemodialysis during the short dialysis interval was 770.45 ± 792pg/ml and in the long period 1,068 ± 1,031pg/ml; the differences between both intervals had a p < 0.05 significance. After the haemodialysis session, the BNP concentration was significantly reduced in both intervals; post-S BNP: 473 ± 460 vs. post-L BNP: 612 ± 540. There were also significant differences between the intervals (post-L BNP vs. post-S BNP) (figure 1). In the comparative study of the three techniques, we found significantly lower concentrations in the short dialysis interval in the daily D-OL-HDF group, both before (BNP pre-S) and after (BNP post-S) haemodialysis, compared with the other two techniques (table 2). With respect to the long dialysis interval, the comparative study of the techniques only shows differences between the post-L BNP in the D-OL-HDF group and those using the other two techniques (table 2).
The analysis of the rest of the laboratory and clinical parameters is shown in tables 3 and 4.
In the D-OL-HDF group, the concentration of troponin 1 did not vary significantly following the dialysis session for either period.
The weight gain was 2.2 ± 0.26kg in the long dialysis interval and 0.71 ± 0.65kg in the short interval, with significant differences between both (p < 0.01). Likewise, there were significant differences in the ultrafiltration for each interval (long 1.83 ± 0.77 vs. 1.12 short).
Regarding the arterial pressure measurements, we observed significant differences between mean arterial pressures in the long interval (pre-L and post-L) and pulse pressure pre-L and post-L. There are also differences between the pre-L MAP and the pre-S MAP (table 3).
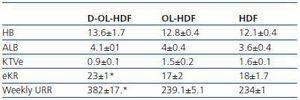
The average haemoglobin (Hb) concentration was 13.6 ± 1.7, albumin (Alb) 4.1 ± 0.1, std Kt/V 0.9 ± 0.1, EKR 23 ± 1 and the weekly urea reduction ratio (weekly URR) was 382 ± 17.
Patients in the HDF group showed a weight gain of 2.6 ± 0.8kg in the long dialysis interval and 1,7 ± 0,53 in the short and the difference was significant (p < 0.01). From the arterial pressure measurements, we observed significant differences between the mean arterial pressures in the long interval/pre-L MAP and post-L MAP) (p < 0.01) and between pre-L MAP and pre-S MAP (p < 0.05). The differences between pulse pressure pre-L PP and post-L PP and between pre-L PP and pre-S PP were also significant (p < 0.01).
Lastly, the OL-HDF patients had pre-and post-L troponin 1 concentrations of 0.04 ± 0.03 and 0.38 ± 0.02; the differences were significant (p < 0.05). The weight gain was 2.5 ± 0.8kg in the long dialysis interval and 1.7± 0.5 in the short (p < 0.01) and the weight loss was 2.4 ± 0.6 and 1.9 ± 0.9 in the long and short intervals respectively (p < 0.01). From the arterial pressure measurements, we found significant differences between the mean arterial pressures in the long interval (pre-L MAP) and post-L MAP (p < 0.01) and between pre-L MAP and pre-S MAP (p < 0.05). We did not observe any differences between the remainder of the parameters including pulse pressure. After applying the regression equation, a positive correlation was observed between weight gain in the short interval and pre-S BNP (r = 0.64/p < 0.01).
Regarding the dose of dialysis, as expected, the D-OL-HDF group presented significantly higher weekly EKR and URR values compared to the other two groups (table 4).
DISCUSSION
The diagnostic and prognostic value of BNP in patients with heart failure has been known for some time.5,6 Previous attempts have been made to demonstrate its usefulness in determining the hydration state of patients undergoing haemodialysis.1-3,5,7,8 Most of these studies showed that serum BNP concentration is over the baseline rate for patients on haemodialysis owing to the fact that a percentage of this molecule is eliminated renally and to the high presence of systolic dysfunction among patients on dialysis.5 Nevertheless, the results from these studies have been contradictory. While Osajima et al. showed little usefulness for BNP as a marker of volume status due to a lack of correlation between weight loss and BNP variations during haemodialysis,7 Seoung et al. demonstrated the value of BNP in determining the state of hydration, particularly for over-hydration. In our study, as was the case with Sheen et al.,5 we have demonstrated that, in general, there is a significant decrease in BNP concentration following the haemodialysis session.5 The reduction in BNP plasmatic concentration may be due, not only to a decrease in BNP secretion/production caused by the reduction in the plasmatic volume, but also to its elimination through dialysis. In this sense, for those techniques by which a larger convection volume is applied D-OL-HDF and OLHDF), lower post-dialysis concentrations of BNP are found, probably due to BNP being of medium molecular weight and mostly eliminated through convection.
We can also confirm that BNP concentrations are significantly higher both pre- and post-haemodialysis in the long than in the short dialysis interval (p < 0.01).
When we compare the different haemodiafiltration groups, we observe that in the short dialysis interval (at the end of the week) there was a significant reduction in BNP concentration in the HDF and daily groups while no significant changes are found in the long. A similar effect was recorded by Nishikimi et al., whose study found that BNP values decreased after the mid-weekly haemodialysis session but not after the session at the beginning of the week.4
This could be due to the existence of a higher degree of hypervolaemia at the beginning of the week which would create a stronger stimulus to prolong BNP secretion. In addition, the study comparing techniques showed significant differences between post- and pre- BNP levels in the short interval and between the daily OL-HDF and the other techniques; that is, we observed that the daily OL-HDF group presented lower BNP concentrations both before and after haemodialysis. This is similar to the results obtained by Odar et al. in their 2006 study in which they treated a group of patients with daily haemodialysis resulting in a significant decrease in BNP concentration.9 Our study shows a positive correlation between weight gain in the short interval and the prehaemodialysis BNP concentration at that time. This supports the claim that BNP concentration before haemodialysis provides information regarding the patients’ hydration status as has been previously reported by other investigators.1,5
In addition, we confirm that as the week went on, a significant decrease in BNP concentration occurred, both before and after dialysis sessions. Contrary to other studies, our patients had high serum BNP concentrations insert comma, both at the beginning and at the end of the week, and both before and after the dialysis sessions (long interval: pre-haemodialysis: 1,068 ± 1,031; post-haemodialysis: 612 ± 540pg/ml; and short period: pre-haemodialysis: 770 ± 792pg/ml; posthaemodialysis: 473 ± 460.) These differences could be explained by the fact that the patients included in our study were significantly older on average: 73 ± 11 compared with 64 ± 2 in Sheen’s group or 53 ± 15 in Lee’s group.
The determination of troponin 1 as an indicator of cardiovascular risk did not show any degree of correlation with the serum BNP concentrations for either dialysis interval.
The limitations of our study were the low number of patients, not having classified patients according to the medications they take, lack of patient randomisation when including them in treatment groups and not having measured parameters that estimate hydration status, such as ultrasound measurement of the lower vena cava, for which reason we cannot guarantee that these parameters are the same as others, whether measured or unmeasured. Neither did we evaluate the degree of left ventricular hypertrophy or the systolic function in each patient.
However, despite these limitations, the study shows that the BNP can provide us with additional information regarding the hydration status of the patient undergoing haemodialysis. Patients on daily HD. Patients on daily HD, including one patient with chronic ischaemic heart disease, showed significantly lower BNP levels, which confirms the findings of other studies: that this technique provides better control of volaemia and blood pressure, partial regression of the left ventricular hypertrophy and, in addition, better tolerance of the haemodialysis session.10-12
Table 1.
Figure 1.
Table 2. Comparison of pre- and post- dialysis BNP between groups for both intervals
Table 3.
Table 4.


