La malnutrición es un problema frecuente y un factor de riesgo de mortalidad en pacientes en hemodiálisis. Sin embargo, no existe un consenso para evaluarla. Objetivo: Evaluar la relación entre el estado nutricional medido por bioimpedancia espectroscópica (BIS) y los parámetros analíticos nutricionales, así como la evolución nutricional, valorada como sus modificaciones, en un año. Métodos: Estudio prospectivo observacional de 124 pacientes en hemodiálisis (edad 61,2 [±15,8] años, varones 62,9 %, diabéticos 33,1 %). Los parámetros analíticos nutricionales y la BIS se realizaron basalmente y al año. Resultados: El índice de masa magra (IMM) basal (medio 13,3 ± 3,6 kg/m2) se correlaciona de forma directa con el sexo masculino (p = 0,01) e inversamente con la edad (p = 0,006). Basalmente el índice de masa grasa (IMG) (medio 11,2 ± 6,1 kg/m2) se correlaciona de forma directa con el índice de masa corporal (p < 0,001) y el sexo femenino (p = 0,004). No encontramos asociación con la comorbilidad o los parámetros inflamatorios. No observamos correlación entre las modificaciones de masa magra o masa grasa con las modificaciones de parámetros nutricionales. Los pacientes con ganancia de IMM (> 0 kg/m2) presentan albúmina sérica basal más baja (p = 0,017), menor IMM basal (p < 0,001) y mayor IMG basal (p = 0,027). Los pacientes con pérdida de IMG (< 0 kg/m2) presentan menores cifras de tensión arterial sistólica (p = 0,04). Conclusión: La valoración del estado nutricional mediante parámetros analíticos no presenta una buena relación con los parámetros de composición corporal ni con sus modificaciones.
Malnutrition is a common problem and a risk factor of mortality in haemodialysis patients. However, there is no consensus for its assessment. Objective: To assess the relationship between nutritional status, measured by bioimpedance spectrometry (BIS), and laboratory markers of nutritional status, as well as nutritional evolution and its changes after 1 year. Methods: We performed an observational prospective study on 124 haemodialysis patients (aged 61.2 [±15.8] years, 62.9% were males, 33.1% were diabetic. Laboratory markers of nutritional status and BIS were implemented at baseline and after one year. Results: At baseline, lean mass index (LMI) (13.3 [±3.6] Kg/m2) was inversely correlated with age (P=.006), and directly with male gender (P=.01). At baseline, the fat mass index (FMI) (mean 11.2 ± 6.1kg/m2) correlates directly with the body mass index (P<.001) and the female gender (P=.004). We found no association with comorbidity or inflammatory markers. We did not observe any correlation between lean mass or fat mass modifications and nutritional marker modifications. Patients with LMI gain (>0kg/m2) have lower baseline serum albumin (P=.017), lower baseline LMI (P<.001) and higher baseline FMI (P=.027). Patients with FMI loss (<0kg/m2) have lower systolic blood pressure (P=.04). Conclusions: Assessment of nutritional status through laboratory parameters does not have a good correlation with body composition parameters or with their modifications.
INTRODUCTION
Protein-energy malnutrition is a common problem among patients on haemodialysis (HD),1 and is, along with inflammation, the most potent non-traditional factor of cardiovascular risk in these patients, due to the development of atherosclerosis.2,3 These three symptoms have been referred to as the MIA syndrome (malnutrition-inflammation-atherosclerosis), which is associated with a very high cardiovascular morbidity and mortality in patients on HD.4,5
Although various methods have been proposed to assess nutritional status in HD patients, such as the subjective global assessment,6 the malnutrition-inflammation score,7 anthropometric parameters, laboratory parameters, dual energy X-ray absorptiometry and analysis by bioimpedance spectroscopy (BIS), there is no reference method.8
The use of BIS has extended to dialysis units because it is an objective, safe, cheap and reproducible method of assessing body composition and hydration status.9,10
Laboratory parameters used in clinical routine, such as proteins and lipid profile may be influenced in HD patients by the inflammatory condition. Furthermore, it should be noted that other cardiovascular risk parameters, such as serum cholesterol concentration, homocysteine levels, or body mass index (BMI), experience a reverse epidemiology in patients on HD.11 However, both serum prealbumin levels in early stages of malnutrition and those of albumin (much later) are good nutritional markers.12
Therefore, the main objective of this study is to analyse the relationship between nutritional markers obtained by BIS, anthropometric parameters such as BMI, and routine laboratory parameters. As a secondary objective, we evaluated the nutritional evolution of the cohort after one year of follow-up, assessed by both changes in laboratory parameters such as BMI and those obtained by BIS over a year.
MATERIAL AND METHOD
Patients
An observational retrospective study to assess the nutritional status of 124 patients on HD with end-stage chronic kidney disease.
Inclusion criteria for all patients were: HD treatment for at least the previous 6 months, 3 times a week, for at least 4 hours per session, with the dialysis dose being mediated by ionic conductivity Kt/V>1.5, and with an age between 18-80 years. All patients were dialysed with highly permeable biocompatible membranes, 65% of them with on-line haemodiafiltration techniques. We excluded patients with acute pathologies and those who required hospitalisation in the previous 3 months. Demographic and anthropometric parameters were collected, along with cardiovascular disease history: age, sex or history of diabetes mellitus type 2. Comorbidity was calculated using the Charlson index.13 Malnutrition criteria were defined according to the Nutrition Guidelines proposed by Fouque et al.1
In all patients, multifrequency BIS was carried out using the BCM® system (Fresenius Medical Care). The baseline measurement was taken between May 2009 and June 2010, and the measurement after the year of follow-up between May 2010 and June 2011. The measurement was taken midweek prior to the HD session, after the patient had spent at least 10 minutes in the supine position, with 4 conventional electrodes being placed 2 by 2 in the hands and feet contralateral to the vascular access. The lean mass index (LMI) and fat mass index (FMI) were calculated by the system software. Blood pressure measurement was taken before performing BIS.
The laboratory measurements were taken prior to the HD session, after the long interval. We determined levels of serum creatinine, urea, complete lipid profile (triglycerides [TG], total cholesterol, LDL cholesterol and HDL cholesterol), inflammatory markers (C-reactive protein [CRP], erythrocyte sedimentation rate, ferritin, fibrinogen and prealbumin) and nutritional markers (total proteins, albumin and prealbumin). All laboratory measurements were taken using automated and standardised methods.
Both BIS and the laboratory measurement of nutritional parameters were performed at baseline and after one year of follow-up. Depending on the modifications detected by BIS during the year of follow-up, patients were classified according to gain (>0kg/m2) or loss (≤0kg/m2) of LMI or FMI.
Lastly, the year follow-up was completed by 80 patients; the causes of loss to follow-up were: death (n=16), transplantation (n=10), transfer to peritoneal dialysis (n=2), transfer to home HD (n=2), change of dialysis centre (n=3), acute intercurrent process (n=5) and other causes (n=9).
Statistical analysis
Continuous variables are expressed as mean ± standard deviation. Categorical variables are expressed as percentages and compared using the χ2 test. Continuous variables were compared using the Student’s t-test for independent samples after verifying the normality of distribution using the Kolmogorov-Smirnov test or by analysis of variance (ANOVA) when comparing more groups. We performed a univariate correlation analysis using a simple linear correlation, except for categorical variables, in which we used the χ2 test. We performed a multivariate regression analysis (multivariate linear regression) to analyse the variables associated with lower baseline levels of LMI and FMI, introducing significant variables in the univariate analysis. For statistical calculations, we used SPSS software for Windows, V 16 (SPSS®, Chicago, IL). A value of P<.05 was considered statistically significant.
RESULTS
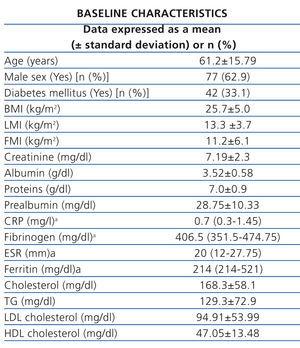
The clinical characteristics and baseline analysis of the study population are shown in Table 1. The mean comorbidity index was 5.46±2.66 points. The most frequent aetiology of chronic kidney disease (CKD) was glomerular (27.4%), followed by unknown origin (19.3%) and diabetes mellitus (17.7%). The mean dialysis dose calculated by ionic conductivity Kt/V was 1.75±1.31.
Using malnutrition criteria1: 71.9% had serum albumin <3.8g/dl, 64.6% had prealbumin <30mg/dl and only 3.4% had total cholesterol <100mg/dl. 30.6% of patients had a BMI <23.0kg/m2.
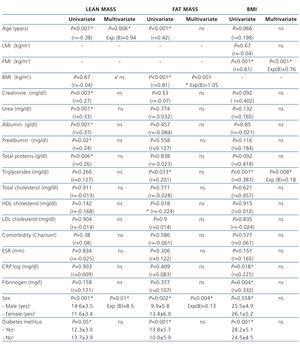
In the simple linear correlation analysis, the baseline LMI (mean 13.3±3.6kg/m2) is directly associated with serum creatinine, urea, albumin, prealbumin and total protein, and inversely with age. Females and diabetic patients had a significantly lower LMI. In multivariate analysis, LMI only maintains a significant inverse correlation with age and directly with males. We found no association with comorbidity, inflammatory markers or lipid profile (Table 2).
At baseline, in the univariate regression analysis, the FMI (mean 11.2±6.1kg/m2) is directly related to age, BMI, triglycerides, the female sex and diabetes, and inversely to HDL cholesterol, without the associated comorbidity or inflammatory markers or other parameters of the lipid profile. Multivariate analysis shows that the FMI is associated directly with the BMI and females. Diabetic patients have a higher FMI and a lower LMI. The BMI correlates well in multivariate analysis with FMI and TG levels (Table 2).
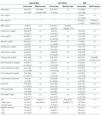
We divided patients according to lean mass and fat mass gain (>0kg/m2) or loss (<0kg/m2) after one year. Patients with lean mass gain (mean 2.33±2.0kg/m2) have lower baseline serum albumin and LMI and higher baseline FMI (Table 3). Patients with FMI gain (mean 2.76±2.01kg/m2) have higher systolic blood pressure levels (Table 4).
In addition, we studied the changes in laboratory parameters (albumin, total proteins, prealbumin, creatinine, urea, cholesterol, TG, CRP) as well as increases or decreases in them, without observing significant correlations with these parameters or with the parameters obtained by BIS (both static and dynamic).
DISCUSSION
In this study, we have demonstrated a weak correlation between the laboratory parameters used routinely to assess nutritional status, levels of both lean mass and fat mass obtained by BIS, and anthropometric parameters such as BMI. The modifications over a year of follow-up in body composition parameters (gain or loss of lean mass or fat mass) do not correlate with modifications in laboratory parameters. The lack of relationship found makes us consider that we may be assessing different parameters with different forms of measurement.
Despite the devastating impact of malnutrition on morbidity and mortality in patients with CKD, there is currently no reference standard for assessing it. Furthermore, a wide range of results are obtained, as our results demonstrate. Therefore, some authors propose the use of a generalised scale that includes at least two positive malnutrition markers (laboratory, bioimpedance and BMI).14
The BIS allows an approximation to the nutritional and hydration status, allowing the volume of ultrafiltration to be adjusted and muscular mass or lean mass to be known. In recent years, lean mass and its changes have been linked in major studies with the survival of patients on HD,15 but controlled clinical assays are necessary to demonstrate such associations.
BMI remains the nutritional anthropometric marker of reference accepted by the World Health Organization. However, its reverse epidemiology association in terms of mortality11 for HD patients makes its applicability ambiguous. While in our study, BMI shows a good relationship with fat mass, in previous studies in CKD patients not on dialysis, BMI has low specificity in assessing body fat mass content.15 This, in addition to the fact that BMI has no association with lean mass, suggests that this parameter should not be used in isolation in the assessment of nutritional status.
The relationship observed in our study between BMI and fat mass may be especially useful in patients on HD, as the body weight gains are usually at the expense of fat mass. Therefore, variations in BMI should be studied early with BIS to detect changes in fat mass, which would allow changes in lifestyle to be introduced. Although clinical trials are necessary, monitoring changes in lean mass may improve the prognosis of patients on HD.11
The lack of correlation between serum levels of cholesterol and other lipid parameters with body composition parameters, especially fat mass and BMI, suggests that each parameter probably assesses different factors.
The inflammatory condition is closely related to morbidity and mortality,7 and in turn, to malnutrition. However, inflammatory markers recorded in our study did not correlate with body composition parameters, and only CRP and fibrinogen directly correlated with BMI. This association between CRP and BMI has previously been described,16 with the suggestion that BMI may not be an appropriate parameter for assessing the protein-energy malnutrition syndrome.
The relationship observed in the univariate analysis of FMI loss with lower systolic blood pressure figures is probably due to error or bias, consistent with its lack of significance in the multivariate analysis.
The lack of relationship between changes in nutritional markers by BIS and the laboratory parameters and its changes is very significant, especially the lack of association between changes in lean mass and albumin levels, protein and prealbumin, and changes during one year. All this again suggests that each parameter probably assesses different factors.
Among the limitations of this study, we note that it is retrospective, with a small number of patients, without regard to admissions, and without assessment of the impact of the dialysis technique or their doses,17 although all patients had an adequate dialysis dose.
In conclusion, there is not a good correlation between routine laboratory parameters, the parameters obtained by BIS to assess nutritional status and BMI. Neither is there any correlation between the changes in body composition and changes in anthropometric and laboratory parameters. The lack of relationship found suggests to us that we may be assessing different parameters with different forms of measurement. Nutritional assessment should be performed globally by scales that combine different measurements, using the changes in these parameters in a dynamic way. We require a consensus on what measurements to take and on the basis of these measurements, construct scales that allow stratification of patients according to nutritional status.
Conflicts of interest
The authors declare that they have no conflicts of interest related to the contents of this article.
Table 1. Baseline characteristics of the study population
Table 2. Correlation between lean mass index, fat mass index and body mass index and the variables studied
Table 3. Characteristics of patients according to the modifications in lean mass over a year
Table 4. Characteristics of patients according to the modifications in fat mass over a year


