The improvement of kidney allograft recipient and graft survival showed a decrease over the last 40 years. Long-term graft loss rate remained stable during a 25-year time span. Knowing the changing causes and the risk factors associated with graft loss requires special attention.
The present study aimed to assess the causes of graft loss and kidney allograft recipient death. Also, we aimed to compare two different periods (1979−1999 and 2000−2019) to identify changes in the characteristics of the failed allografts and recipient and donors profile.
Methods and patientsWe performed a single-center cohort study. We included all the kidney transplant recipients at the Hospital del Mar (Barcelona) between May 1979 and December 2019. Graft loss was defined as recipient death with functioning graft and as loss of graft function (return to dialysis or retransplantation). We assessed the causes of graft loss using clinical and histological information. We also analyzed the results of the two different transplant periods (1979−1999 and 2000−2019).
ResultsBetween 1979 and 2019, 1522 transplants were performed. The median follow-up time was 56 (IQR 8–123) months. During follow-up, 722 (47.5%) grafts were lost: 483 (66.9%) due to graft failure and 239 (33.1%) due to death with functioning graft. The main causes of death were cardiovascular (25.1%), neoplasms (25.1%), and infectious diseases (21.8%). These causes were stable between the two periods of time. Only the unknown cause of death has decreased in the last period.
The main cause of graft failure (loss of graft function) was the allograft chronic dysfunction (75%). When histologic information was available, antibody-mediated rejection (ABMR) and interstitial fibrosis/tubular atrophy (IF/TA) were the most frequent specific causes (15.9% and 12.6%). Of the graft failures, 213 (29.5%) were early (<1 year of transplantation). Vascular thrombosis was the main cause of early graft failure in the second period (2000−2019) (46.7%) and T-cell-mediated rejection (TCMR) was the main cause (31.3%) in the first period (1979−1999). The causes of late graft loss were similar between the two periods.
ConclusionsThe causes of kidney allograft recipient death are still due to cardiovascular and malignant diseases. Vascular thrombosis has emerged as a frequent cause of early graft loss in the most recent years. The evaluation of the causes of graft loss is necessary to improve kidney transplantation outcomes.
La mejoría en la supervivencia del receptor y del injerto renal sufre un proceso de deceleración. La tasa de pérdida de injerto a medio y largo plazo permanece estable desde hace 25 años. Es fundamental conocer las causas de pérdida de injerto y los factores relacionados, así como identificar si se han producido cambios en las causas de pérdida del injerto en los últimos años.
El objetivo del presente estudio fue evaluar las causas de pérdida de injerto según fallecimiento del receptor o pérdida de injerto con vuelta a diálisis/retrasplante, y analizar las causas específicas de pérdida de injerto en dos épocas (1979−1999 y 2000−2019) para identificar cambios en el perfil de injertos perdidos.
Pacientes y métodosEstudio retrospectivo de todos los trasplantes renales (TR) realizados en el Hospital del Mar (Barcelona) entre mayo-1979 y diciembre-2019. Consideramos pérdida del injerto el fallecimiento del paciente con injerto funcionante o el re-inicio de diálisis o retrasplante. Revisamos las causas de pérdida mediante información clínica e histológica y analizamos los resultados en dos periodos (1979−1999 y 2000−2019).
ResultadosDe los 1522 TR realizados, 722 (47.5%) perdieron el injerto renal con una mediana de seguimiento hasta la pérdida de 56 (RIQ 8–123) meses. De estas pérdidas, 483 (66.9%) se produjeron por fracaso del injerto y 239 (33.1%) por fallecimiento del receptor con injerto funcionante. Las causas de fallecimiento fueron las cardiovasculares (25.1%), neoplasias (25.1%) e infecciones (21.8%), de forma similar en ambas épocas de trasplante. Solo el éxitus de causa desconocida ha disminuido en la época más reciente.
La principal causa de vuelta a diálisis/retrasplante fue la disfunción del injerto (75%), siendo el rechazo mediado por anticuerpos y la fibrosis intersticial/atrofia tubular los hallazgos histológicos más frecuentes (15.9% y 12.6%). Del total de pérdidas, 213 fueron precoces (29.5%). La trombosis vascular fue la causa más frecuente de pérdida precoz (<1 año posTR) entre 2000 y 2019 (46.7%), mientras que en el periodo 1979-1999 lo fue el rechazo celular (31.3%). Las causas de pérdida de injerto tardías fueron similares en ambas épocas.
ConclusionesLos pacientes fallecen de causas cardiovasculares y neoplasias, y esto no ha cambiado con los años. La trombosis vascular emerge como causa frecuente de pérdida precoz del injerto en la época actual. La identificación adecuada de las causas de pérdida de injerto es fundamental para mejorar los resultados postrasplante.
Key concepts
- •
The causes of graft loss beyond the first post-transplant year and the causes of death of renal transplant recipients have not changed in the last 40 years.
- •
Vascular thrombosis emerges as a frequent cause of early graft loss. However, graft loss due to acute T-cell mediated rejection is rare in the more recent era compared to the early stages of the transplant program.
- •
Over the last 20 years, graft survival has improved with a lower rate of graft loss during the first year post-transplantation. Graft loss rates remain stable from the first year post-transplantation.
Renal transplantation (RT) is the renal replacement therapy (RRT) of choice for patients with advanced chronic kidney disease (CKD) because it improves morbidity and mortality.1–4 Advances in immunosuppression, surgical techniques and knowledge of transplant immunology have improved patient and graft survival rates in the short term.5 The probability of all-cause graft loss in the first year post-transplant has decreased from 13.9% in 1997 to 6.7% in 2017.6
However, more than 50% of renal grafts are lost after 10 years, and graft loss rates beyond the first year have remained stable over the past 25 years, with the annual loss rate being 3−5% for renal transplants from optimal deceased donors and 2–3% for living donor.5 American and European registries show an improvement in short- and long-term survival until 2000. But in recent decades, the improvement in survival has slowed down.7–9 Some studies attribute this to a global problem due to the lack of innovation, both in the field of immunosuppression and in the integral management of the transplanted patient8; others point to a change in the characteristics of donors and patients on waiting lists with less restrictive criteria as being responsible for early graft loss or premature death of the patient.9 Healthcare workers need strategies to improve the results in renal transplant and, to this end, it is essential to identify the causes of graft loss and death of the recipient. Poor knowledge or misinterpretation of these causes is a major barrier to improving short- and long-term graft and recipient survival.
The aim of our study was to identify the causes of graft loss contributing to death of the recipient with a functioning graft or loss of renal function with return to dialysis or retransplantation. In addition, we wanted to analyze the different causes of graft loss by comparing two transplantation periods (1979−1999 and 2000−2019) to identify whether there have been changes in the profile of losses between the two periods.
Material and methodsStudy populationThe study included all renal transplant patients at the Hospital del Mar (Barcelona) from May 1979 to December 2019. Follow-up was performed until graft loss due to patient death or return to RRT (dialysis or retransplantation) or until the end of follow-up on December 31, 2020. All transplantations were performed with negative cytotoxicity crossmatch.
All clinical and research activities included in the present work were carried out in accordance with the principles of the Helsinki and Istanbul Declarations.
Histological study of renal graft biopsiesInformation from all renal graft biopsies (RB) performed in this cohort of patients during follow-up was included. Biopsies were performed according to clinical indication: significant proteinuria, renal function deterioration or detection of donor-specific HLA antibodies (DSA). Since 2014, we have had iterative follow-up RBs at 1, 3 and 5 years post-transplantation. Biopsies were reviewed independently by a pathologist and a nephrologist. The diagnosis of all renal biopsies was performed according to the Banff 2017 classification.10
Post-transplant anti-HLA antibody studyAnti-HLA antibody screening was performed on the Luminex platform® (Lifecodes LifeScreen Deluxe assay. Immucor Lifecodes Transplant Diagnostics, Nijlen, Belgium). When anti-HLA antibody screening was positive, HLA IgG antibody identification was performed using Lifecodes® LSA class I and/or class II according to the manufacturer's instructions. Analysis was performed with MatchIT® software and the result was considered positive with MFI > 1,000.
The specificity of the anti-HLA antibodies was attributed considering HLA-A, HLA-B, HLA-C, DRB1* and DQB1*. When donor HLA-C or DQB1* typing was not available, anti-HLA antibodies against the donor were assigned considering linkage disequilibrium.
Evaluation of the causes of graft lossGraft loss was defined as the absence of renal function occurring at any time during post-transplant follow-up due to patient death or irreversible graft damage requiring return to dialysis or retransplantation. The causes of graft loss were classified into 2 groups1: death of the patient with functioning graft2 and loss of graft function.
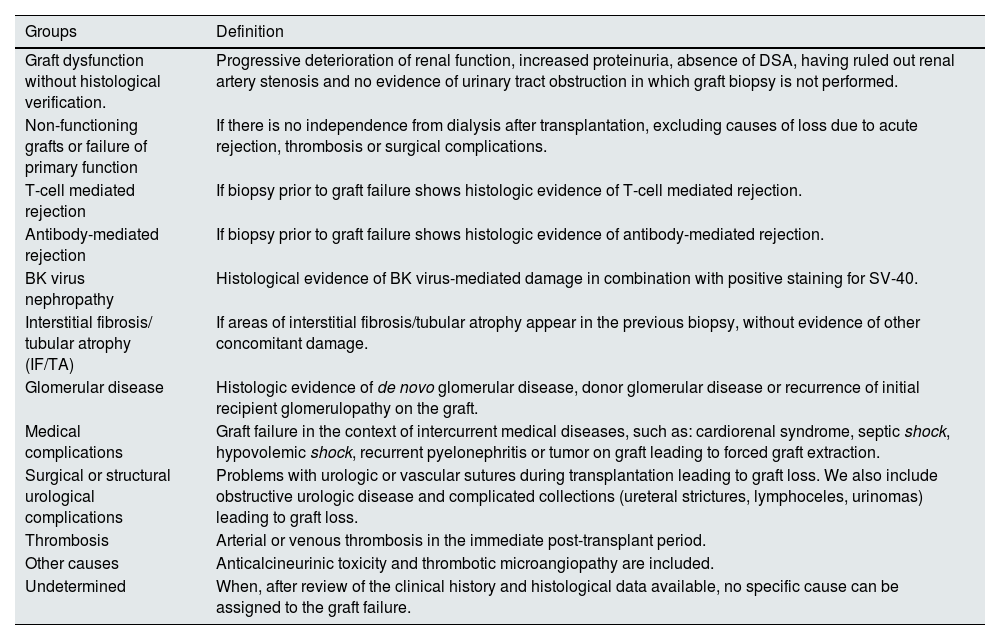
The cause of graft loss was established after an exhaustive review of the patient's clinical history. The causes of graft failure were classified into 11 groups based on clinical and histological information (Table 1). In some cases, several pathologic processes could have contributed to graft failure. These cases were classified into a single group based on the clinical judgment of the investigators, and according to the most relevant diagnosis.
Classification of causes of graft loss.
| Groups | Definition |
|---|---|
| Graft dysfunction without histological verification. | Progressive deterioration of renal function, increased proteinuria, absence of DSA, having ruled out renal artery stenosis and no evidence of urinary tract obstruction in which graft biopsy is not performed. |
| Non-functioning grafts or failure of primary function | If there is no independence from dialysis after transplantation, excluding causes of loss due to acute rejection, thrombosis or surgical complications. |
| T-cell mediated rejection | If biopsy prior to graft failure shows histologic evidence of T-cell mediated rejection. |
| Antibody-mediated rejection | If biopsy prior to graft failure shows histologic evidence of antibody-mediated rejection. |
| BK virus nephropathy | Histological evidence of BK virus-mediated damage in combination with positive staining for SV-40. |
| Interstitial fibrosis/ tubular atrophy (IF/TA) | If areas of interstitial fibrosis/tubular atrophy appear in the previous biopsy, without evidence of other concomitant damage. |
| Glomerular disease | Histologic evidence of de novo glomerular disease, donor glomerular disease or recurrence of initial recipient glomerulopathy on the graft. |
| Medical complications | Graft failure in the context of intercurrent medical diseases, such as: cardiorenal syndrome, septic shock, hypovolemic shock, recurrent pyelonephritis or tumor on graft leading to forced graft extraction. |
| Surgical or structural urological complications | Problems with urologic or vascular sutures during transplantation leading to graft loss. We also include obstructive urologic disease and complicated collections (ureteral strictures, lymphoceles, urinomas) leading to graft loss. |
| Thrombosis | Arterial or venous thrombosis in the immediate post-transplant period. |
| Other causes | Anticalcineurinic toxicity and thrombotic microangiopathy are included. |
| Undetermined | When, after review of the clinical history and histological data available, no specific cause can be assigned to the graft failure. |
The causes of graft loss were analyzed according to two transplantation periods: period 1 (from 1979–1999) and period 2 (from 2000–2019).
Statistical analysisVariables with a normal distribution were expressed as mean ± standard deviation (SD) and variables with a non-normal distribution with median and interquartile range (IQR). In the comparative analysis of the characteristics between groups, the Chi-square or Fisher's exact test was applied to analyze categorical variables. The Student t test was used for continuous variables with normal distribution and the Mann–Whitney U test for nonparametric continuous variables. ANOVA was performed for comparisons of more than 2 groups.
Graft and patient survival were estimated using Kaplan–Meier curves with the log-rank test. Time to graft loss accounting for death was considered from the date of transplantation to the start of dialysis or retransplantation. Logistic regression was performed for univariate and multivariate analysis of factors associated with graft loss due to thrombosis. For the study of factors associated with graft loss, the hazard ratio (HR) with 95% confidence interval (95% CI) was calculated using Cox regression. The analysis of attrition rates was performed by calculating the absolute rate of loss corrected for the amplitude of the period.7,11
Statistical analysis was performed using the SPSS package® version 25 (IBM). Values of p < 0.05 were considered statistically significant.
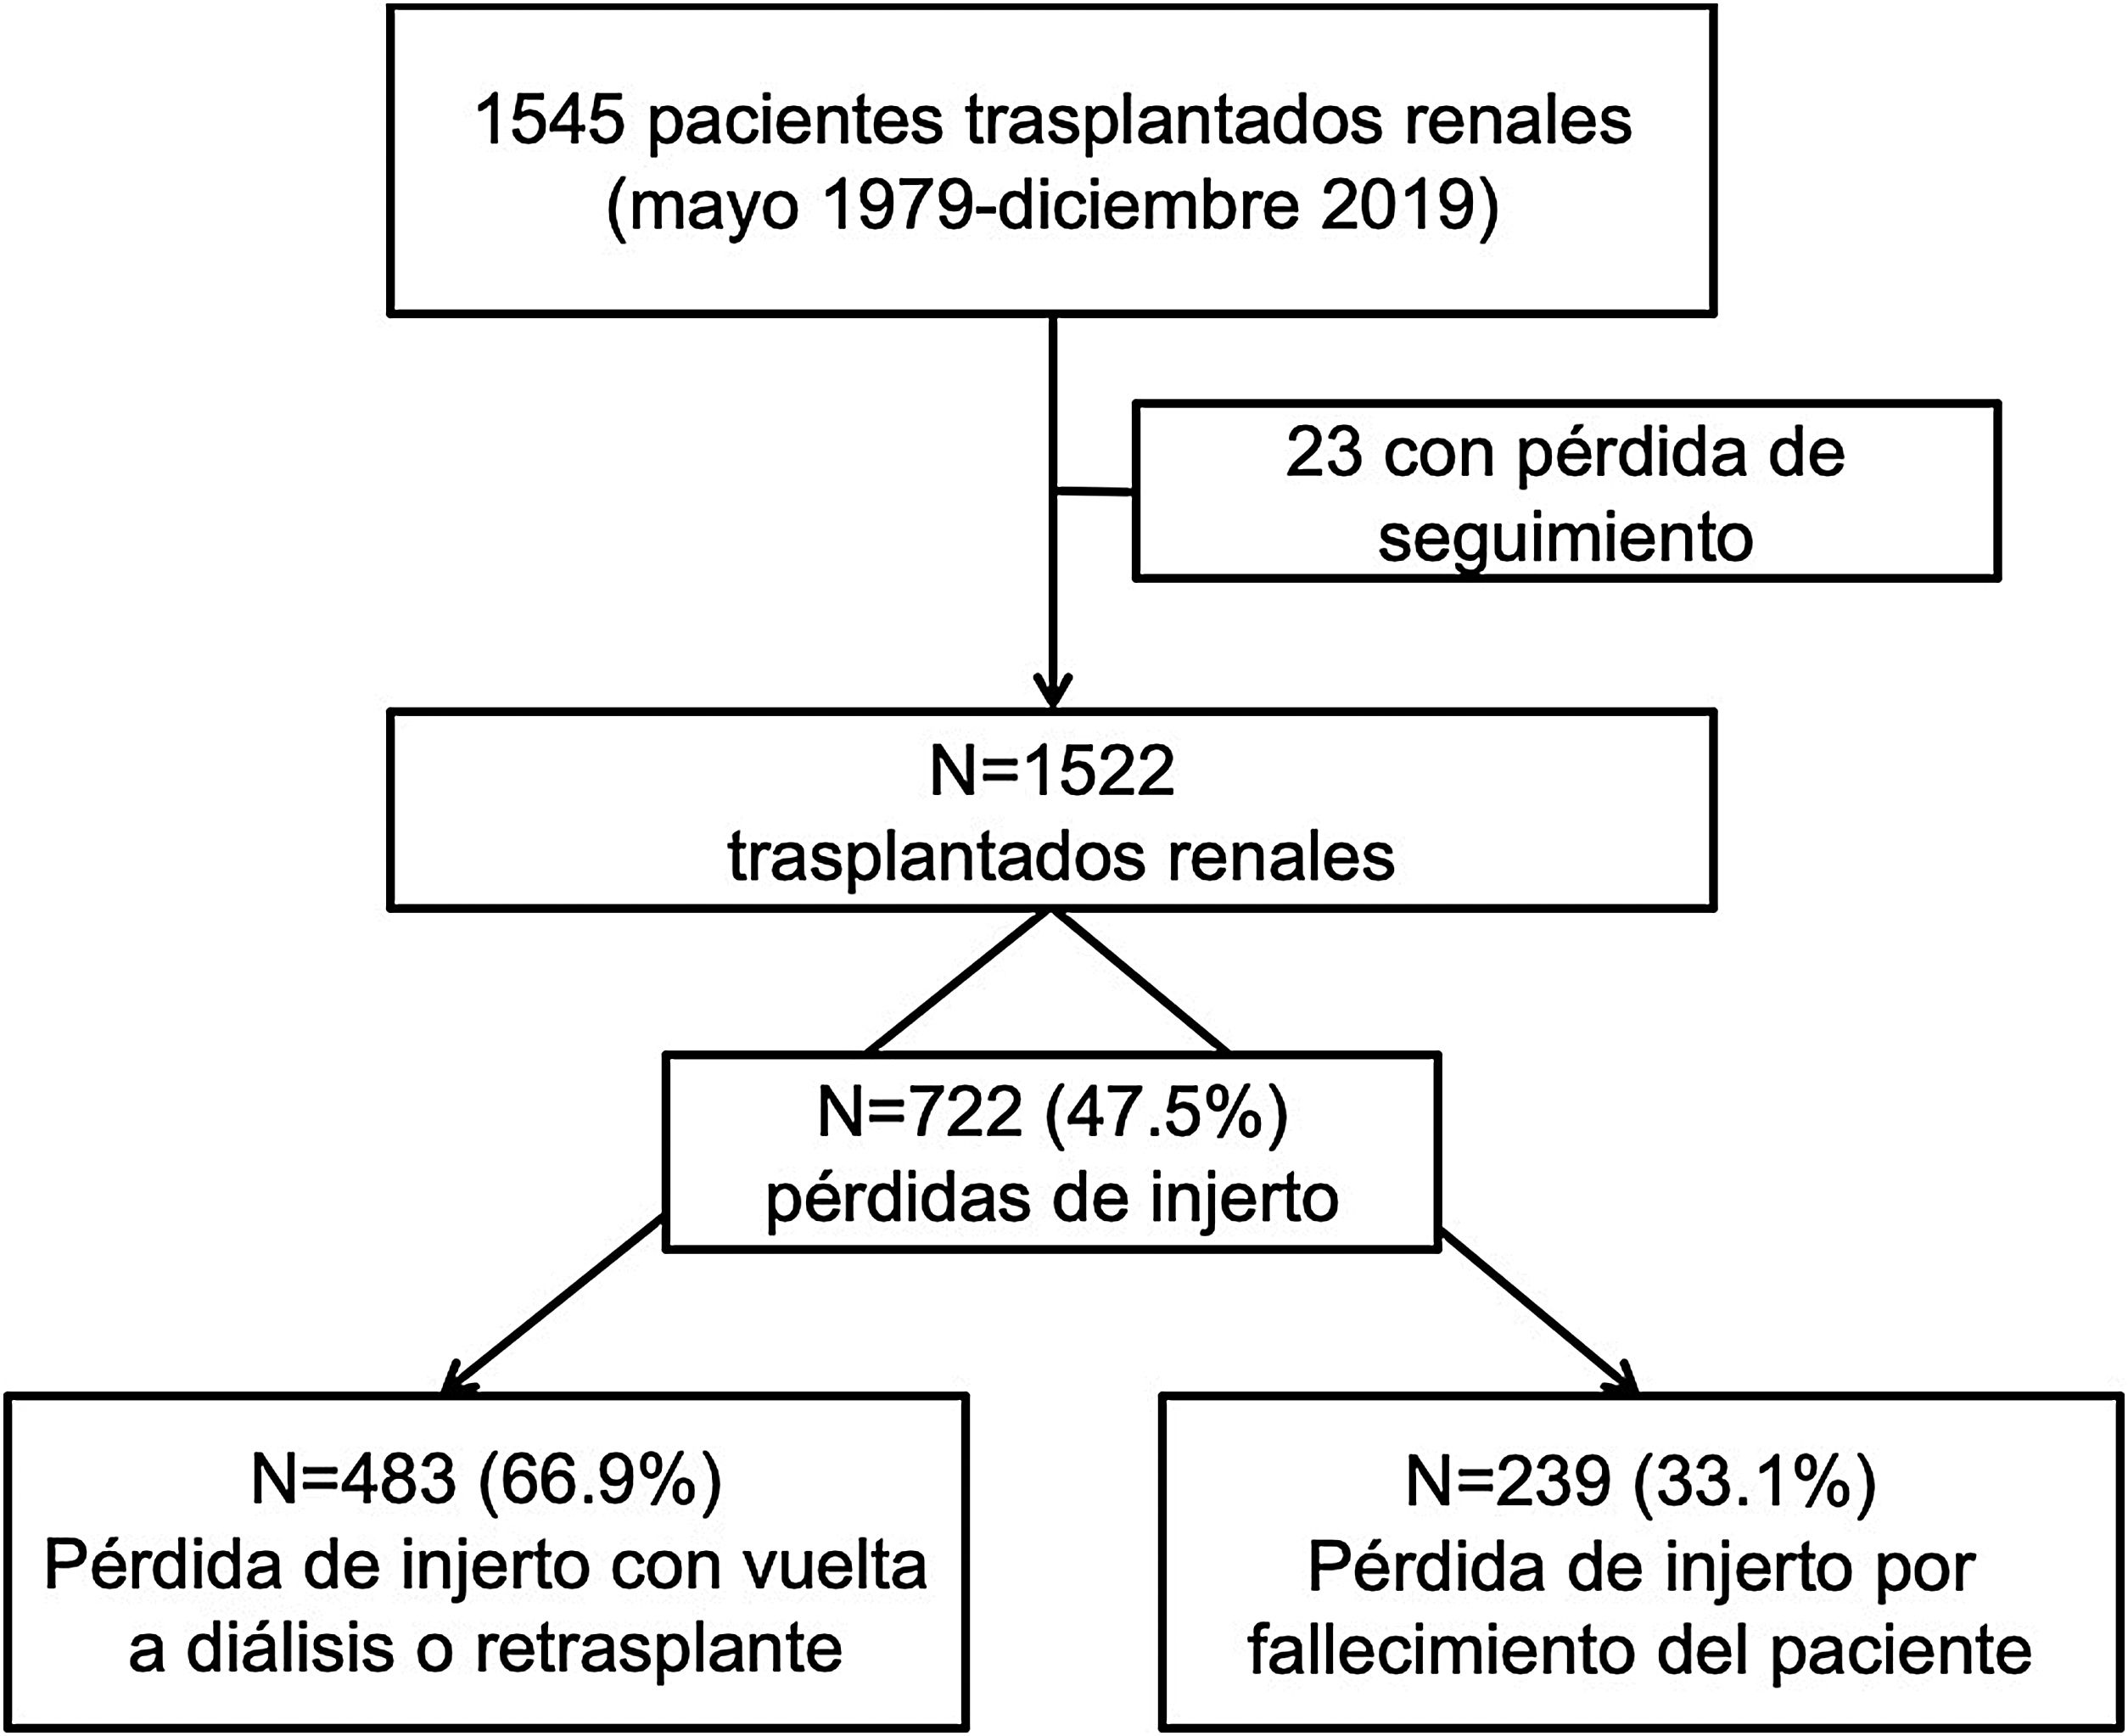
ResultsCharacteristics of the populationBetween 1979 and 2019, 1,522 renal transplantations were performed. With a median follow-up of 63 (RIQ: 26–122) months, we observed 722 losses (47.4%).
In 239 (33.1%) the loss was due to death of the recipient with a functioning graft and in 483 (66.9%) due to loss of renal function with return to dialysis or re-transplantation (Fig. 1).

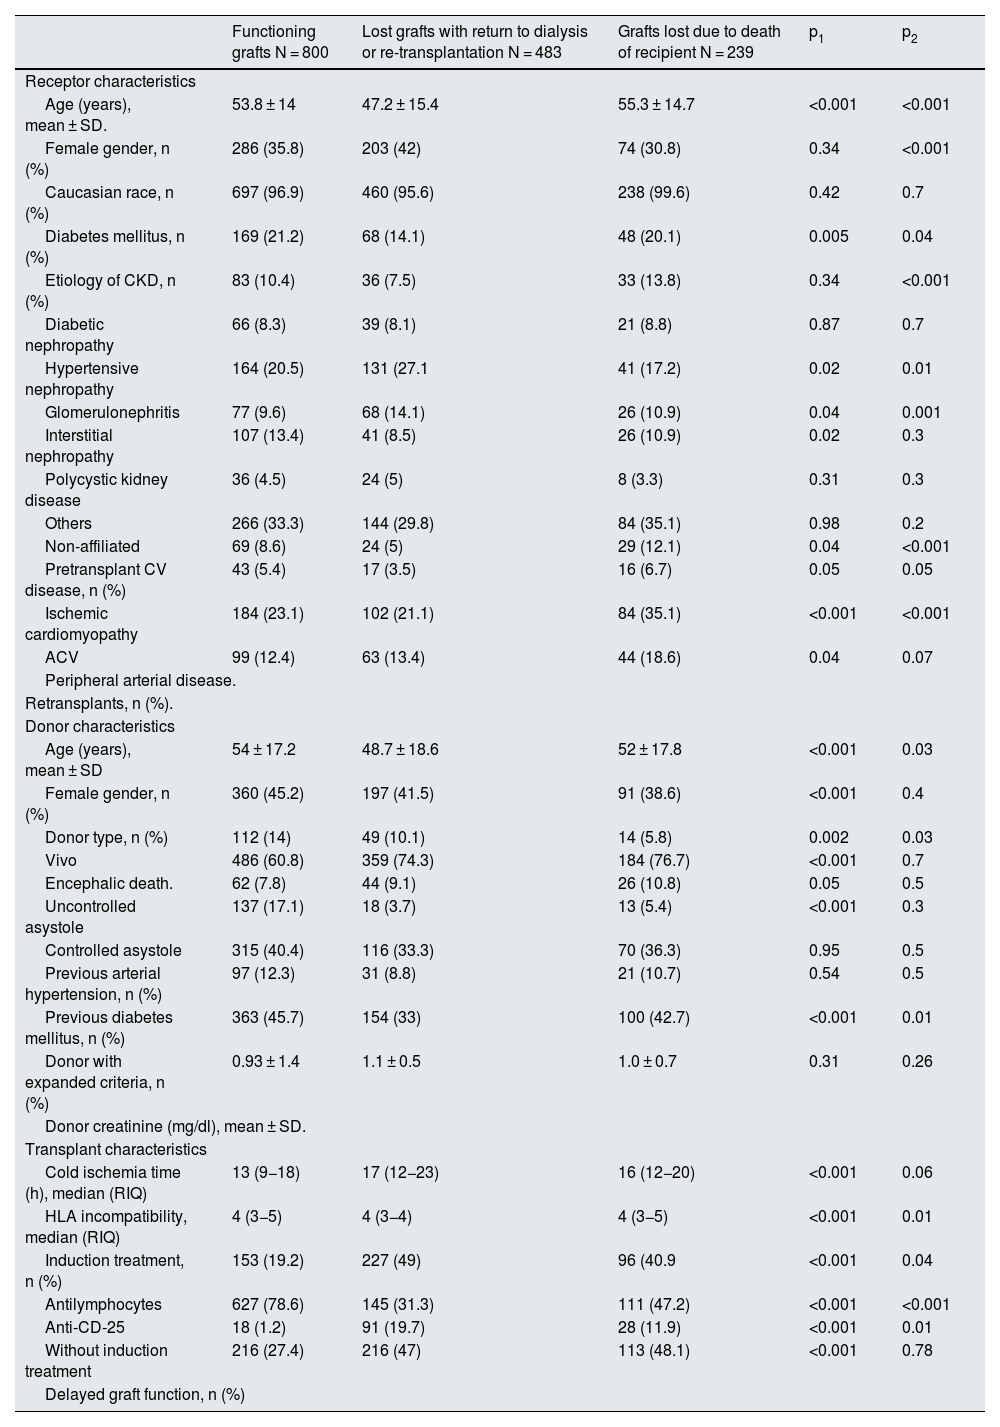
The baseline demographic and clinical characteristics of the study population are shown in Table 2.
Baseline characteristics of the study population according to graft loss.
| Functioning grafts N = 800 | Lost grafts with return to dialysis or re-transplantation N = 483 | Grafts lost due to death of recipient N = 239 | p1 | p2 | |
|---|---|---|---|---|---|
| Receptor characteristics | |||||
| Age (years), mean ± SD. | 53.8 ± 14 | 47.2 ± 15.4 | 55.3 ± 14.7 | <0.001 | <0.001 |
| Female gender, n (%) | 286 (35.8) | 203 (42) | 74 (30.8) | 0.34 | <0.001 |
| Caucasian race, n (%) | 697 (96.9) | 460 (95.6) | 238 (99.6) | 0.42 | 0.7 |
| Diabetes mellitus, n (%) | 169 (21.2) | 68 (14.1) | 48 (20.1) | 0.005 | 0.04 |
| Etiology of CKD, n (%) | 83 (10.4) | 36 (7.5) | 33 (13.8) | 0.34 | <0.001 |
| Diabetic nephropathy | 66 (8.3) | 39 (8.1) | 21 (8.8) | 0.87 | 0.7 |
| Hypertensive nephropathy | 164 (20.5) | 131 (27.1 | 41 (17.2) | 0.02 | 0.01 |
| Glomerulonephritis | 77 (9.6) | 68 (14.1) | 26 (10.9) | 0.04 | 0.001 |
| Interstitial nephropathy | 107 (13.4) | 41 (8.5) | 26 (10.9) | 0.02 | 0.3 |
| Polycystic kidney disease | 36 (4.5) | 24 (5) | 8 (3.3) | 0.31 | 0.3 |
| Others | 266 (33.3) | 144 (29.8) | 84 (35.1) | 0.98 | 0.2 |
| Non-affiliated | 69 (8.6) | 24 (5) | 29 (12.1) | 0.04 | <0.001 |
| Pretransplant CV disease, n (%) | 43 (5.4) | 17 (3.5) | 16 (6.7) | 0.05 | 0.05 |
| Ischemic cardiomyopathy | 184 (23.1) | 102 (21.1) | 84 (35.1) | <0.001 | <0.001 |
| ACV | 99 (12.4) | 63 (13.4) | 44 (18.6) | 0.04 | 0.07 |
| Peripheral arterial disease. | |||||
| Retransplants, n (%). | |||||
| Donor characteristics | |||||
| Age (years), mean ± SD | 54 ± 17.2 | 48.7 ± 18.6 | 52 ± 17.8 | <0.001 | 0.03 |
| Female gender, n (%) | 360 (45.2) | 197 (41.5) | 91 (38.6) | <0.001 | 0.4 |
| Donor type, n (%) | 112 (14) | 49 (10.1) | 14 (5.8) | 0.002 | 0.03 |
| Vivo | 486 (60.8) | 359 (74.3) | 184 (76.7) | <0.001 | 0.7 |
| Encephalic death. | 62 (7.8) | 44 (9.1) | 26 (10.8) | 0.05 | 0.5 |
| Uncontrolled asystole | 137 (17.1) | 18 (3.7) | 13 (5.4) | <0.001 | 0.3 |
| Controlled asystole | 315 (40.4) | 116 (33.3) | 70 (36.3) | 0.95 | 0.5 |
| Previous arterial hypertension, n (%) | 97 (12.3) | 31 (8.8) | 21 (10.7) | 0.54 | 0.5 |
| Previous diabetes mellitus, n (%) | 363 (45.7) | 154 (33) | 100 (42.7) | <0.001 | 0.01 |
| Donor with expanded criteria, n (%) | 0.93 ± 1.4 | 1.1 ± 0.5 | 1.0 ± 0.7 | 0.31 | 0.26 |
| Donor creatinine (mg/dl), mean ± SD. | |||||
| Transplant characteristics | |||||
| Cold ischemia time (h), median (RIQ) | 13 (9−18) | 17 (12−23) | 16 (12−20) | <0.001 | 0.06 |
| HLA incompatibility, median (RIQ) | 4 (3−5) | 4 (3−4) | 4 (3−5) | <0.001 | 0.01 |
| Induction treatment, n (%) | 153 (19.2) | 227 (49) | 96 (40.9 | <0.001 | 0.04 |
| Antilymphocytes | 627 (78.6) | 145 (31.3) | 111 (47.2) | <0.001 | <0.001 |
| Anti-CD-25 | 18 (1.2) | 91 (19.7) | 28 (11.9) | <0.001 | 0.01 |
| Without induction treatment | 216 (27.4) | 216 (47) | 113 (48.1) | <0.001 | 0.78 |
| Delayed graft function, n (%) | |||||
CKD, chronic kidney disease; CKD, chronic kidney disease; CV, cardiovascular; CV, cardiovascular; CVR, interquartile range; SD, standard deviation; h, hours; IQR, interquartile range.
P1: comparison between recipients with functioning and non-functioning graft (lost due to graft failure and recipient death).
P2: comparison between recipients with graft lost due to graft failure with return to dialysis/retransplantation and due to death of the recipient.
Death of the recipient with a functioning graft was the cause of loss in 239 of the 722 (33.1%) grafts lost. The median period of time elapsed until death was 67.5 (RIQ: 35–122) months after transplantation.
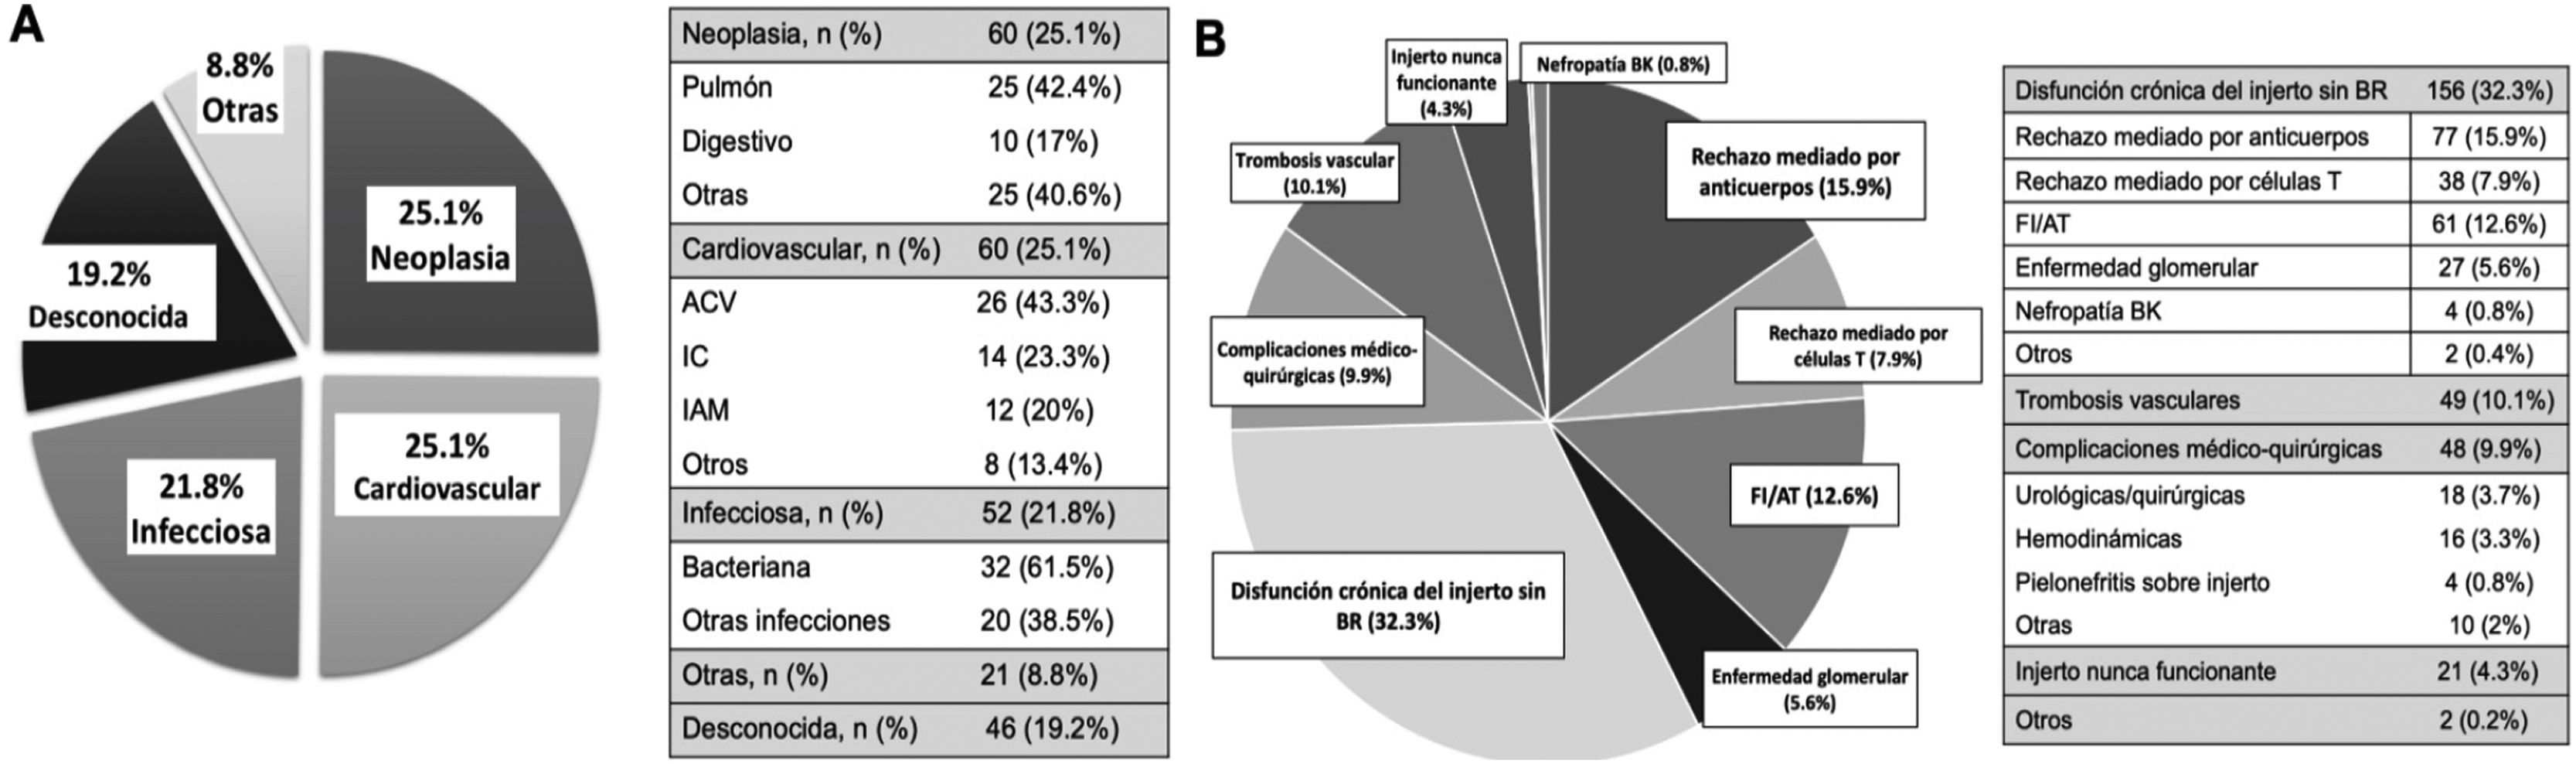
Overall, cardiovascular disease (CVD) (25.1%) and neoplasms (25.1%) were the most frequent causes of death, followed by infectious causes, which accounted for 21.8% of deaths. The cause of death could not be determined in 19.2% of cases (Fig. 2A).
 Causes of loss due to death of the recipient with functioning graft. (B) Causes of graft failure with return to dialysis or re-transplantation.")
The mean age at death was 62.3 ± 13.8 years. No differences were found in the ages of recipients at death according to causes of death (CVD: 64.5 ± 15.9 years; neoplastic: 62 ± 13.5; infections: 62.5 ± 12.3; p = 0.52).
Graft failure with return to dialysis or retransplantationGraft failure that required initiation of RRT was the leading cause of graft loss (66.9%) with an overall median time to failure of 52 (RIQ: 43–61) months posttransplant. The median time to early loss (before 1st year post-transplant) was 1 (IQR: 0–3) month and to late loss (more than 1 year post-transplant) was 89 (IQR: 51–153) months.
Patients in whom the graft failed were younger than those who lost the graft due to death (47.2 vs. 55.3 years; p < 0.01). Moreover, in the former group, there were more women (42 vs. 30.8%; p < 0.01) and patients had fewer comorbidities: diabetes mellitus (DM) (14.1 vs. 20.1%; p = 0.04), ischemic heart disease (5 vs. 12.1%; p < 0.01), cerebrovascular accident (CVA) (3.5 vs. 6.7%; p = 0.05) and peripheral artery disease (PA) (21.1 vs. 35.1%; p < 0.01).
Regarding donor characteristics, grafts lost due to donor failure were from younger donors than those lost due to recipient death (48.7 vs. 52 years; p = 0.03). Grafts from donors with expanded criteria were more frequently lost due to recipient death (42.7 vs. 33%; p < 0.01). Cold ischemia time (CIT) was slightly longer in grafts lost due to graft failure relative to those lost due to death (17 vs. 16 h; p = 0.06) (Table 2).
During follow-up, 483 grafts failed, requiring a return to dialysis or re-transplantation. The most frequent cause of graft loss was chronic graft dysfunction without histological study (32.3%), followed by antibody-mediated rejection (15.9%) and IF/AT (12.6%). Losses due to T-cell-mediated rejection and glomerular disease (recurrence/de novo) were 7.9% and 5.6%, respectively. Vascular thrombosis accounted for 10.1% of losses, followed by medical-surgical complications (9.9%) and never functioning grafts (4.3%) (Fig. 2B).
Analysis by transplanting periodDuring period 1 (years 1979–1999) and period 2 (years 2000–2019), 445 (29.2%) and 1,077 (70.8%) transplants were performed, respectively.
Of the transplants in period 1, 399 (89.7%) were lost. Of the total losses in that group, 300 (75.2%) were due to graft failure with return to dialysis/retransplantation and 99 (24.8%) to death of the recipient. Losses were more frequent in diabetic recipients (0 vs. 6.8%; p < 0.01) and in grafts from older donors (33.4 vs. 40.4 years; p = 0.05) and with worse renal function (creatinine at extraction 1.0 vs. 1.2 mg/dl; p < 0.01). In this period, CIT and delayed graft function (DFR) was similar between lost and functioning grafts.
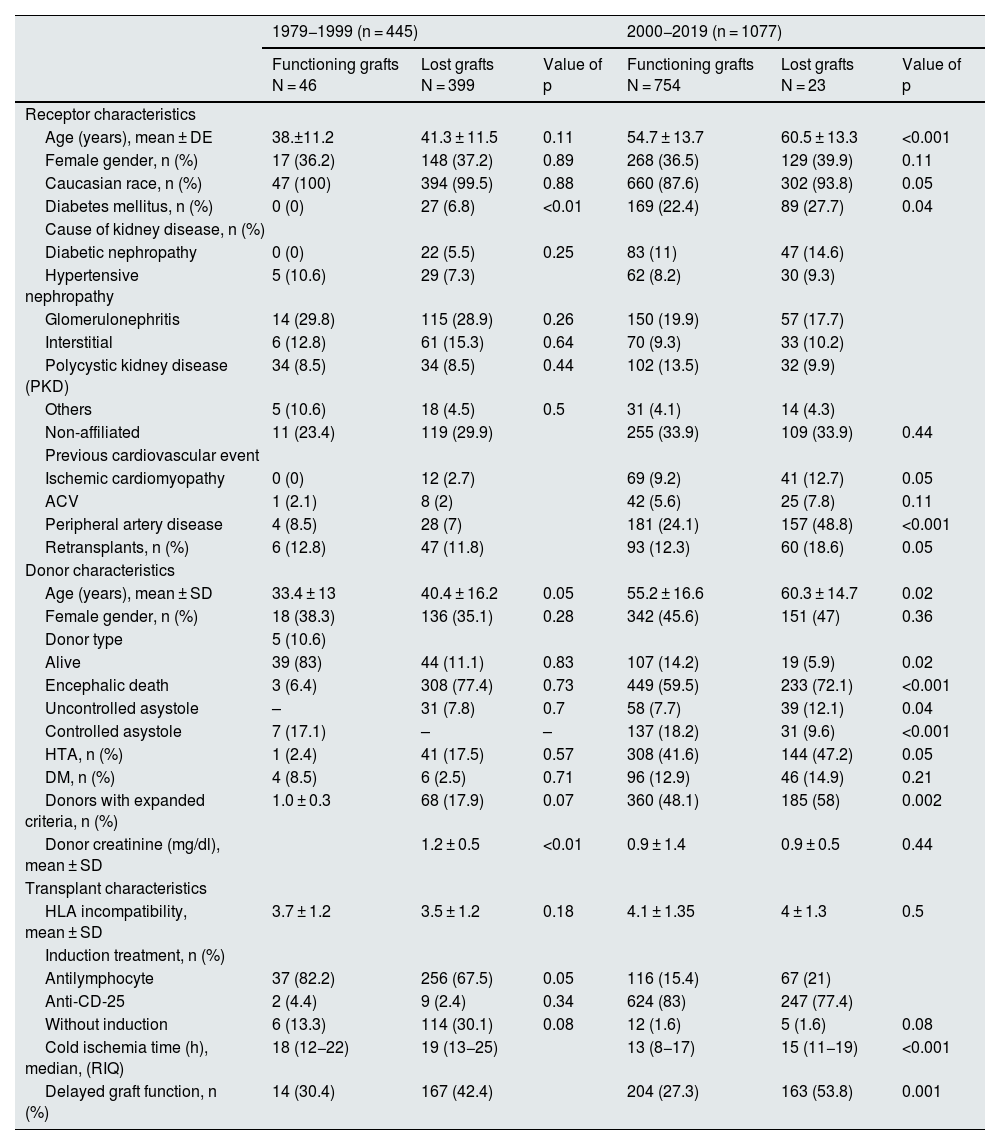
Of the transplants performed during the second period, 323 (30%) grafts were lost during the follow-up period. Of the total losses, 183 (56.6%) were due to graft failure and 140 (43%) due to death of the recipient (data not shown). These grafts were from older donors (603 vs. 55.2 years; p = 0.02) and with SCD (58 vs. 48.1%; p < 0.01). Grafts from living donors were more frequent among functioning grafts (14.2 vs. 5.9%; p = 0.02). Moreover, losses occurred more frequently in older recipients (60.5 vs. 54.7 years; p < 0.01), diabetics (27.7 vs. 22.4%; p = 0.04), with more previous comorbidity (CI: 12.7 vs. 9.2%; p = 0.05 and AP: 48.8 vs. 24.1%; p < 0.01) and more re-RT (1.86 vs. 12.3%; p = 0.05). In this period, lost grafts had higher CIT (15 vs. 13 h; p < 0.01) and higher delayed graft function rate (53.8 vs. 27.3%; p < 0.01) (Table 3).
Baseline characteristics of the study population according to the period in which graft loss occurred.
| 1979−1999 (n = 445) | 2000−2019 (n = 1077) | |||||
|---|---|---|---|---|---|---|
| Functioning grafts N = 46 | Lost grafts N = 399 | Value of p | Functioning grafts N = 754 | Lost grafts N = 23 | Value of p | |
| Receptor characteristics | ||||||
| Age (years), mean ± DE | 38.±11.2 | 41.3 ± 11.5 | 0.11 | 54.7 ± 13.7 | 60.5 ± 13.3 | <0.001 |
| Female gender, n (%) | 17 (36.2) | 148 (37.2) | 0.89 | 268 (36.5) | 129 (39.9) | 0.11 |
| Caucasian race, n (%) | 47 (100) | 394 (99.5) | 0.88 | 660 (87.6) | 302 (93.8) | 0.05 |
| Diabetes mellitus, n (%) | 0 (0) | 27 (6.8) | <0.01 | 169 (22.4) | 89 (27.7) | 0.04 |
| Cause of kidney disease, n (%) | ||||||
| Diabetic nephropathy | 0 (0) | 22 (5.5) | 0.25 | 83 (11) | 47 (14.6) | |
| Hypertensive nephropathy | 5 (10.6) | 29 (7.3) | 62 (8.2) | 30 (9.3) | ||
| Glomerulonephritis | 14 (29.8) | 115 (28.9) | 0.26 | 150 (19.9) | 57 (17.7) | |
| Interstitial | 6 (12.8) | 61 (15.3) | 0.64 | 70 (9.3) | 33 (10.2) | |
| Polycystic kidney disease (PKD) | 34 (8.5) | 34 (8.5) | 0.44 | 102 (13.5) | 32 (9.9) | |
| Others | 5 (10.6) | 18 (4.5) | 0.5 | 31 (4.1) | 14 (4.3) | |
| Non-affiliated | 11 (23.4) | 119 (29.9) | 255 (33.9) | 109 (33.9) | 0.44 | |
| Previous cardiovascular event | ||||||
| Ischemic cardiomyopathy | 0 (0) | 12 (2.7) | 69 (9.2) | 41 (12.7) | 0.05 | |
| ACV | 1 (2.1) | 8 (2) | 42 (5.6) | 25 (7.8) | 0.11 | |
| Peripheral artery disease | 4 (8.5) | 28 (7) | 181 (24.1) | 157 (48.8) | <0.001 | |
| Retransplants, n (%) | 6 (12.8) | 47 (11.8) | 93 (12.3) | 60 (18.6) | 0.05 | |
| Donor characteristics | ||||||
| Age (years), mean ± SD | 33.4 ± 13 | 40.4 ± 16.2 | 0.05 | 55.2 ± 16.6 | 60.3 ± 14.7 | 0.02 |
| Female gender, n (%) | 18 (38.3) | 136 (35.1) | 0.28 | 342 (45.6) | 151 (47) | 0.36 |
| Donor type | 5 (10.6) | |||||
| Alive | 39 (83) | 44 (11.1) | 0.83 | 107 (14.2) | 19 (5.9) | 0.02 |
| Encephalic death | 3 (6.4) | 308 (77.4) | 0.73 | 449 (59.5) | 233 (72.1) | <0.001 |
| Uncontrolled asystole | – | 31 (7.8) | 0.7 | 58 (7.7) | 39 (12.1) | 0.04 |
| Controlled asystole | 7 (17.1) | – | – | 137 (18.2) | 31 (9.6) | <0.001 |
| HTA, n (%) | 1 (2.4) | 41 (17.5) | 0.57 | 308 (41.6) | 144 (47.2) | 0.05 |
| DM, n (%) | 4 (8.5) | 6 (2.5) | 0.71 | 96 (12.9) | 46 (14.9) | 0.21 |
| Donors with expanded criteria, n (%) | 1.0 ± 0.3 | 68 (17.9) | 0.07 | 360 (48.1) | 185 (58) | 0.002 |
| Donor creatinine (mg/dl), mean ± SD | 1.2 ± 0.5 | <0.01 | 0.9 ± 1.4 | 0.9 ± 0.5 | 0.44 | |
| Transplant characteristics | ||||||
| HLA incompatibility, mean ± SD | 3.7 ± 1.2 | 3.5 ± 1.2 | 0.18 | 4.1 ± 1.35 | 4 ± 1.3 | 0.5 |
| Induction treatment, n (%) | ||||||
| Antilymphocyte | 37 (82.2) | 256 (67.5) | 0.05 | 116 (15.4) | 67 (21) | |
| Anti-CD-25 | 2 (4.4) | 9 (2.4) | 0.34 | 624 (83) | 247 (77.4) | |
| Without induction | 6 (13.3) | 114 (30.1) | 0.08 | 12 (1.6) | 5 (1.6) | 0.08 |
| Cold ischemia time (h), median, (RIQ) | 18 (12−22) | 19 (13−25) | 13 (8−17) | 15 (11−19) | <0.001 | |
| Delayed graft function, n (%) | 14 (30.4) | 167 (42.4) | 204 (27.3) | 163 (53.8) | 0.001 | |
DM, diabetes mellitus; DM, diabetes mellitus; h, hours; HT, hypertension; SD, standard deviation; IQR, interquartile range; CVA, cerebrovascular accident; IQR, interquartile range.
The analysis of the risk factors associated with graft loss globally show that only donor age (HR: 1.010; 95% CI: 1.00–1.01; p = 0.04) resulted as an independent risk factor. The time period of transplantation did not turn out to be a risk factor for loss in the adjusted analysis (Appendix BT Supplementary Table S1).
- 1)
Losses due to death with functioning graft according to the transplantation period.
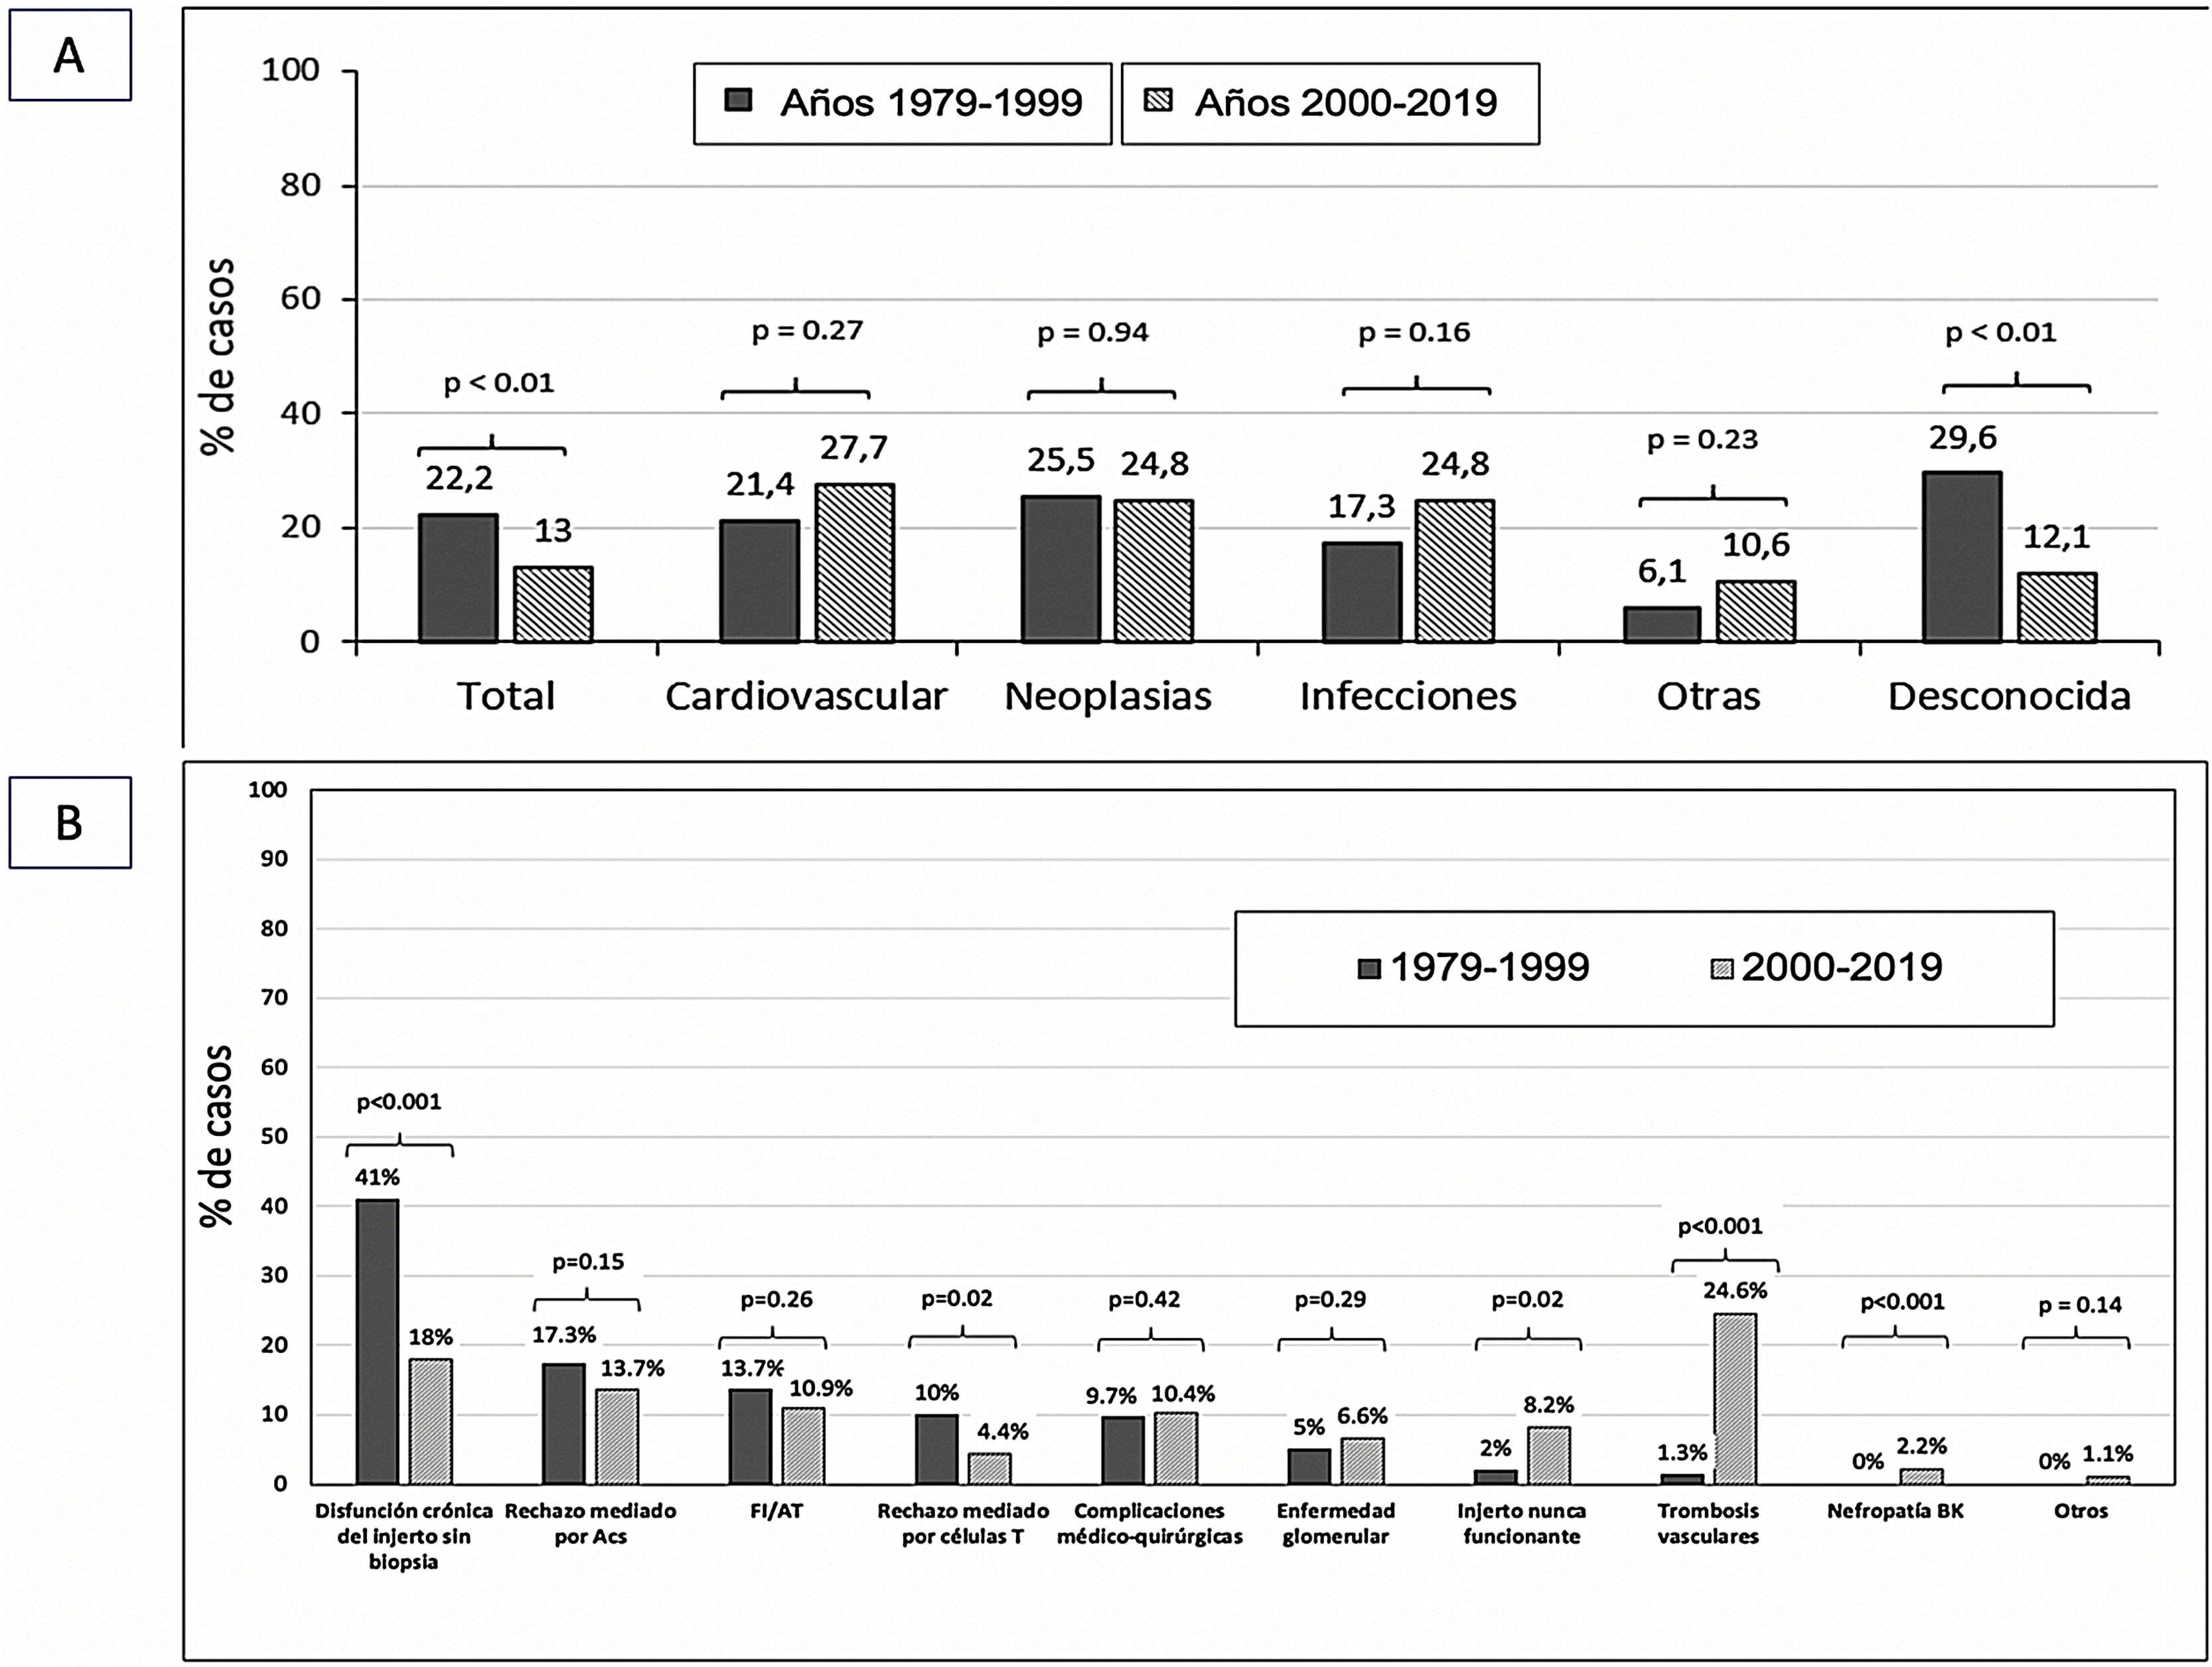
The causes of death of the recipient were similar in both transplantation periods. Only the number of patients dying from an unknown cause was lower in the current period (29.6 vs. 12.1%; p < 0.01) (Fig. 3A).
- 2)
Graft loss with return to renal replacement therapy according to the transplantation period.
 Causes of recipient death according to transplantation period. (B) Causes of graft loss according to transplantation period.")
The most frequent cause of graft loss in period 1 (years 1979−1999) was graft dysfunction without histological verification (41%), whereas in period 2 (years 2000−2019) it was vascular thrombosis (24.6%).
T-cell-mediated rejection was more frequent among lost grafts in period 1 (10 vs. 4.4%; p = 0.02), whereas never-functioning grafts were more frequent in period 2 (8.2 vs. 2%; p = 0.02). BK virus nephropathy was also higher in this period (0 vs. 2.2%). The remaining causes of graft loss were similar in both periods (Fig. 3B).
- 3)
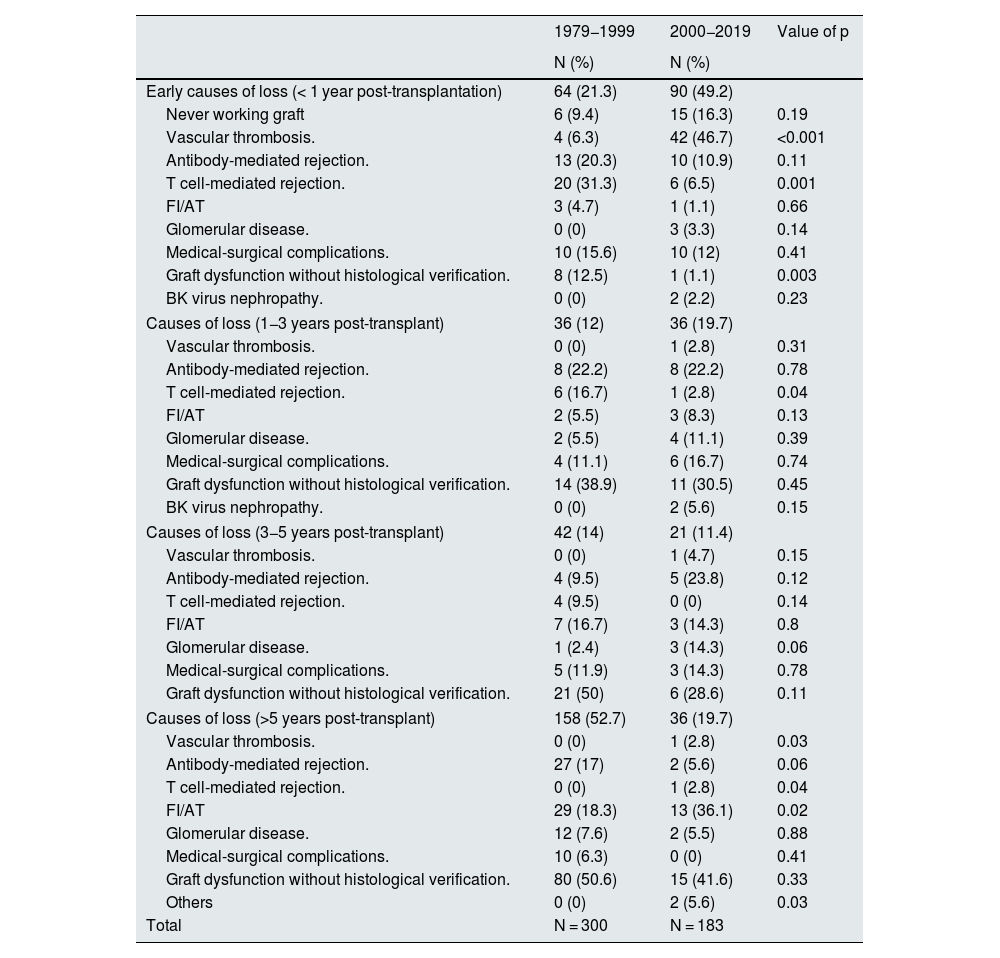
Causes of early and late loss (>1 year post-transplantation) according to transplantation period.
During period 1 (years 1979−1999), the most frequent cause of early loss (<1 year post-transplant) was T-cell-mediated rejection (31.3 vs. 6.5%; p < 0.01). However, in period 2 (years 2000−2019) vascular thrombosis was the most frequent reason for graft loss in the first year post-transplant (46.7 vs. 6.3%; p < 0.001).
The analysis of causes of late graft loss (1−3 years post-transplantation) showed differences in losses due to T-cell mediated rejection (16.7 vs. 2.8%; p = 0.04) which was more frequent in the older stages of the transplantation program. We found no differences in the causes of graft loss at years 3–5 post transplantation between both transplantation periods. Beyond 5 years post-transplantation, loss due to IF/TA was more frequent in period 2 (Table 4).
Causes of graft loss according to the period in which graft loss occurred.
| 1979−1999 | 2000−2019 | Value of p | |
|---|---|---|---|
| N (%) | N (%) | ||
| Early causes of loss (< 1 year post-transplantation) | 64 (21.3) | 90 (49.2) | |
| Never working graft | 6 (9.4) | 15 (16.3) | 0.19 |
| Vascular thrombosis. | 4 (6.3) | 42 (46.7) | <0.001 |
| Antibody-mediated rejection. | 13 (20.3) | 10 (10.9) | 0.11 |
| T cell-mediated rejection. | 20 (31.3) | 6 (6.5) | 0.001 |
| FI/AT | 3 (4.7) | 1 (1.1) | 0.66 |
| Glomerular disease. | 0 (0) | 3 (3.3) | 0.14 |
| Medical-surgical complications. | 10 (15.6) | 10 (12) | 0.41 |
| Graft dysfunction without histological verification. | 8 (12.5) | 1 (1.1) | 0.003 |
| BK virus nephropathy. | 0 (0) | 2 (2.2) | 0.23 |
| Causes of loss (1−3 years post-transplant) | 36 (12) | 36 (19.7) | |
| Vascular thrombosis. | 0 (0) | 1 (2.8) | 0.31 |
| Antibody-mediated rejection. | 8 (22.2) | 8 (22.2) | 0.78 |
| T cell-mediated rejection. | 6 (16.7) | 1 (2.8) | 0.04 |
| FI/AT | 2 (5.5) | 3 (8.3) | 0.13 |
| Glomerular disease. | 2 (5.5) | 4 (11.1) | 0.39 |
| Medical-surgical complications. | 4 (11.1) | 6 (16.7) | 0.74 |
| Graft dysfunction without histological verification. | 14 (38.9) | 11 (30.5) | 0.45 |
| BK virus nephropathy. | 0 (0) | 2 (5.6) | 0.15 |
| Causes of loss (3−5 years post-transplant) | 42 (14) | 21 (11.4) | |
| Vascular thrombosis. | 0 (0) | 1 (4.7) | 0.15 |
| Antibody-mediated rejection. | 4 (9.5) | 5 (23.8) | 0.12 |
| T cell-mediated rejection. | 4 (9.5) | 0 (0) | 0.14 |
| FI/AT | 7 (16.7) | 3 (14.3) | 0.8 |
| Glomerular disease. | 1 (2.4) | 3 (14.3) | 0.06 |
| Medical-surgical complications. | 5 (11.9) | 3 (14.3) | 0.78 |
| Graft dysfunction without histological verification. | 21 (50) | 6 (28.6) | 0.11 |
| Causes of loss (>5 years post-transplant) | 158 (52.7) | 36 (19.7) | |
| Vascular thrombosis. | 0 (0) | 1 (2.8) | 0.03 |
| Antibody-mediated rejection. | 27 (17) | 2 (5.6) | 0.06 |
| T cell-mediated rejection. | 0 (0) | 1 (2.8) | 0.04 |
| FI/AT | 29 (18.3) | 13 (36.1) | 0.02 |
| Glomerular disease. | 12 (7.6) | 2 (5.5) | 0.88 |
| Medical-surgical complications. | 10 (6.3) | 0 (0) | 0.41 |
| Graft dysfunction without histological verification. | 80 (50.6) | 15 (41.6) | 0.33 |
| Others | 0 (0) | 2 (5.6) | 0.03 |
| Total | N = 300 | N = 183 | |
RB: renal biopsy; IF/TA: interstitial fibrosis/ tubular atrophy.
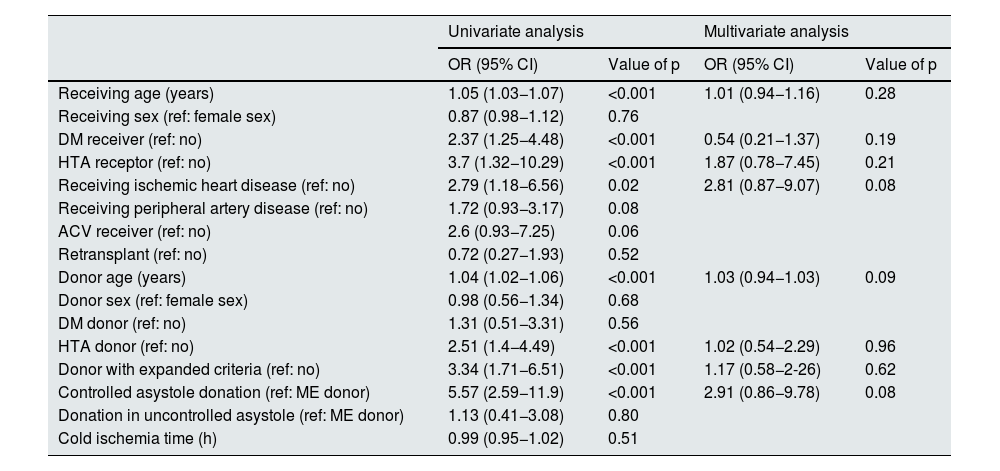
Univariate analysis of the 48 recipients who lost the transplant due to thrombosis showed that renal grafts came from donors (OR: 1.05; 95% CI: 1.03−1.07; p < 0.001) and older recipients (OR: 1.04; 95% CI: 1.02−1.06; p < 0.001). Thrombosis was more frequent in grafts from donors with HTN (OR: 2.51; 95% CI: 1.4−4.49; p < 0.001) and in controlled asystole donation (OR: 5.57; 95% CI: 2.59−11.9; p < 0.00).
However, in the multivariate analysis we did not find any independent risk factor associated with graft loss due to vascular thrombosis (Table 5).
Factors associated with graft loss due to thrombosis of the graft.
| Univariate analysis | Multivariate analysis | |||
|---|---|---|---|---|
| OR (95% CI) | Value of p | OR (95% CI) | Value of p | |
| Receiving age (years) | 1.05 (1.03−1.07) | <0.001 | 1.01 (0.94−1.16) | 0.28 |
| Receiving sex (ref: female sex) | 0.87 (0.98−1.12) | 0.76 | ||
| DM receiver (ref: no) | 2.37 (1.25−4.48) | <0.001 | 0.54 (0.21−1.37) | 0.19 |
| HTA receptor (ref: no) | 3.7 (1.32−10.29) | <0.001 | 1.87 (0.78−7.45) | 0.21 |
| Receiving ischemic heart disease (ref: no) | 2.79 (1.18−6.56) | 0.02 | 2.81 (0.87−9.07) | 0.08 |
| Receiving peripheral artery disease (ref: no) | 1.72 (0.93−3.17) | 0.08 | ||
| ACV receiver (ref: no) | 2.6 (0.93−7.25) | 0.06 | ||
| Retransplant (ref: no) | 0.72 (0.27−1.93) | 0.52 | ||
| Donor age (years) | 1.04 (1.02−1.06) | <0.001 | 1.03 (0.94−1.03) | 0.09 |
| Donor sex (ref: female sex) | 0.98 (0.56−1.34) | 0.68 | ||
| DM donor (ref: no) | 1.31 (0.51−3.31) | 0.56 | ||
| HTA donor (ref: no) | 2.51 (1.4−4.49) | <0.001 | 1.02 (0.54−2.29) | 0.96 |
| Donor with expanded criteria (ref: no) | 3.34 (1.71−6.51) | <0.001 | 1.17 (0.58−2-26) | 0.62 |
| Controlled asystole donation (ref: ME donor) | 5.57 (2.59−11.9) | <0.001 | 2.91 (0.86−9.78) | 0.08 |
| Donation in uncontrolled asystole (ref: ME donor) | 1.13 (0.41−3.08) | 0.80 | ||
| Cold ischemia time (h) | 0.99 (0.95−1.02) | 0.51 | ||
DM, diabetes mellitus; HT, hypertension; CI, confidence interval; DM, diabetes mellitus; CI, confidence interval; SD, brain death; OR, odds ratio.
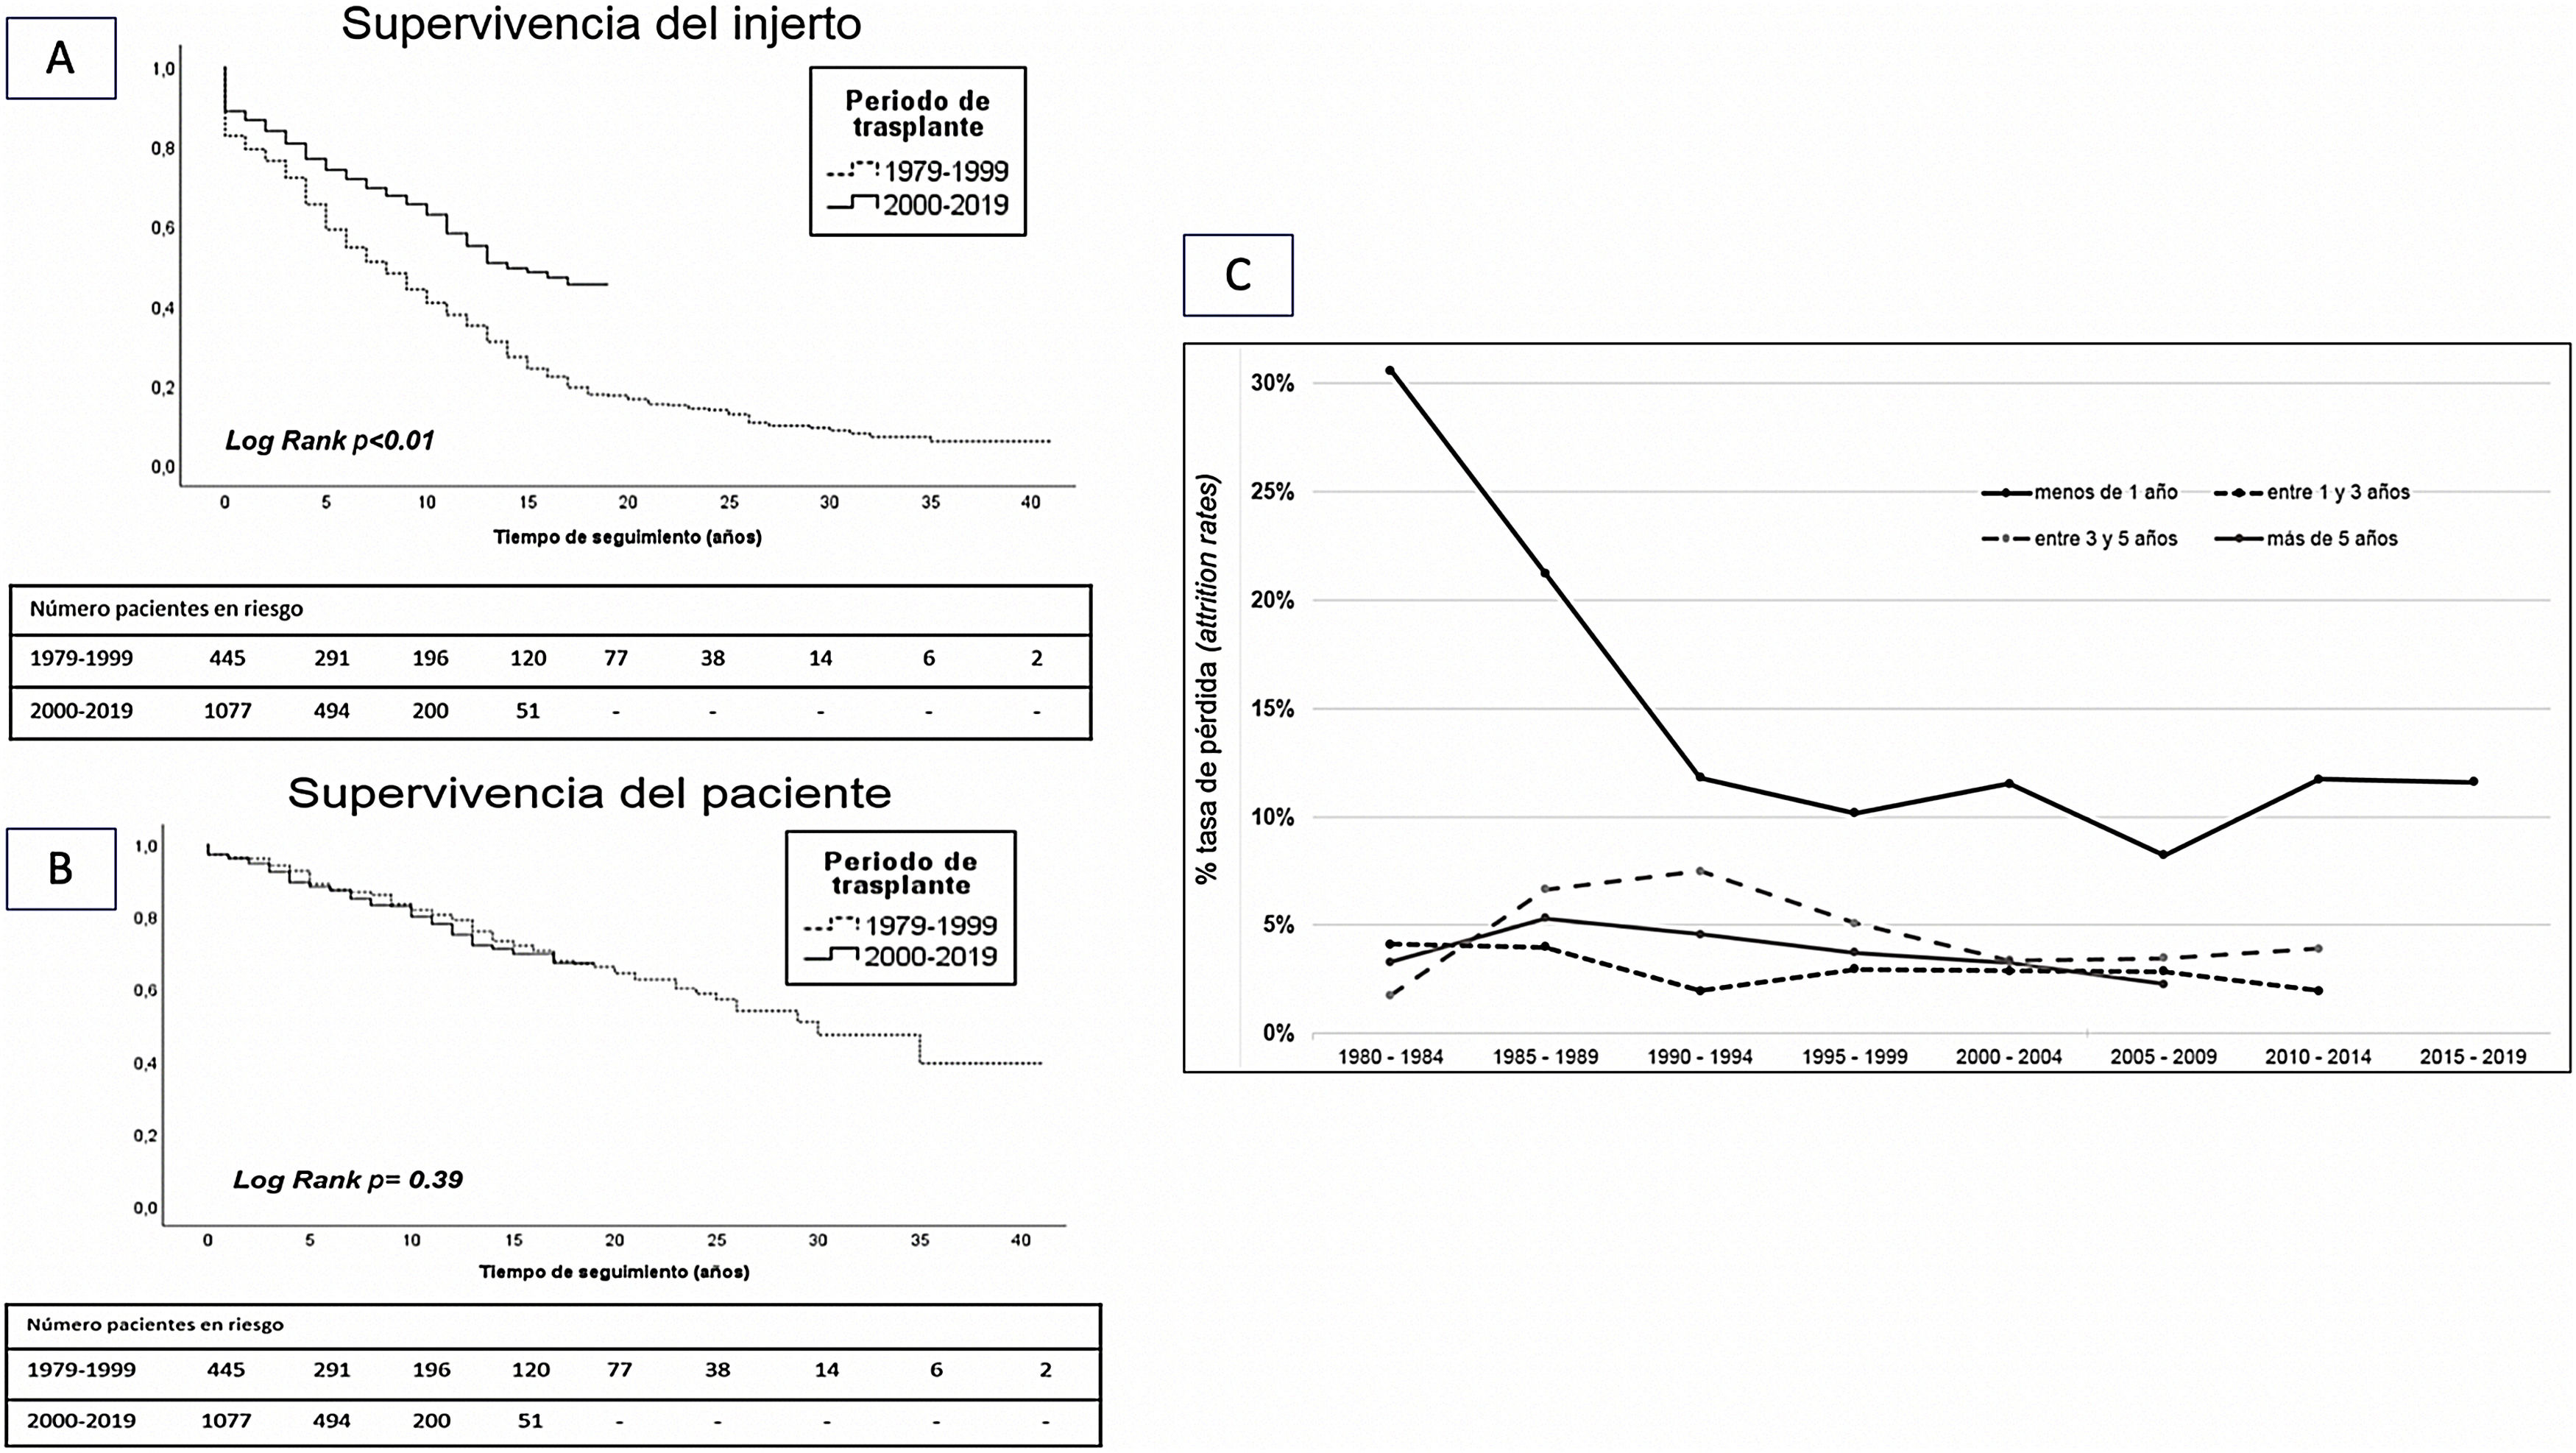
Comparative analysis of graft survival and patient survival between both transplantation periods showed superior 10-year survival in grafts from the years 2000−2019 with respect to those from the years 1979−1999 (62 vs. 44%; p < 0.01). However, there was no difference in 10-year patient survival between the two periods (73 vs. 70%; p = 0.39) (Fig. 4A and B).
 Patient survival. (B) Graft survival. (C) Graft loss rates (attrition rate).")
Analysis of loss rate showed a significantly higher loss rate during the first year that has improved over the last decades. However, loss rates are similar in the periods 1−3 years, 3−5 years and more than 5 years in all transplantation periods (Fig. 4C).
DiscussionThis observational and retrospective study analyzed the causes of graft loss from the beginning of the transplantation program at the Hospital del Mar in 1979 to the present. The cause of graft loss was identified in almost 70% of the cases. Although this percentage is somewhat lower than that reported in other studies12,13; our series has a longer follow-up time, since it includes patients transplanted since 1979. In other studies, the analysis of losses includes transplant recipients since the 1990s.12,14–16
Almost 68% of losses are due to graft failure with return to dialysis or re-transplantation. This loss rate is similar to that reported in the literature, which ranges between 42 and 60%.12,15 Although in more recent series, loss due to death of the recipient with a functioning graft is increasingly frequent and it is becoming the main cause of graft loss.17
Biopsied graft dysfunction was the most frequent cause of loss in the overall series (43%). However, in the earlier times of transplantation (years 1979−1999) graft dysfunction without histological verification is more frequent than in the more recent times (years 2000−2019), which is 18%. This percentage is somewhat higher than in other series, which report between 4.5 and 9% as the cause of loss of graft dysfunction without biopsy.12,13,18
The most frequent histological diagnosis was antibody-mediated rejection with no differences between the two transplantation periods. According to the literature, these diagnoses confer the worst prognosis in terms of graft survival.19,20 Other series analyzing histological findings in graft loss have similar results. Sellares et al.14 report 64% of antibody-mediated rejection in 74 biopsies of lost grafts, while in a Belgian cohort with 140 biopsies studied, the rates of loss due to acute and chronic rejection did not reach 20%.
The causes of graft loss differ according to the time of post-transplant evolution. Acute cellular rejection has now been relegated to a minor role among the losses occurring early in the first year post-transplantation.13,17,18,21 However, in more recent times, vascular thrombosis has emerged as the leading cause of early loss followed by primary graft non-function. This trend coincides with the results reported by Van Loon et al.17 where primary non-function is the cause of 25% of grafts lost in the first year post-transplantation. Another recent study reviewing the causes of loss in the first year post-transplant identified that 41% of grafts were lost due to vascular thrombosis and 29% due to primary function failure, while 15% were lost due to acute rejection.9 Researchers have suggested that this change in the causes of early graft loss is related to the change in the profile of the donor and recipient, who are increasingly older and have more comorbidities, which we have witnessed in recent decades.21 This change results from the attempt to expand the donor pool, since renal replacement in older recipients offers better results compared to remaining on the dialysis waiting list.22
In contrast, the causes of late loss (after the first year post-transplantation) are similar in the 2 transplantation periods. Antibody-mediated rejection is the most frequent cause (35 and 39%, respectively) of loss of biopsied grafts, followed by chronic graft damage in the form of interstitial fibrosis/tubular atrophy (30 and 29%, respectively). This probably reflects of the limited knowledge and ineffective treatments for these histological lesions.15
In our cohort, loss due to death of the recipient with a functioning graft accounted for 33% of graft losses, similar to that reported in other series in our setting. In the Registre de Malalts Renals de Catalunya during the period 2011–2017, the rate of loss due to patient death beyond the first post-transplant year is 2.5 per 100/person/year, with the overall loss rate for that period being 4.7 per 100/person/year.22,23 Data from the UK registry show that recipient death accounted for 40% of all losses between the years 2000–2013.17 In contrast, data from the Belgian group of Van Loon et al.17 in a work that included 1,000 renal transplant recipients between the years 2004 and 2013, showed that patient death was the main cause of loss (57%), ahead of graft failure. This difference with our results could be due to the characteristics of our cohort with long follow-up time, since more than half of the grafts lost (55.3%) correspond to the period 1979−1999, and at this time most losses were due to graft failure (75.2%). However, in the more recent period between 2000 and 2019, the rate of graft loss due to death of the recipient has increased (43%).
The main causes of death of the recipient are cardiovascular disease, infections and malignant tumors, similar to those reported in other series.11,16 It is striking that these causes remain stable over time and have not varied from one transplant period to another.
There are some limitations in our study, mainly derived from the retrospective and descriptive nature of the analysis. In addition, the biopsies included are by clinical indication and follow-up since 2014, and we do not have iterative follow-up biopsies in all cases to assess the evolution of histological lesions. In addition, the systematic determination of pre- and post-transplant anti-HLA antibodies on the Luminex platform® has been routinely performed since 2010.
In conclusion, comparing two transplantation periods (1970–1999 and 2000−2019) we observed a change in the causes of early renal graft loss. During the first post-transplant year, immune-mediated losses such as acute rejection take a back seat, whereas vascular thrombosis and never functioning grafts emerge as more frequent causes of graft loss. However, the causes of graft loss beyond the first year post-transplant and the causes of death of recipients with functioning grafts have not changed over the years.
Further studies could identify the causes of renal graft loss, with the use of current diagnostic tests in a systematic way, in addition to improving tools for proper donor and recipient selection to improve short- and long-term outcomes in RT.
FinancingThis work has been carried out thanks to funding from ISCIII FIS-FEDERPI10/01370, PI13/00598, PI16/00617, PI19/00037 and PI20/00090; ISCIII FEDER RedinRenRD12/0021/0024 and RD16/0009/0013 and Fundació la Marató de TV3201822-10, 121530.
Conflict of interestThe authors declare that they have no conflicts of interest.
This work is part of AB's doctoral thesis project at the Department of Medicine, Universitat Autònoma de Barcelona. AB holds a Río Ortega contract CM19/0004. MJPS holds a grant for the intensification of the research activity of physicians from the Spanish Society of Transplantation.
The authors would like to thank Adriana Sierra, Alfonso Califano, Sheila Bermejo, Ana Marina Granados, Anna Faura, Sara Álvarez, Nuria Cubino, María Vera and Montserrat Folgueiras for their contribution to the development of the TRASMAR database. Thanks also to Rosa Causadias and Anna Bach for their collaboration. Thanks to Xavier Durán for his support with the final statistical analysis.
The following is Supplementary data to this article:


