


The Classification and Regression Tree (CART) is a supervised learning approach useful used to segment the space of and the predictors/features space into smaller homogeneous regions that are, represented in a decision tree. It computes the selection of features automatically, in contrast to traditional statistic methods. In this review, we compared CART to traditional statistics in patients who did not attempt a diet to patients who followed a low-protein diet (LPD) or the Mediterranean diet in chronic kidney disease (CKD) patients, and we analyzed them using linear regression and CART methods. In our example, diet adherence proved to be the factor with the greatest impact on renal function decline, but CART failed to detect significant differences between LPD and Mediterranean diet. Similar results were found using traditional statics, but CART gave a model with the proportion of the explained outcome by the model (R2) higher by about 20%, thus a stronger model. In addition, CART allows quick and easy identification of the variables affecting the outcome with a simple visual representation through the decision tree, increasing the interpretability of the results. In summary, no difference in the impact of variables has been detected with the two methods, but CART gave us a more detailed model with a faster and easier interpretation.
El Árbol de Clasificación y Regresión (CART) es un enfoque de aprendizaje supervisado usado para segmentar el espacio de los predictores/características en regiones homogéneas más pequeñas que se representan en un árbol de decisión. Calcula la selección de las características automáticamente, a diferencia de los étodos estadísticos tradicionales. En esta revisión, comparamos CART con la estadística tradicional en pacientes que no intentaron una dieta con pacientes que siguieron una Low Protein Diet (LPD) o la dieta mediterránea en pacientes con enfermedad renal crónica (ERC), y los analizamos utilizando regresión lineal y métodos CART. En nuestro ejemplo, la adherencia a la dieta demostró ser el factor con el mayor impacto en el deterioro de la función renal, pero CART no detectó diferencias significativas entre la LPD y la dieta mediterránea. Se encontraron resultados similares utilizando la estadística tradicional, pero CART proporcionó un modelo con la proporción del resultado explicado por el modelo (R2) superior en aproximadamente un 20%, lo que resulta en un modelo más robusto. Además, CART permite la identificación rápida y sencilla de las variables que afectan el resultado con una representación visual simple a través del árbol de decisión, facilita la interpretabilidad de los resultados. Resumiendo, no se han detectado diferencias en el impacto de las variables con los dos métodos, pero CART nos proporcionó un modelo más detallado con una interpretación más rápida y sencilla.
Although randomized clinical trials (RCTs) are the gold standard for evaluating treatment efficacy, observational studies are fundamental to generating hypotheses, evaluating the treatment in real life, and generating audits. However, observational are subjected to many biases and the correct statistical methods should be applied to give realistic results. Indeed, each statistical analysis method has its own advantages and limitations. In this paper, we conduct a detailed study comparing the characteristics of Classification and Regression Trees (CART) with traditional statistical methods, focusing specifically on their application in a real-world evaluation of the impact of diet on renal function.
Diet in CKDThe reduction in glomerular filtration rate (GFR) after the age of 40 is a paraphysiological event; hypertension, diabetes, cardiovascular disease and inadequate diets are the major risk factors for developing moderate to advanced degrees of chronic kidney disease (CKD).
Nutritional therapy can be useful in slowing the progression of CKD and delaying the need for a preventive kidney transplant or the start of renal replacement therapy, while continuously improving patients’ quality of life.1
Healthy dietary habits are crucial to counteract the progression of chronic diseases such as CKD and the risk factors associated with their development. A customized diet based on patients’ eating habits can promote adherence to nutritional therapy and thus improve the conservative management of CKD patients. Optimal nutrition is crucial for patients with impaired kidney function. It is an important modifiable lifestyle factor in the primary prevention of CKD progression.2,3
Machine learningMachine learning is a group of automatic performers to solve problems in most sciences useful to improve diagnostics accuracy establish a prognosis and monitor physiological data. They can be divided into supervised and unsupervised ML methods, based on whether the output is known or not, respectively.4
Unsupervised methods are often used to split into clusters or find subsamples with high likelihood, and they are often in genetic mapping.
Conversely, supervised ML are useful to compute the strength of the association between variables and outcome. Among them, we can find Classification and Regression Trees (CART), Random Forests (RF), and Neural Networks (NNs). In this paper, we developed the first of them.
Classification and regression tree (CART)Classification and regression tree is a supervised learning approach useful to segment the predictors/feature space into smaller regions with more homogeneous outcomes. This set of segments is summarized in a decision tree. CART can be used for regression or classification, without methodological differences, with the exploratory scope. It is not the gold standard to test hypothesis.5 Each region corresponds to a node in the tree, and two child nodes will occupy different regions of the parent node. These splits aim to reduce the residual sum of squared error (RSS), thus increasing the precision of our prediction.6 Similar to regression analysis, CART can be performed using only one dependent variable – comparable to the univariate regression model – and includes all the features that are comparable to multivariate regression analysis. However, conversely to traditional statistics, in exhaustive CART the selection of the variables is automatically computed.
One of the advantages of the tree-structured approach is to do an automatic stepwise variable selection and it can analyze different kinds of features, independently from their nature or distribution of them. Furthermore, CART is easy to interpret through its clear visual reading.7
Linear regressionThe association between two variables, often a risk factor and an outcome, can be assessed by linear regression. It provides us with a coefficient which, when it is multiplied by the value of our risk factor, estimates the value of our outcome.8
The causal impact of a variable on the outcome can be influenced by other variables, the so-called “confounding variables”. According to Tripepi G. et al., confounders should be related to the outcome, should be associated with a risk factor and should not be involved in the pathophysiological pathway between risk factor and outcome. Confounders can increase, decrease or obscure the association between our risk factor and the outcome.9
Multivariate analysis is an analysis that includes in the model all confounding variables and variables related to allocation and outcome, which are not included in the pathophysiologic pathway. The multivariate analysis makes it possible to adjust the relationship value determined in the univariate analysis for no more than 1 confounding variable per 10 events. However, the choice of confounding variables may not be wise.
Aim of the reviewThe aim of our study is to compare data about the effects of no diet, a low-protein diet and a Mediterranean diet on the progression of CKD in non-diabetic patients with traditional statistics and classification and regression trees (CART).
Practical exampleTo compare this method, we used a dataset of 105 non-randomized patients with CKD stage 2–5 on non-dialysis therapy. Patients were followed-up for one year. 32 patients were not subjected to any diet (group A), 40 patients were subjected to a low-protein diet (group B), and 35 patients were subjected to a Mediterranean diet (group C).
Allocation followed a real-life observational design, based on the dietitian's recommendation, and the patient's adherence. Anamnesis was collected at baseline, whereas laboratory data were collected at baseline and at annual follow-up.
Adherence to diet has been computed at the annual follow-up, corresponding to the end of our evaluation. Patients reported complete adherence to the diet in 82% (Mediterranean diet is 86% vs LPD 80%, p=0.79). For patients who did not follow a specific nutritional regimen was not possible to detect adherence, due to there being no diet to follow.
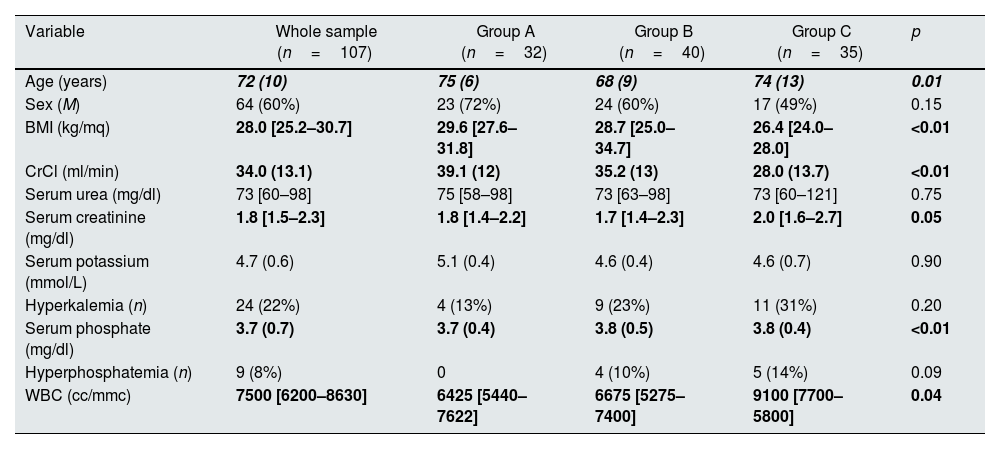
As reported in Table 1, the three groups differed in Age, BMI, basal creatinine clearance, serum phosphate, and white blood cells (WBC). These variables were selected as confounders and included in the multivariate regression model. Variables are reported as mean±standard deviation or median [interquartile range] or number (%), as appropriate concerning the nature and the distribution of the variables.
Baseline feature split for diet.
| Variable | Whole sample (n=107) | Group A (n=32) | Group B (n=40) | Group C (n=35) | p |
|---|---|---|---|---|---|
| Age (years) | 72 (10) | 75 (6) | 68 (9) | 74 (13) | 0.01 |
| Sex (M) | 64 (60%) | 23 (72%) | 24 (60%) | 17 (49%) | 0.15 |
| BMI (kg/mq) | 28.0 [25.2–30.7] | 29.6 [27.6–31.8] | 28.7 [25.0–34.7] | 26.4 [24.0–28.0] | <0.01 |
| CrCl (ml/min) | 34.0 (13.1) | 39.1 (12) | 35.2 (13) | 28.0 (13.7) | <0.01 |
| Serum urea (mg/dl) | 73 [60–98] | 75 [58–98] | 73 [63–98] | 73 [60–121] | 0.75 |
| Serum creatinine (mg/dl) | 1.8 [1.5–2.3] | 1.8 [1.4–2.2] | 1.7 [1.4–2.3] | 2.0 [1.6–2.7] | 0.05 |
| Serum potassium (mmol/L) | 4.7 (0.6) | 5.1 (0.4) | 4.6 (0.4) | 4.6 (0.7) | 0.90 |
| Hyperkalemia (n) | 24 (22%) | 4 (13%) | 9 (23%) | 11 (31%) | 0.20 |
| Serum phosphate (mg/dl) | 3.7 (0.7) | 3.7 (0.4) | 3.8 (0.5) | 3.8 (0.4) | <0.01 |
| Hyperphosphatemia (n) | 9 (8%) | 0 | 4 (10%) | 5 (14%) | 0.09 |
| WBC (cc/mmc) | 7500 [6200–8630] | 6425 [5440–7622] | 6675 [5275–7400] | 9100 [7700–5800] | 0.04 |
BMI=body mass index; CrCl=creatinine clearance; WBC=white blood cell. Variables are reported as mean (standard deviation) or median [interquartile range] or number (%), as appropriate concerning the nature and the distribution of the variables. Hyperkalemia is defined as serum potassium higher than 5.1mmol/L and hyperphosphatemia is defined as a serum phosphate higher than 4.5mg/dl.
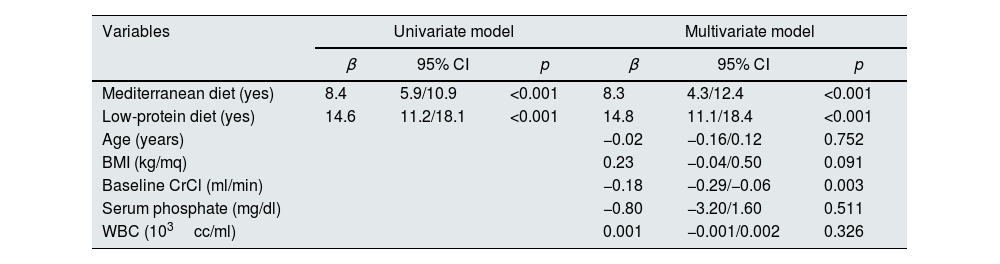
The univariate regression model showed a significant impact of the Mediterranean diet and LPD on creatinine clearance difference compared to patients not subjected to any diet (Table 2). These results were confirmed by multivariate analysis. Furthermore, also creatinine clearance at baseline had a significant association with our outcome and a trend of significance for BMI. This multivariate model had an R2 of 0.43 (Table 2).
Univariate and multivariate linear regression analysis using the differences of creatinine clearance as dependent variable.
| Variables | Univariate model | Multivariate model | ||||
|---|---|---|---|---|---|---|
| β | 95% CI | p | β | 95% CI | p | |
| Mediterranean diet (yes) | 8.4 | 5.9/10.9 | <0.001 | 8.3 | 4.3/12.4 | <0.001 |
| Low-protein diet (yes) | 14.6 | 11.2/18.1 | <0.001 | 14.8 | 11.1/18.4 | <0.001 |
| Age (years) | −0.02 | −0.16/0.12 | 0.752 | |||
| BMI (kg/mq) | 0.23 | −0.04/0.50 | 0.091 | |||
| Baseline CrCl (ml/min) | −0.18 | −0.29/−0.06 | 0.003 | |||
| Serum phosphate (mg/dl) | −0.80 | −3.20/1.60 | 0.511 | |||
| WBC (103cc/ml) | 0.001 | −0.001/0.002 | 0.326 | |||
BMI=body mass index; CrCl=creatinine clearance; WBC=white blood cell.
CARTs were performed in the basic model and the exhaustive model, using the difference in creatinine clearance at follow-up as the continuous dependent variable, i.e., regression tree. The model was trained in a training test that included a randomly selected 70% of the sample. The remaining 30% was used for the test set. We used the complexity parameter, which better performed in terms of cross-validated accuracy in terms of repeated cross-validated mean square error.
Starting from a univariate basic CART model, we found that patients who did not follow a diet lost about 11ml/min in one year, whereas differences in patients who followed a Mediterranean or low-protein diet had no clinical significance. According to their position on the first node, adherence or non-adherence to a particular diet was the most important variable.
Similar to the basic CART model (Fig. 1), the attempt or lack of a specific diet was the variable with the greatest influence in a multivariate CART model (Fig. 2). Moreover, no other split was performed based on type of diet in this last tree. Secondary splits were performed based on BMI and baseline CrCl value, which revealed a high impact of these characteristics on the course of clearance progression. The other nodes, based on age and WBC, were lost in the pruned model, as its impact existed but was not very relevant.

 and pruned exhaustive classification and regression tree (B). In both tree models, the first node is based on the presence or absence of a particular diet, as this was the variable with the greatest impact on the variance of creatinine clearance. BMI=body mass index; CrCl=creatinine clearance; WBC=white blood cell count.")
Basic exhaustive classification and regression tree (A) and pruned exhaustive classification and regression tree (B). In both tree models, the first node is based on the presence or absence of a particular diet, as this was the variable with the greatest impact on the variance of creatinine clearance. BMI=body mass index; CrCl=creatinine clearance; WBC=white blood cell count.
Indeed, it is to highlight that the splits in the pruned CART were based on the same variable with significant impact in the multivariate regression model deleting variables not significant in the regression analysis. The RMSE was 11.87. Moreover, the R-square of the pruned model was 0.58 (Fig. 3), higher than the R-square of the multivariate regression model by about 20%.
Usefulness and limits of CARTUsefulness of CART
Observational studies based on real-life data are often subjected to many biases and missing information, and data do not always have a normal distribution. However, they can be used to do audits and surveys, which allow analyzing of the delivery of care and the prevalence of diseases at different levels,10 from a single ward to whole national data.11,12 Audits based on real-life data are often used in Intra-departmental assessments, and they need to be easily explainable and interpretable, and CART is in keeping with this assumption.13 Splitting the population in the subsample with high likelihood, allows us to detect the part of the population more related to our outcome. Indeed, CART deeply sums up the impact of variables on the outcome, and its plot is visually easier to understand.
Furthermore, this method provides often a model stronger than traditional statics, with a higher R2 and lower error measures, and it does not require assumptions about the variable distributions or outcome types (continuous or dichotomous).
Limitation of CARTThe first limitation of CART is given by the lack of conditional inference, thus has not concept of statistical significance. Indeed, it is based on the likelihood of the splits, and variables selection bias and overfitting risk are not solved. Since the algorithm only searches for the better split, the heuristic variable can be selected to deep the process, giving useless steps and it is not able to detect if some variable is or is not a “noise variable”.14
DiscussionOur analysis showed different trends in CKD progression in patients treated with a specific diet (low-protein or Mediterranean) and in patients without a specific diet. The analyses were performed using both traditional statistical analyses and machine learning methods. In both cases, the lack of a specific diet appeared to be the most important factor in the deterioration of creatinine clearance.
Although the results of the two methods are similar, CART probably allows easier detection of the variables involved in the change in results. In addition, the comprehensibility of the decision tree is no less important, as is the visible different strength of the influence that each variable has on the outcome. The position of the variables in the tree, as well as the removal of some variables from the pruned tree, make it possible to understand well how much a variable affects the outcome.
Even though less considered, the difference in the R2 between traditional methods and machine learning ought to be emphasized. Indeed, this indicates the proportion of the outcome that the model explains, and machine learning often allows for a higher R-square, despite of the easier choice of the selected variables.
Our results are in keeping with the literature. Indeed, is well established that adequate nutrition is a critical lifestyle factor in the primary prevention of CKD progression2,15 and avoids dysregulation of fluid, acid-base and electrolyte homeostasis.16–18
Although the role of LPD is beyond doubt, patient adherence to this diet is crucial.19 On the other hand, the effect of LPD in the elderly is not as strong as in the young, as the geriatric population has poor adherence to dietary management.20 Indeed, in patients refusing LPD with malnutrition as a consequence, the Mediterranean diet could be considered a valid choice.3 Although our analysis cannot confirm this, both the traditional analysis and CART were able to detect differences between patients who followed a diet and those who did not. In addition, CART did not detect split based on the Mediterranean diet or LPD. This focused on the high impact of having or not adhering to a specific alimentary regimen.
We need to highlight that CART automatically based one of the major splits on BMI, detecting 30kg/m2 as a splitting value. This evidenced the role of Obesity in CKD progression, well-known in the literature and detected by the ML algorithm.21–24
ConclusionIn conclusion, considering as a major topic of our paper the comparison between statistical methods, we can conclude that supervised machine learning approaches such as CART provide a detailed summary of the impact of variables on the outcome that is consistent with traditional statistical methods. Furthermore, the model is visually easier to understand and better explained by using a cross-validated cut-off that allows the model to be more specific. Last but not least, the automatic stepwise selection of the variable used to split the groups leads to faster and more effortless procedures, giving us more strength models.
Support and financial disclosureAuthors declare any interest, financial support or relationship that may pose a conflict of interest.
Conflict of interestThe authors declare that they have no conflict of interest.


