


Peritoneal dialysis (PD) patients, who are more likely to have a poor prognosis for new cardiovascular events (CVE), are the focus of our research. We aim to investigate whether the hemoglobin-to-red cell distribution width (HRR) ratio is associated with a higher risk of new-onset CVE in PD patients. This research could potentially lead to new strategies for predicting and preventing new-onset CVE in PD patients.
MethodsOne thousand four hundred seventy-four patients from November 1, 2005, to December 31, 2016, were divided into high and low HRR groups using restricted cubic spline (RCS). Various statistical methods were utilized to study the impact of HRR changes on new-onset CVE in PD patients, including Kaplan–Meier cumulative incidence curves, multivariate COX regression, competitive risk analysis, and forest plots to analyze subgroup interactions.
ResultsDuring the follow-up period, 104 new-onset CVEs were recorded. Restricted cubic spline showed a non-linear relationship between HRR and new-onset CVE. A multifactorial COX regression analysis model showed reduced HRR as an independent risk factor for new-onset CVE (HR, 1.737; 95% CI 1.119–2.695, P=0.014). Kaplan–Meier analysis showed a significant difference in survival between the two groups of patients (P=0.002). The competing risks model found that after excluding endpoint events, there was still a significant difference in new-onset CVE (P=0.0009) between the different HRR groups. In subgroup analyses, there were no significant differences between groups.
ConclusionsLow hemoglobin to red cell distribution width ratio (HRR) is associated with a higher risk of new-onset CVE in PD patients.
Los pacientes en diálisis peritoneal (DP), que tienen más probabilidades de tener un mal pronóstico debido a nuevos eventos cardiovasculares (ECV), son el foco de nuestro estudio. Nuestro objetivo es estudiar si la ratio hemoglobina-ancho de distribución de glóbulos rojos (HRR) está relacionada con un mayor riesgo de ECV de nueva aparición en pacientes con DP. Este estudio puede conducir a nuevas estrategias para predecir y prevenir nuevos ECV en pacientes con DP.
MétodosEntre el 1 de noviembre de 2005 y el 31 de diciembre de 2016, 1.474 pacientes usaron spline cúbicos restringidos y se dividieron en grupos de HRR alta y HRR baja. Se utilizaron varios métodos estadísticos para estudiar el impacto de los cambios en la HRR en el ECV de nueva aparición en pacientes con DP, incluyendo la curva de incidencia acumulada Kaplan-Meier, la regresión múltiple de Cox, el análisis de riesgo competitivo y el diagrama de bosque para analizar la interacción de subgrupos.
ResultadosDurante el seguimiento se registraron 104 nuevos ECV. La restricción de los spline cúbicos muestra una relación no lineal entre HRR y el nuevo ECV. El modelo de análisis de regresión de Cox multifactorial mostró que la disminución de la HRR fue un factor de riesgo independiente para el nuevo ECV (HR 1.737; 95% CI 119-2.695, p=0014). El análisis de Kaplan-Meier mostró diferencias significativas en la supervivencia entre los 2 grupos de pacientes (p=0002). El modelo de riesgo competitivo encontró que después de excluir el evento final, todavía había diferencias significativas en los nuevos ECV entre los diferentes grupos de HRR (p=0,0009). En el análisis de subgrupos, no se encontraron diferencias significativas entre los grupos.
ConclusiónUna baja HRR está relacionada con un mayor riesgo de ECV de nueva aparición en pacientes con DP.
Peritoneal dialysis (PD) is a widely used renal replacement therapy for end-stage kidney disease. However, cardiovascular events (CVE) remain one of the most common complications in PD patients, primarily driven by chronic inflammation, oxidative stress, and anemia.1–5 In PD patients, anemia and elevated red cell distribution width (RDW) are prevalent and closely linked to adverse outcomes. Anemia reflects erythropoietin resistance and iron deficiency, while elevated RDW signifies inflammation-driven erythrocyte turnover.6 PD-specific factors, such as bioincompatible dialysis solutions and peritoneal membrane dysfunction, exacerbate both conditions.7 The hemoglobin-to-RDW ratio (HRR) has emerged as a composite biomarker integrating anemia and inflammation, with broad applications in cardiovascular diseases (CVD) and other conditions.8–12 Current evidence suggests that HRR's pathobiological processes may predict CVD outcomes.13 Although PD patients are already at high risk for CVE, HRR could serve as an accessible and cost-effective marker for identifying those at the highest risk. Nevertheless, its association with new-onset CVE in PD patients remains unclear. This study aims to evaluate the relationship between HRR and the risk of new-onset CVE in PD patients.
Materials and methodsParticipants and measurementsWe retrospectively conducted a study to investigate whether the HRR synergizes in predicting the risk of new-onset CVE in peritoneal dialysis patients. Patients who commenced PD between November 1, 2005, and December 31, 2016, were qualified for our study. Among them, 104 cases were excluded because of age younger than 18 years or older than 80 years (n=17), missing of data (n=9), duration of PD less than 3 months (n=53), severe infection (n=0), history of hematological or autoimmune disease, or taking glucocorticoid or immunosuppressant (n=25). The above patients were excluded because these factors might impact HRR levels (Fig. 1). Finally, 1474 patients were included in the study. The Institutional Review Board approved this retrospective study. Written informed consent was not required because we needed to collect the hospital's pre-existing medical data.
Baseline investigations
Baseline demographic data and laboratory biochemical indicators were collected 3 months after PD therapy was initiated. The main result was new-onset CVD. Baseline demographic and clinical data were collected at the initiation of PD therapy. Biochemical parameters were collected within 90 days after PD therapy was initiated. We considered patients to have diabetes if they were taking insulin or oral hypoglycemic agents and/or had a clinical diagnosis of type 1 or type 2 diabetes mellitus. Hypertension was noted if patients took antihypertensive drugs or had two blood pressure measurements of 140/90mmHg or higher. New-onset CVE was identified if any of the following appeared in the patient's medical records after the initiation of PD: arrhythmia, coronary atherosclerotic heart disease, myocardial infarction, heart failure, ischemic or hemorrhagic cerebrovascular accidents, or if a patient who died from any of the above causes. Laboratory measurements were obtained using standard methods in the clinical laboratory. Total Kt/V was calculated by PD Adequest software 2.0 (Baxter et al.). Medicine use was recorded based on prescriptions. The patients returned to these centers for quarterly evaluation, and trained nurses interviewed the patients by telephone monthly to assess general conditions.
Study outcomeThe outcome was the first occurrence of CVE since PD therapy. The follow-up endpoint was the first-time CVE, death, transferring to hemodialysis therapy, kidney transplantation, transferring to other PD centers, and losing to follow-up or censoring on December 31, 2016.
Statistical analysisConsidering the potential relationship between HRR levels and poor prognosis in PD patients, we assumed that there might be a non-linear relationship between them in PD patients. Eligible patients were divided into two groups according to HRR levels (HRR ≤5.835) and (HRR >5.835). All continuous variables were skewed distribution described as median (25th to 75th percentile), and categorical variables were given as frequency and percentage. The chi-square test was used for categorical variables, and the Mann–Whitney U test was used for skewed continuous variables. The univariate logistic regression model was used to examine the association between the patient's characteristics and poor prognosis, and then multivariate logistic regression was used to analyze the patient's characteristics with predictive odds adjusted for covariates with (P<0.05 in univariate logistic analysis). The incidence of new-onset CVE was analyzed using the Kaplan–Meier curve, and the differences between groups were assessed using the log-rank test. Multivariate COX regression models were constructed using qualified covariates, which were significantly associated with new CVE in multivariate analysis or the characteristics listed in Table 1 or for the importance of clinical concern.
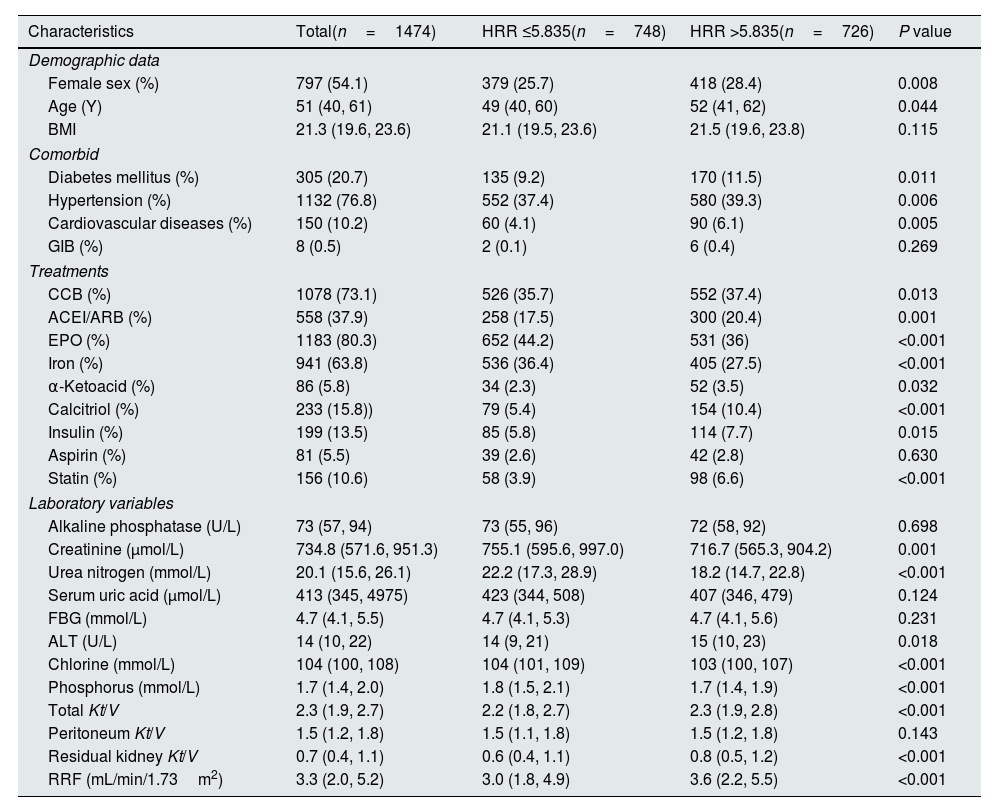
Baseline characteristics of the study population.
| Characteristics | Total(n=1474) | HRR ≤5.835(n=748) | HRR >5.835(n=726) | P value |
|---|---|---|---|---|
| Demographic data | ||||
| Female sex (%) | 797 (54.1) | 379 (25.7) | 418 (28.4) | 0.008 |
| Age (Y) | 51 (40, 61) | 49 (40, 60) | 52 (41, 62) | 0.044 |
| BMI | 21.3 (19.6, 23.6) | 21.1 (19.5, 23.6) | 21.5 (19.6, 23.8) | 0.115 |
| Comorbid | ||||
| Diabetes mellitus (%) | 305 (20.7) | 135 (9.2) | 170 (11.5) | 0.011 |
| Hypertension (%) | 1132 (76.8) | 552 (37.4) | 580 (39.3) | 0.006 |
| Cardiovascular diseases (%) | 150 (10.2) | 60 (4.1) | 90 (6.1) | 0.005 |
| GIB (%) | 8 (0.5) | 2 (0.1) | 6 (0.4) | 0.269 |
| Treatments | ||||
| CCB (%) | 1078 (73.1) | 526 (35.7) | 552 (37.4) | 0.013 |
| ACEI/ARB (%) | 558 (37.9) | 258 (17.5) | 300 (20.4) | 0.001 |
| EPO (%) | 1183 (80.3) | 652 (44.2) | 531 (36) | <0.001 |
| Iron (%) | 941 (63.8) | 536 (36.4) | 405 (27.5) | <0.001 |
| α-Ketoacid (%) | 86 (5.8) | 34 (2.3) | 52 (3.5) | 0.032 |
| Calcitriol (%) | 233 (15.8)) | 79 (5.4) | 154 (10.4) | <0.001 |
| Insulin (%) | 199 (13.5) | 85 (5.8) | 114 (7.7) | 0.015 |
| Aspirin (%) | 81 (5.5) | 39 (2.6) | 42 (2.8) | 0.630 |
| Statin (%) | 156 (10.6) | 58 (3.9) | 98 (6.6) | <0.001 |
| Laboratory variables | ||||
| Alkaline phosphatase (U/L) | 73 (57, 94) | 73 (55, 96) | 72 (58, 92) | 0.698 |
| Creatinine (μmol/L) | 734.8 (571.6, 951.3) | 755.1 (595.6, 997.0) | 716.7 (565.3, 904.2) | 0.001 |
| Urea nitrogen (mmol/L) | 20.1 (15.6, 26.1) | 22.2 (17.3, 28.9) | 18.2 (14.7, 22.8) | <0.001 |
| Serum uric acid (μmol/L) | 413 (345, 4975) | 423 (344, 508) | 407 (346, 479) | 0.124 |
| FBG (mmol/L) | 4.7 (4.1, 5.5) | 4.7 (4.1, 5.3) | 4.7 (4.1, 5.6) | 0.231 |
| ALT (U/L) | 14 (10, 22) | 14 (9, 21) | 15 (10, 23) | 0.018 |
| Chlorine (mmol/L) | 104 (100, 108) | 104 (101, 109) | 103 (100, 107) | <0.001 |
| Phosphorus (mmol/L) | 1.7 (1.4, 2.0) | 1.8 (1.5, 2.1) | 1.7 (1.4, 1.9) | <0.001 |
| Total Kt/V | 2.3 (1.9, 2.7) | 2.2 (1.8, 2.7) | 2.3 (1.9, 2.8) | <0.001 |
| Peritoneum Kt/V | 1.5 (1.2, 1.8) | 1.5 (1.1, 1.8) | 1.5 (1.2, 1.8) | 0.143 |
| Residual kidney Kt/V | 0.7 (0.4, 1.1) | 0.6 (0.4, 1.1) | 0.8 (0.5, 1.2) | <0.001 |
| RRF (mL/min/1.73m2) | 3.3 (2.0, 5.2) | 3.0 (1.8, 4.9) | 3.6 (2.2, 5.5) | <0.001 |
All continuous variables were skewed distribution, the values for continuous variables were given as P50 (P25, P75). Abbreviations: HRR, hemoglobin-to-red cell distribution width ratio; BMI, body mass index; GIB, gastrointestinal bleeding; CCB, calcium channel blocker; EPO, erythropoietin; ACEI/ARB, angiotensin converting enzyme inhibitor/angiotensin receptor blocker; FBG, fasting blood-glucose; ALT, alanine aminotransferase; Total Kt/V, K, dialyzer clearance of urea; t, dialysis time; V, volume of distribution of urea; RRF, renal residual function.
In the COX regression models, time at risk was from study entry until new-onset CVE, all-cause death, transferring to hemodialysis therapy, transferring to kidney transplantation, transferring to other centers, and losing to follow-up or censoring on December 31, 2016. Competitive risk analysis was used to exclude the effects of the above follow-up end events on new-onset CVE. The interaction between subgroup variables of interest, including sex, age, and history of hypertension or diabetes mellitus. A forest plot was used to show the relationship between HRR and new-onset CVE in each subgroup. The statistical analysis was completed using SPSS25.0 and R software (version R-4.2.2, www.project.org). All tests were performed bilaterally, and P<0.05 was considered statistically significant.
ResultsParticipantsA total of 1578 PD patients were included. The median follow-up period was 47 months. One hundred four (7.1%) new-onset CVEs were recorded. Other endpoints included transfer to hemodialysis (n=192), renal transplantation (n=82), transfer to other PD centers (n=11), all-cause death (n=364), and loss of follow-up (n=36). Finally,1474 patients were followed up to 31 December 2017. A comparison of baseline data of different HRR groups is shown in Table 1. The median age of the patients was 51 (40.0, 61.0) years old, of which 797 were female and 677 were male. A total of 305 (20.7%) of the patients had a history of diabetes, 1132 (76.8%) patients had a history of hypertension, 150 (10.2%) patients had a history of CVD, and 8 (0.5%) patients had a history of gastrointestinal bleeding (GIB). Compared to the higher group (HRR >5.835), the lower group (HRR ≤5.835) had fewer females and younger ages, additionally even had a lower prevalence of diabetes, hypertension, and CVD. Regarding treatments, the lower group had lower use of CCB, ACEI or ARBs, α-ketoacid, calcitriol, insulin, and stain but higher EPO and iron. The lower group also had higher creatinine, blood urea nitrogen, chlorine, and phosphorus.
Restricted cubic splinesRestricted cubic splines (RCS) were used to analyze the relationship between HHR and new-onset CVE, indicating a non-linear relationship between HHR and observed events (P=0.018) (Fig. 2). Therefore, we took HHR=5.835, namely the HRR value at HR=1, as the cutoff to divide patients into two groups.
. When HR=1, there was intersection point on the RCS curve. The HRR value of the intersection point, which equaled to 5.835, was taken as the cutoff. HR, hazard ratio; HRR, hemoglobin-to-red cell distribution width ratio; RCS, restricted cubic spline.")
Relationship between HRR and new-onset CVE by restricted cubic spline (RCS). When HR=1, there was intersection point on the RCS curve. The HRR value of the intersection point, which equaled to 5.835, was taken as the cutoff. HR, hazard ratio; HRR, hemoglobin-to-red cell distribution width ratio; RCS, restricted cubic spline.
Kaplan–Meier curves showed that more new-onset CVE (log-rank=9.721, P=0.002) occurred in the lower HRR group than in the higher HRR group (Fig. 3). Associations of HRR with new-onset CVE with defined models (with the higher HRR group as the reference group) were presented in Table 2. Multivariate COX regression showed that elevated HRR was an independent risk factor for new-onset CVE in PD patients after adjusting for age, sex, complications, and biochemical examination. For each one-unit increase of HRR, the risk of new-onset CVE increased by 1.737 times. Excluding patients with a history of CVD or extending the follow-up period to >6 months, HRR was still predictive (P=0.014; P=0.040, respectively). Patients with PD anemia may be on iron or EPO. HRR still impacted new-onset cardiovascular outcomes in patients with PD after excluding patients on iron and/or EPO (P=0.015; P=0.014; P=0.016, respectively). The hazard ratios and P-values for complete factors were put in Table S1. Hb affected new cardiovascular events in this PD population (P=0.047); however, RDW did not show a better predictive role in this PD population (P=0.165) (Table S2). In competitive risk models, the estimated cumulative incidence curves demonstrated significant differences in different HRR groups for new-onset CVE (P=0.0009) and all-cause mortality (P=0.00004) but not for the occurrence of other events (being transferred to hemodialysis therapy, being transferred to kidney transplantation, being transferred to other centers, being lost to follow-up) (Fig. 4).
 had a higher risk of new-onset CVE (log-rank P = 0.002). CVE, Cardiovascular Events; HRR, hemoglobin-to-red cell distribution width ratio.")
The Kaplan–Meier curves with new-onset CVE by category of the level of HRR. The curves were constructed using the Kaplan–Meier method and compared using the Mantel–Cox log-rank test. Patients in the low HRR group (HRR ≤5.835) had a higher risk of new-onset CVE (log-rank P = 0.002). CVE, Cardiovascular Events; HRR, hemoglobin-to-red cell distribution width ratio.
HRR predicts the prognosis of new-onset CVE in PD patients.
| Group 1 HR (95% CI) | P value | |
|---|---|---|
| New-onset CVE | ||
| Unadjusted | 1.881 (1.256, 2.817) | 0.002 |
| Model 1 | 1.997 (1.331, 2.995) | 0.001 |
| Model 2 | 1.738 (1.140, 2.651) | 0.010 |
| Model 3 | 1.737 (1.119, 2.695) | 0.014 |
Reference group was the higher HRR group (HRR >5.835); model 1: sex, age, BMI; model 2: model 1 plus comorbidities (hypertension, diabetes mellitus, history of CVE, history of gastrointestinal bleeding) and treatments (CCB, ACEI/ARB, EPO, iron, α-ketoacid, calcitriol, insulin, aspirin, statin); model 3: model 2 plus laboratory variable (alkaline phosphatase, creatinine, urea nitrogen, serum uric acid, FBG, ALT, chlorine, phosphorus, total Kt/V, peritoneum Kt/V, residual kidney Kt/V and RRF.
Abbreviations: CVE, cardiovascular events; BMI, body mass index; CCB, calcium channel blocker; EPO, erythropoietin; ACEI/ARB, angiotensin converting enzyme inhibitor/angiotensin receptor blocker; FBG, fasting blood-glucose; ALT, alanine aminotransferase; Total Kt/V, K, dialyzer clearance of urea; t, dialysis time; V, volume of distribution of urea; RRF, renal residual function; HR, hazard ratio; CI, confidence interval.
 and the CVD mortality (P<0.001), while there is no statistical significance for the occurrence of other competing events (being transferred to hemodialysis therapy, being transferred to kidney transplantation, being transferred to other centers, being lost to follow-up). New-onset CVE, New-onset Cardiovascular Events; HRR, hemoglobin-to-red cell distribution width ratio.")
Competitive risk models. Estimated cumulative incidence curves between the new-onset CVE and other competing events for each HRR group. The cumulative incidence curves for different HRR groups are highly significant for the new-onset CVE (P=0.0009) and the CVD mortality (P<0.001), while there is no statistical significance for the occurrence of other competing events (being transferred to hemodialysis therapy, being transferred to kidney transplantation, being transferred to other centers, being lost to follow-up). New-onset CVE, New-onset Cardiovascular Events; HRR, hemoglobin-to-red cell distribution width ratio.
Fig. S1 shows the subgroup analysis based on diabetes, hypertension, gender, and age. The forest plot indicates that no interaction was found between the subgroups.
Sensitivity analysesFour study groups were reclassified by the median values of hemoglobin (85g/L) and red cell distribution width (14.4%) as follows: group A (n=346), hemoglobin ≤85 and red cell distribution width ≤14.4%; group B (n=319), hemoglobin ≤85 and red cell distribution width >14.4%; group C (n=309), hemoglobin >85 and red cell distribution width ≤14.4%; group D (n=285), hemoglobin >85 and red cell distribution width >14.4%. The repeated Kaplan–Meier curves showed statistical significance between the redefined four groups and new-onset CVE (Fig. 5). Moreover, in the first 140 months of the follow-up period, the patients in group B (n=399), with hemoglobin ≤85 and red cell distribution width >14.4%, had the highest risk of new-onset CVE than those with good hemoglobin and red cell distribution width level.
 and RDW (14.4%). The repeated Kaplan–Meier curves showed the statistical significance of the association between the redefined groups and new-onset CVE (log-rank P=0.002). CVE, Cardiovascular Events; Hb, Hemoglobin; RDW, Red cell Distribution Width.")
Sensitivity analyses. The whole cohort was categorized into four groups by the median values of Hb (85g/L) and RDW (14.4%). The repeated Kaplan–Meier curves showed the statistical significance of the association between the redefined groups and new-onset CVE (log-rank P=0.002). CVE, Cardiovascular Events; Hb, Hemoglobin; RDW, Red cell Distribution Width.
This retrospective study assessed the correlation between hemoglobin and erythrocyte distribution width. We found that these two factors had a synergistic effect on new cardiovascular events in patients with PD. After adjusting for age, sex, comorbidities, and hematology, we found that patients with lower HRR levels were at a higher risk of new cardiovascular events. The robustness of our study was further strengthened by competing risk modeling, which confirmed this association. Additional sensitivity analyses, using median values for reclassification, implied that patients with low hemoglobin and high erythrocyte distribution width were at a higher risk of new cardiovascular events during the first 140 months of the follow-up period. These findings have significant implications for managing and treating patients with PD.
In PD patients, HRR likely integrates multiple pathological pathways: (1) chronic inflammation induced by uremia and peritoneal dialysis upregulates hepcidin, impairing iron utilization and erythropoiesis (thereby reducing Hb)14–16; (2) oxidative stress triggered by glucose degradation products (GDPs) in dialysis solutions accelerates erythrocyte aging, elevating RDW17; (3) these processes collectively promote endothelial dysfunction and atherosclerosis, amplifying CVE risk.18–20 Prior studies in non-PD populations (e.g., coronary artery disease21 and contrast-induced nephropathy22) have highlighted HRR's broad prognostic utility. However, our findings uniquely emphasize its relevance in PD, where chronic inflammation and dialysis-related oxidative stress may intensify the HRR-CVE link.
More studies are needed on the prognostic impact of lower HRR on PD patients. In the Cox regression model, the indicator of HRR still predicts the outcome of new-onset CVE after iron and EPO were excluded separately and combined in this study. However, the effect of medication on this outcome still cannot be entirely excluded because the data collected in this study were baseline data, and the specific medication use regimen was unknown. The presence or absence of previous CVE did not affect new-onset CVE in PD patients with >6 months of follow-up. Low HRR remained predictive of new-onset CVE in PD patients. The difference in RDW alone was not statistically significant and may be related to the small amount of data. However, the fact remains that in patients with CAD, the predictive utility of RDW is that it represents the sum of the adverse effects of inflammation and oxidative stress, among others, on bone marrow erythropoietic function. In contrast, the predictive utility of Hb is the sum of the decrease in the oxygen-carrying function of hemoglobin. Thus, the prognostic value of HRR reflects the exacerbation of these phenomena.5 Subgroup analyses revealed that PD patients with low HRR in older age (≥60 years) and hypertensive subgroups had a higher incidence of new-onset CVE. However, no statistically significant differences were observed across sex, age, hypertension, or diabetes subgroups, possibly due to insufficient clinical sample size. This does not imply that subgroup factors lack influence on outcomes, as hypertension is an established high-risk factor for CVD.23
Our study has several strengths, including a large PD cohort (n=1474) and rigorous adjustment for confounders. It confirms previous findings that HRR is a crucial determinant of CVE. Also, to the best of our knowledge, this groundbreaking study uniquely investigates the synergistic effect of Hb and RDW on new-onset CVE in PD patients. In addition, the interaction of Hb and RDW with CVE was evaluated using a sensitivity analysis. This study also has some limitations: firstly, it is a retrospective study, which can only conclude the association between HRR and CVE, but not the causality; secondly, it is limited to analyzing only the baseline level of Hb and RDW without considering the dynamic changes of both, and a one-time measurement may not fully reflect the trend of the changes in blood parameters; thirdly, although the multivariate-adjusted COX model was performed, some unknown or uncollected risk factors may impact the cardiovascular event endpoints, and therefore, the effects of residual confounders cannot be eliminated; fourthly, HRR, as an inexpensive and readily available indicator, and its potential role need to be confirmed in the future by multicenter prospective studies with relatively scientific grouping methods.
In conclusion, our findings suggest that HRR could serve as a practical and cost-effective biomarker for screening new-onset cardiovascular events in PD patients. However, further mechanistic studies are needed to elucidate its underlying pathways and optimize its clinical application.
CRediT authorship contribution statementRW: conceived of or designed study and wrote the paper; WYZ: data analysis and data collection; NT: analyzed data and collected the data; XJZ, FFP, XYW, QDX, NS, JW, XRF, XFW, ZYX: collected the data; XMT: contributed new methods or models; QZ: assist in analyzed data; JBL: managed the data; YQW: developed the project and wrote the paper and provide funds.
Ethics and consent to participateAll procedures involving human participants in this study adhered to the 1964 Declaration of Helsinki and its subsequent amendments or similar ethical standards. This study complied with ethical standards (Ethics Review Board Approval Number: No. 2024-YJS-ks-17) and was approved by the Institutional Review Board of The Second Affiliated Hospital, Guangzhou Medical University. Notably, the institutional ethical committee exempted the participants from the obligation of informed consent because there was no intervention for the participants in this study, and there were no associated risks. All study participant data were obtained from hospital inpatient information and used as anonymized.
Consent to participate and publicationOwing to we had collected the existing medical records, written informed consent was not required.
Consent for publicationThe data released by our research would not compromise anonymity or confidentiality, nor violate local data protection laws. The researchers disclosed no names or other identifying information related to respondents and their parents or guardian in this manuscript.
Geolocation informationThe research conducted in this study focuses on China.
FundingThis study was supported by the grants: Guangzhou Key Discipline of Urology; Second Affiliated Hospital of Guangzhou Medical University Fund Project (2021-LCYJ-04). Clinical Research Project of the Second Affiliated Hospital of Guangzhou Medical University (2021-LCYJ-DZX-03, 2022-LCYJ-YYDZX-03).
Declaration of competing interestThe authors declared that they had no financial conflicts of interest.
Data availabilityAll data generated or analyzed during this study are included in this published article.
The authors are grateful to all the participants in this study.
The following are the supplementary data to this article:


