The sodium gradient during hemodialysis sessions is one of the key factors in sodium balance in patients with dialysis-dependent chronic kidney disease; however, until the appearance of the new monitors with sodium modules, the differences between prescribed and measured sodium have been understudied. The present study aimed to compare the impact on the measured conductivity and the initial and final plasma sodium after changing the 5008 Cordiax to the new 6008 Cordiax monitor.
Material and methods106 patients on hemodialysis were included. Each patient underwent 2 dialysis sessions in which only the monitor was varied. The variables collected were dialysate, sodium and bicarbonate prescribed, real conductivity, initial and final plasma sodium measured, and the calculated sodium gradient (ΔPNa).
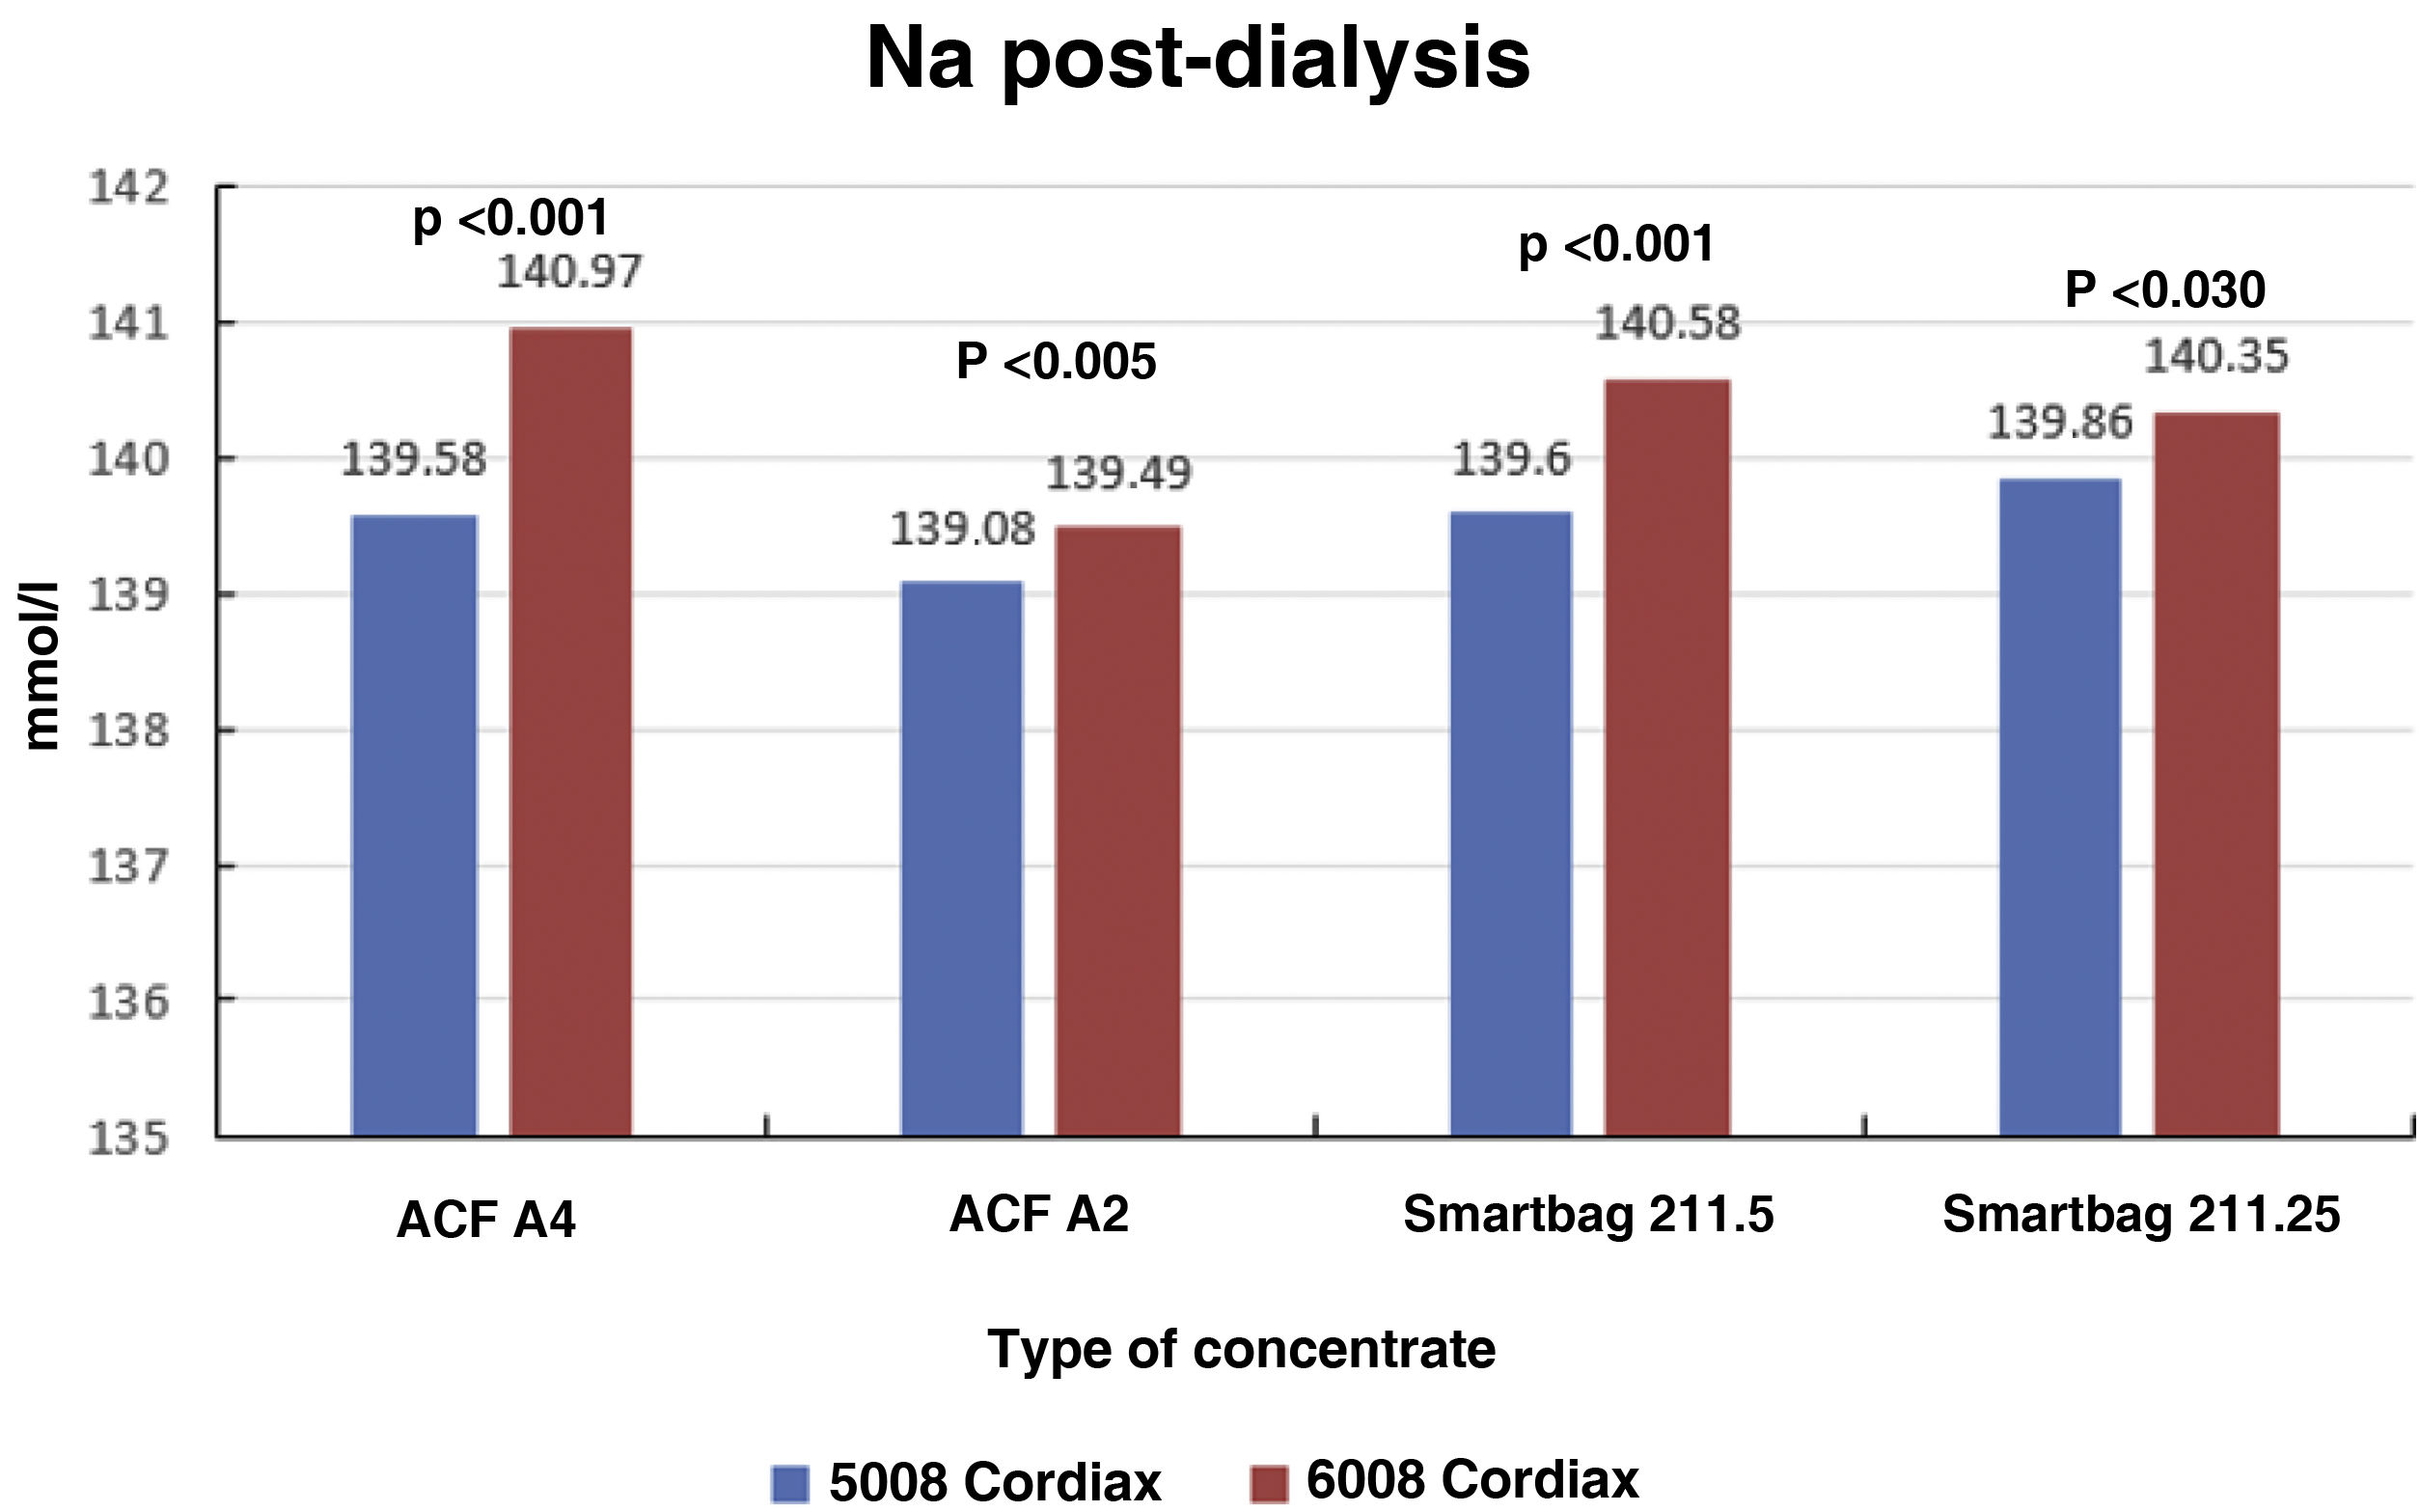
ResultsThe change of dialysis monitor showed small but statistically significant differences in the initial (138.14mmol/L with 5008 vs. 138.81mmol/L with 6008) and final plasma sodium (139.58mmol/L vs. 140.97mmol/L), as well as in the actual conductivity obtained (13.97 vs. 14.1mS/cm). The ΔPNa also increased significantly.
ConclusionThe change from 5008 to 6008 monitor is associated with increased conductivity, leading the patient to end the sessions with higher plasma sodium and ΔPNa. Knowing and confirming this change will allow us to individualize the sodium prescription and avoid possible undesirable effects. It could be the preliminary study to explore the new sodium biosensor incorporated into the new generation of monitors.
El gradiente de sodio durante las sesiones es uno de los factores clave en el balance de este ion en los pacientes en hemodiálisis; sin embargo, hasta la aparición de los nuevos monitores con módulos de sodio, las diferencias entre el sodio prescrito y el medido han sido poco estudiadas. El objetivo del presente estudio fue comparar el impacto del cambio del monitor 5008 Cordiax al nuevo monitor 6008 Cordiax sobre los resultados de la conductividad real medida, del sodio plasmático inicial y final.
Material y métodosSe incluyeron 106 pacientes en hemodiálisis. Cada paciente recibió 2 sesiones de diálisis en la que solo se varió el monitor. Las variables recogidas fueron: el concentrado, sodio y bicarbonato prescritos, conductividad real, sodio plasmático inicial y final medidos por dialisancia iónica y se calculó el cambio de la concentración de sodio plasmático durante el tratamiento o delta de sodio (ΔPNa).
ResultadosEl cambio de monitor de diálisis mostró pequeñas diferencias, aunque significativas, en el sodio plasmático inicial (138.14mmol/L con 5008 vs 138.81mmol/L con 6008) y final (139.58mmol/L vs 140.97mmol/L), así como en la conductividad real obtenida (13,97 vs 14,10mS/cm). El ΔPNa también aumento significativamente.
ConclusiónEl cambio de monitor 5008 a 6008 se asocia a un aumento en la conductividad, un sodio plasmático más elevado y un incremento en el ΔPNa. El conocer y confirmar este cambio permitirá individualizar la prescripción de sodio, evitar posibles efectos indeseables y podría ser el estudio preliminar para explorar el nuevo biosensor de control de sodio incorporado en la nueva generación de monitores.
Sodium (Na) is the main extracellular ion which defines osmolarity and the amount of extracellular volume. The Na prescription in the dialysate is one of the key points in dialysis treatment.1 Hyponatraemia (Na<136mmol/l) is associated with higher mortality rates in the dialysis population,2–5 and more recently, higher rates of mortality have also been associated with variation in Na concentration during dialysis sessions, that is, the difference between final and initial serum Na, also referred to as delta sodium (ΔSNa).6
The Na balance in the haemodialysis patient depends essentially on salt intake and its removal during the dialysis session. Na loss during haemodialysis (HD) is essentially at the expense of convection (ultrafiltration related to interdialysis weight gain) and, to a lesser extent, diffusion, in relation to the gradient between the patient's serum Na and the prescribed Na in the dialysate.7 A positive Na gradient during HD favors haemodynamic stability, reduces the risk of intradialytic hypotension and helps to maintainan adequate perfusion of vital organs.8 However, it leads to increased osmolarity, increased thirst and increased extracellular volume and, consequently, hypertension and increased left ventricular hypertrophy, and it is associated with adverse cardiovascular effects.1 Conversely, a negative Na gradient with low Na prescriptions has been associated with reduced interdialysis weight gain and blood pressure control with an increase in episodes of intradialytic hypotension and tissue hypoperfusion.8
The measurement of the conductivity of the dialysate by the monitor is essential, foremost for safety, as it ensures the proper mixing of acid concentrate, bicarbonate and treated water. Moreover, the conductivity of the dialysate is fully related to the Na in the dialysate, as it is the main determinant, such that a 1mmol/l variation in Na is normally associated with a 0.1mS/cm variation in conductivity. Individualisation or adjustments in Na prescription during HD are reflected in the dialysate conductivity measured by the dialysis monitor, which displays the measurement in real time, regardless of the theoretical or expected conductivity it should have.
The physician prescribes a dialysis concentrate and can personalise the sodium and/or bicarbonate concentration. However, the dialysis machine does not measure sodium, but conductivity, so by way of an algorithm which links sodium and conductivity for the chosen concentrate formula, it produces a dialysis fluid with that conductivity and, it is assumed, with the prescribed sodium concentration. A issue that has not been sufficientlty evaluated is the relationship between the prescribed dialysate Na or conductivity and that measured by the dialysis monitor, since they are assumed to be the same. Ng et al.9 reported that the Na measured in the dialysate was almost 2mmol/l lower than prescribed, depending on the type of dialysis machine or type of concentrate, concluding that the Na prescription requires more precision in terms of the final result obtained in the dialysate.
Recently, the introduction of dialysis machines with control modules of dialysate sodium, which attempt to prevent differences between the prescribed sodium and that obtained using an automated dialysate Na individualisation system,10 has raised interest in the subject. As a preliminary assessment, the aim of this study was to compare the outcome of switching from the 5008 Cordiax monitor to the new 6008 Cordiax monitor (Fresenius Medical Care AG & Co., Bad Homburg, Germany), which has this module, on dialysate conductivity and initial and final serum Na concentrations.
Material and methodsSingle-centre observational study in patients in a long-term HD programme. There were 106 patients included (69 males and 37 females) with a mean age of 68.6±16 years (range 19–96 years) who were on HD for a mean of 40±45 months (range 3–314 months). The aetiology of chronic kidney failure was: 14 chronic glomerulonephritis; 14 diabetic nephropathy; 11 polycystic kidney disease; 27 vascular nephropathy; 4 tubulointerstitial nephropathy; 12 urological causes; 5 cardiorenal syndrome; 3 systemic disease; and 16 with unidentified aetiology. Patients were dialyzed through an arteriovenous fistula in 65% of patients, a prosthetic fistula in 4% and a tunnelled central catheter in the remaining 31%.
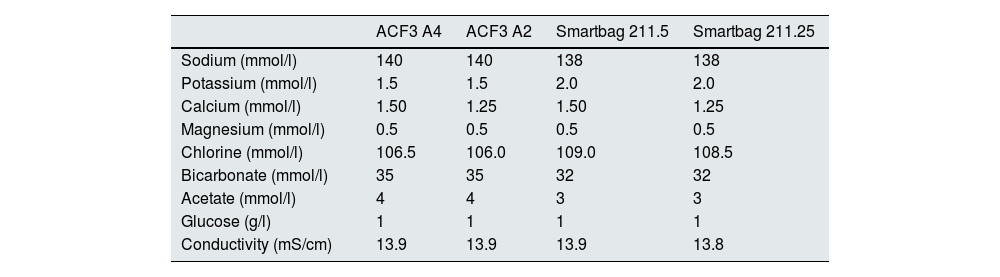
Each patient had two treatment sessions with the same dialysis prescription, and the only variation was the use of the 5008 Cordiax vs the 6008 Cordiax monitor. The prescription of acid concentrate and the sodium and bicarbonate concentration were constant for each patient. The individualised prescription was done through the Nefrolink software program (Fresenius Medical Care España S.A.U., Madrid, Spain), which automatically transmits the prescription directly to the dialysis machine. Dialysis parameters were kept constant in each session: dialysis time 319±72min (240−480min); blood flow (Qb) 417±33min (300−450min); dialysate flow (Qd) 400ml/min; haemodiafiltration modality in 94% and expanded hemodialysis in the remaining 6%. The dialysis parameters recorded in each session were: type of concentrate; Na and bicarbonates prescribed in the dialysate; actual dialysate conductivity measured by the monitor; estimated initial and final plasma Na measured by the dialysis monitor using the ionic dialysance module biosensor; and, finally, calculation of the difference between initial and final Na or delta Na (the ΔSNa). Four types of dialysis concentrates were used: ACF3 A4 (39%) in 41; ACF3 A2 (10%) in 11; Smartbag 211.5 (42%) in 44; and Smartbag 211.25 (9%) in 10. The full electrolyte composition of the dialysis concentrates used is shown in Table 1. At the beginning of the study, the conductivities obtained in both machines were measured by an external conductivity meter, confirming that the conductivity measurements obtained by the monitor corresponded to a real measurement.
Composition of the dialysate concentrates used in the study from the Summary of Product Characteristics.
| ACF3 A4 | ACF3 A2 | Smartbag 211.5 | Smartbag 211.25 | |
|---|---|---|---|---|
| Sodium (mmol/l) | 140 | 140 | 138 | 138 |
| Potassium (mmol/l) | 1.5 | 1.5 | 2.0 | 2.0 |
| Calcium (mmol/l) | 1.50 | 1.25 | 1.50 | 1.25 |
| Magnesium (mmol/l) | 0.5 | 0.5 | 0.5 | 0.5 |
| Chlorine (mmol/l) | 106.5 | 106.0 | 109.0 | 108.5 |
| Bicarbonate (mmol/l) | 35 | 35 | 32 | 32 |
| Acetate (mmol/l) | 4 | 4 | 3 | 3 |
| Glucose (g/l) | 1 | 1 | 1 | 1 |
| Conductivity (mS/cm) | 13.9 | 13.9 | 13.9 | 13.8 |
The results were expressed as the mean±standard deviation. For the analysis of the statistical significance of quantitative parameters, we used Student's t-test for paired data and Spearman's correlation coefficient. The ΔSNa, both pre- and post-dialysis, was separated into four groups: <0; 0–1.99; 2–3.99; and ≥4mmol/l. Differences in the distribution of cases in these groups between the two monitors were analysed using Pearson's χ2 test. A P-value of <.05 was considered statistically significant. Statistical analyses were performed with the software program SPSS Statistics version 23 (IBM Corp., Armonk, NY, USA).
ResultsAll dialysis sessions were performed without any clinical incident of note, with no episodes of intradialysis hypotension requiring volume replacement and no symptoms of cramps or thirst.
Most patients received an individualised bicarbonate prescription, especially those using ACF3 A4 and ACF3 A2 concentrate, in which bicarbonate was decreased from 35 to 32mmol/l and Na from 140 to 139mmol/l, to maintain a theoretical conductivity of 13.9mS/cm. The final Na prescription distribution was 138mmol/l in 18%, 139 in 69% and 140mmol/l in the remaining 13%. The bicarbonate distribution was 32mmol/l in 82%, 33 in 8%, 34 in 7% and 35mmol/l in the remaining 3%, which would be equivalent to a theoretical conductivity of around 13.9mS/cm, as can be seen in the composition of the dialysate concentrates used in the study taken from their Summary of Product Characteristics (Table 1).
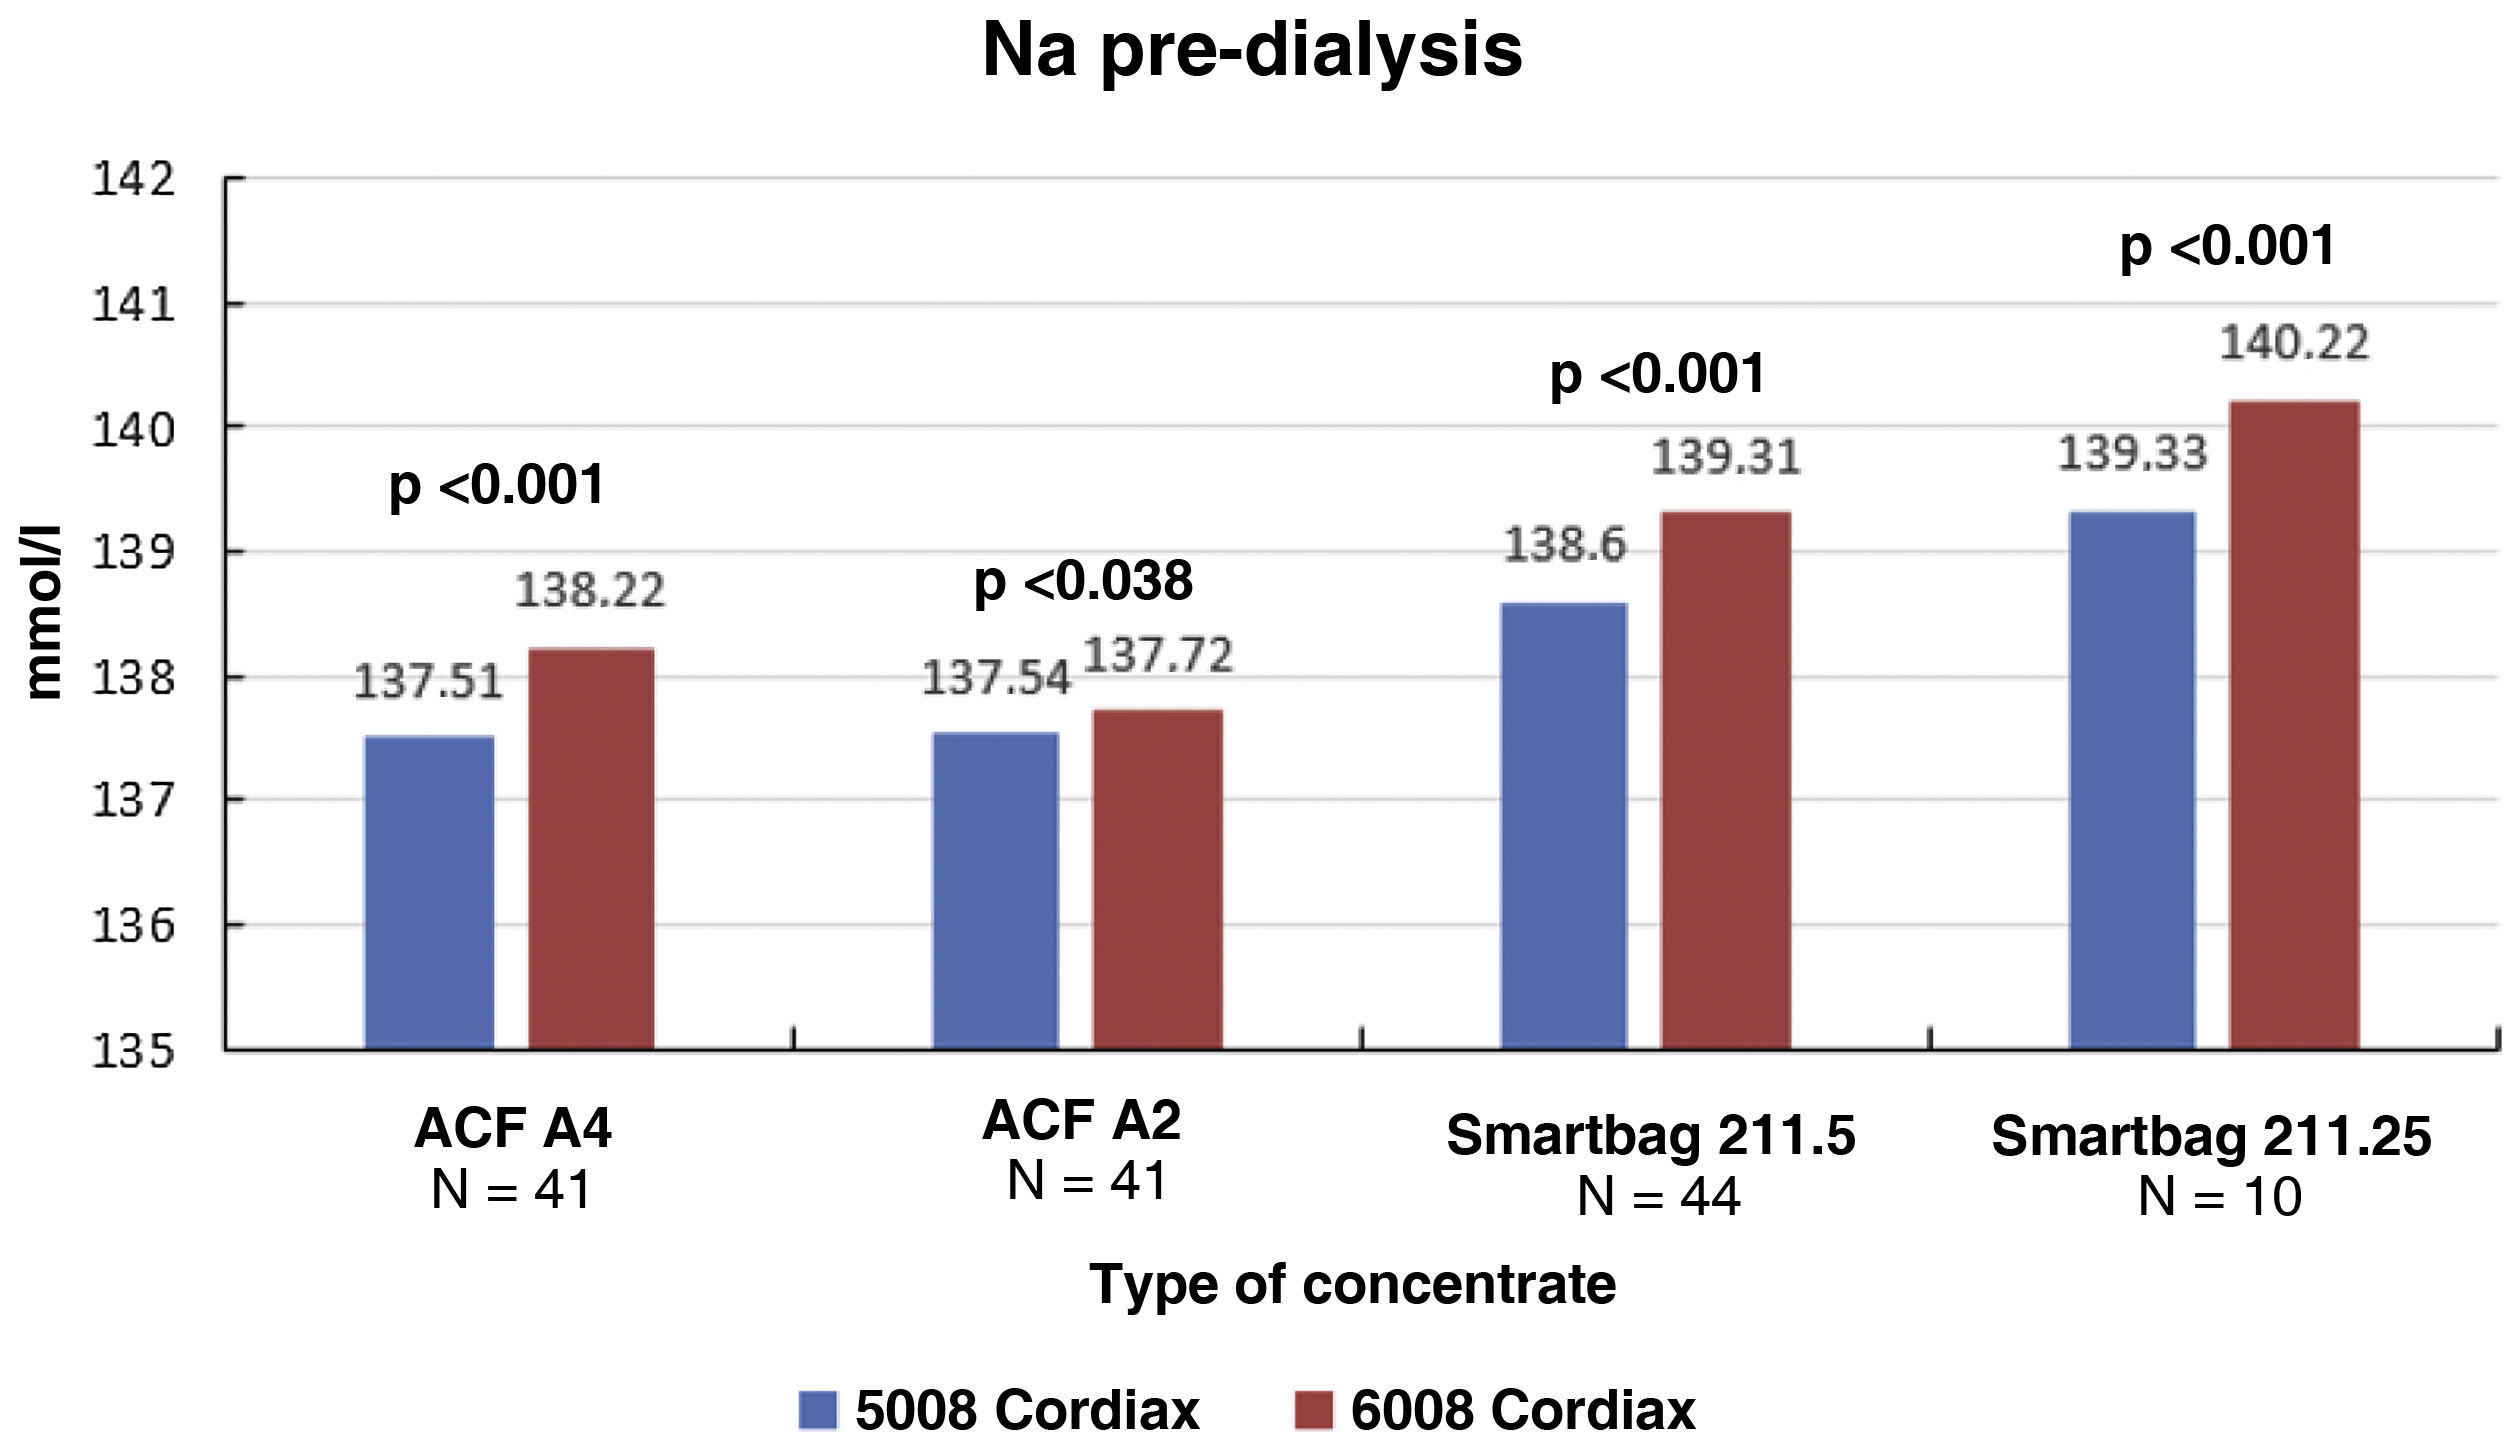
The change in dialysis monitor showed small but significant differences in the initial serum Na calculated by the monitor, 138.14±1.95mmol/l with monitor 5008 vs 138.81±2.69mmol/l with monitor 6008 (P<.001), with these differences being maintained regardless of the type of concentrate used (Fig. 1). There was a good correlation between baseline serum Na values between the two monitors (Nainitial5008=0.509×Nainitial6008+67.45, R=0.702, P<.001).
. Differences between pre-dialysis serum sodium according to the type of concentrate used.")
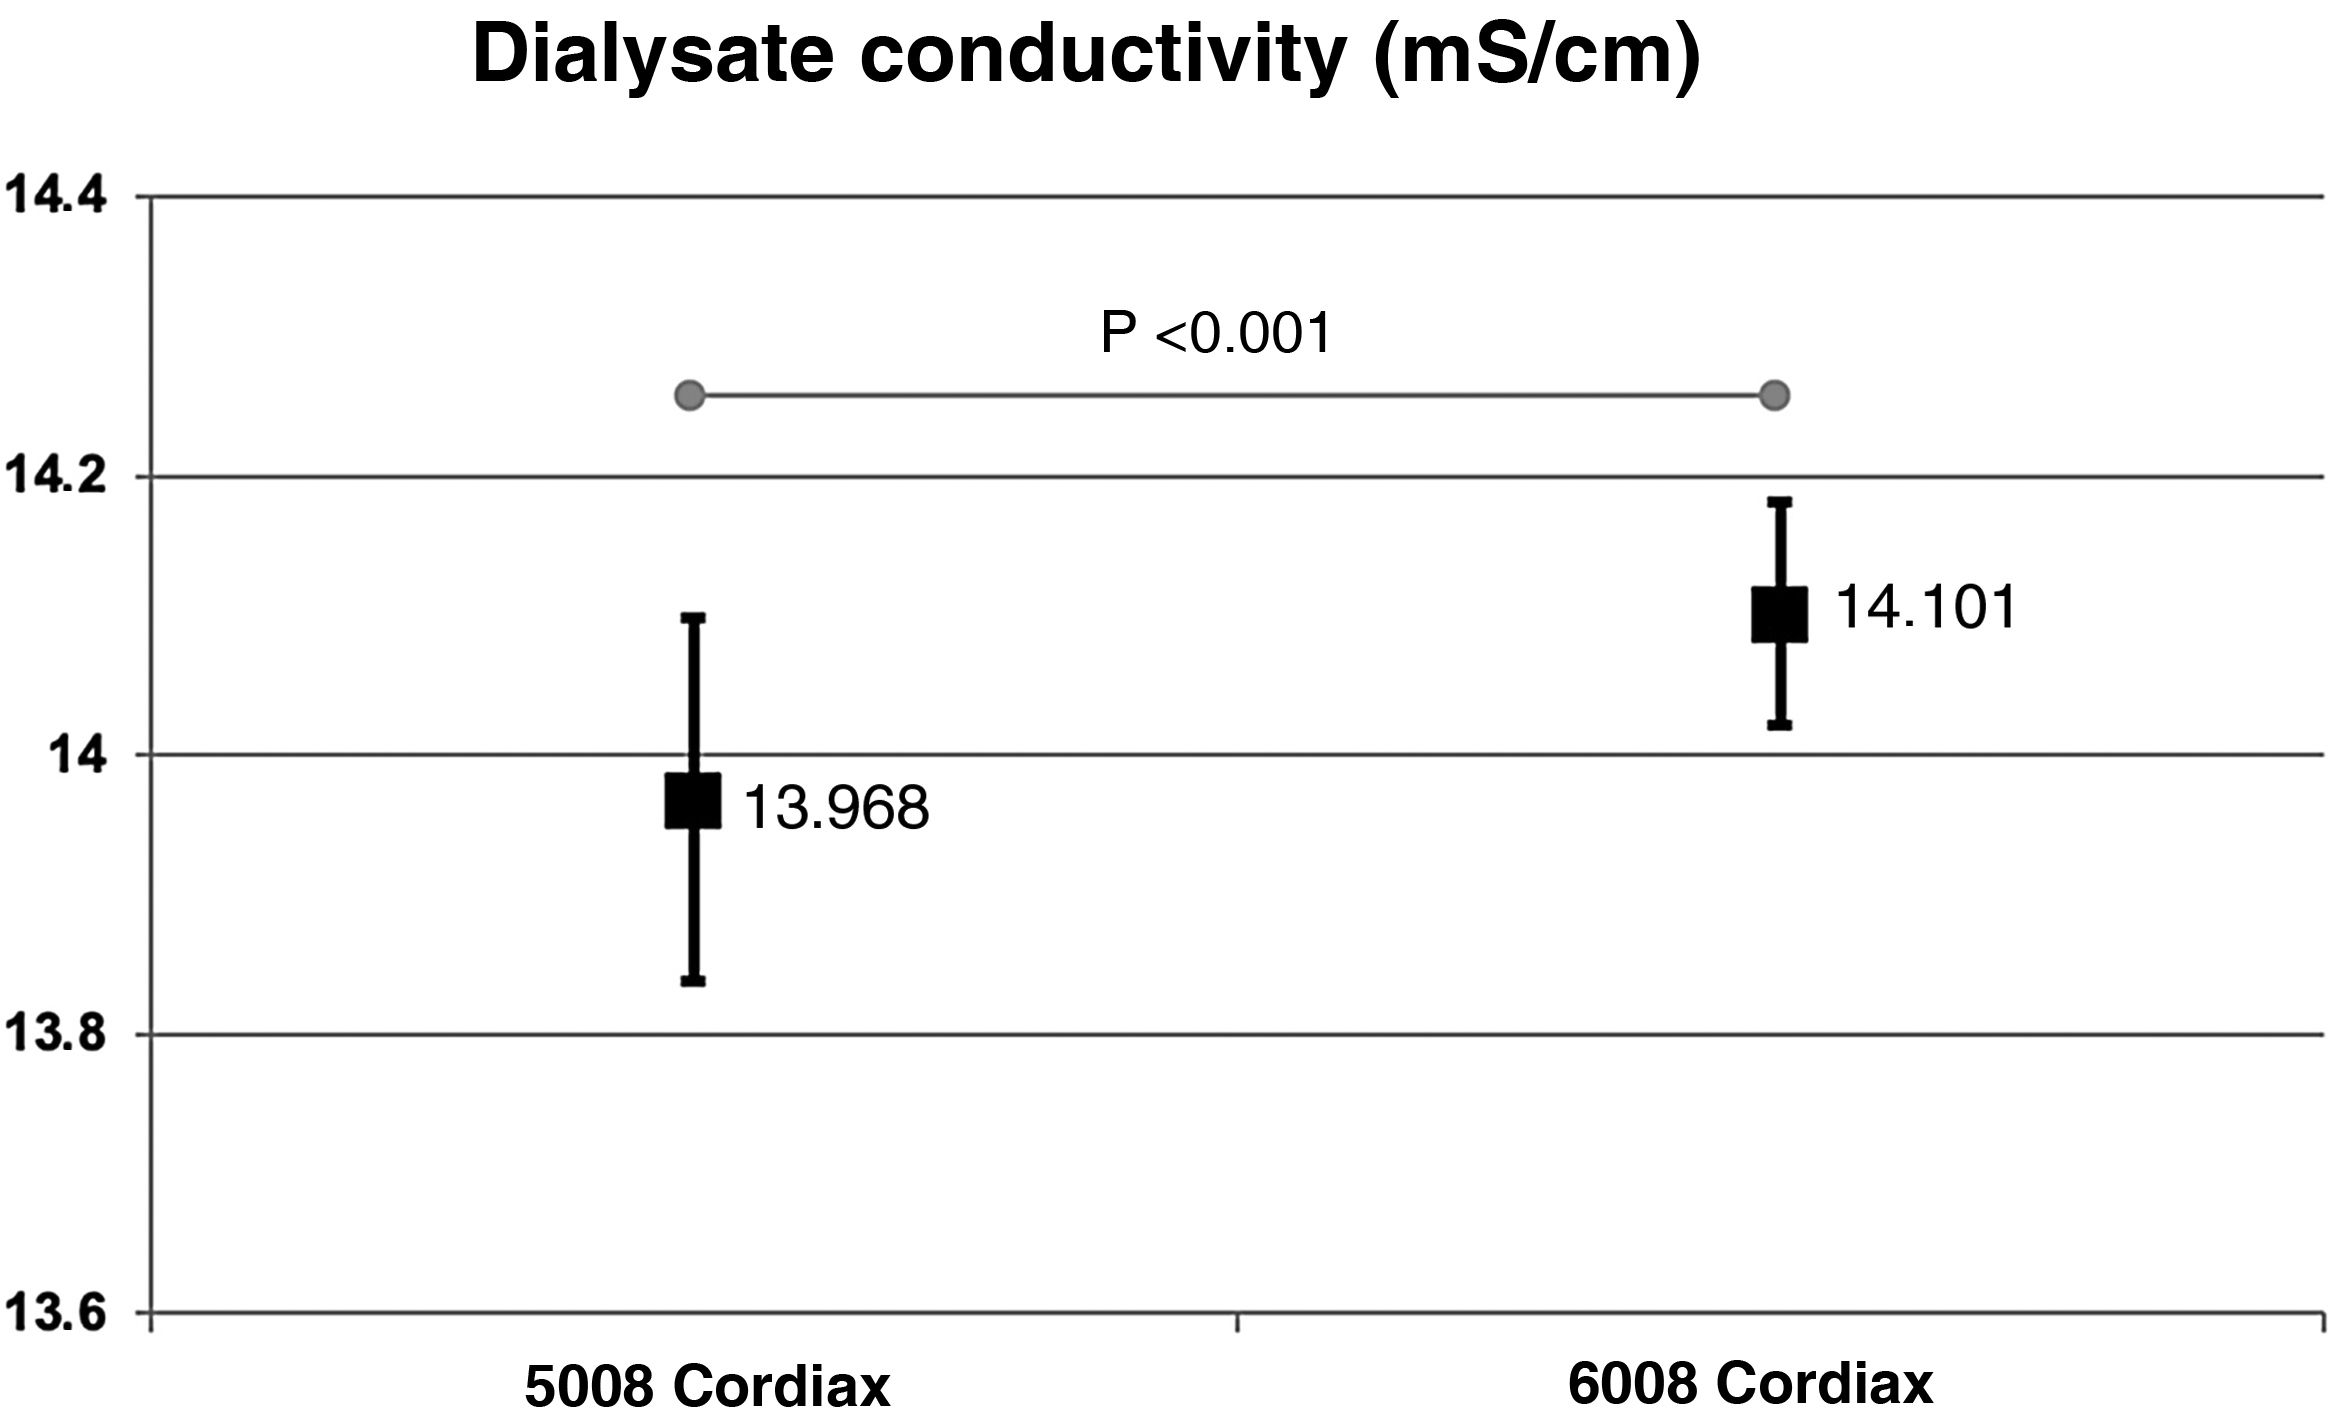
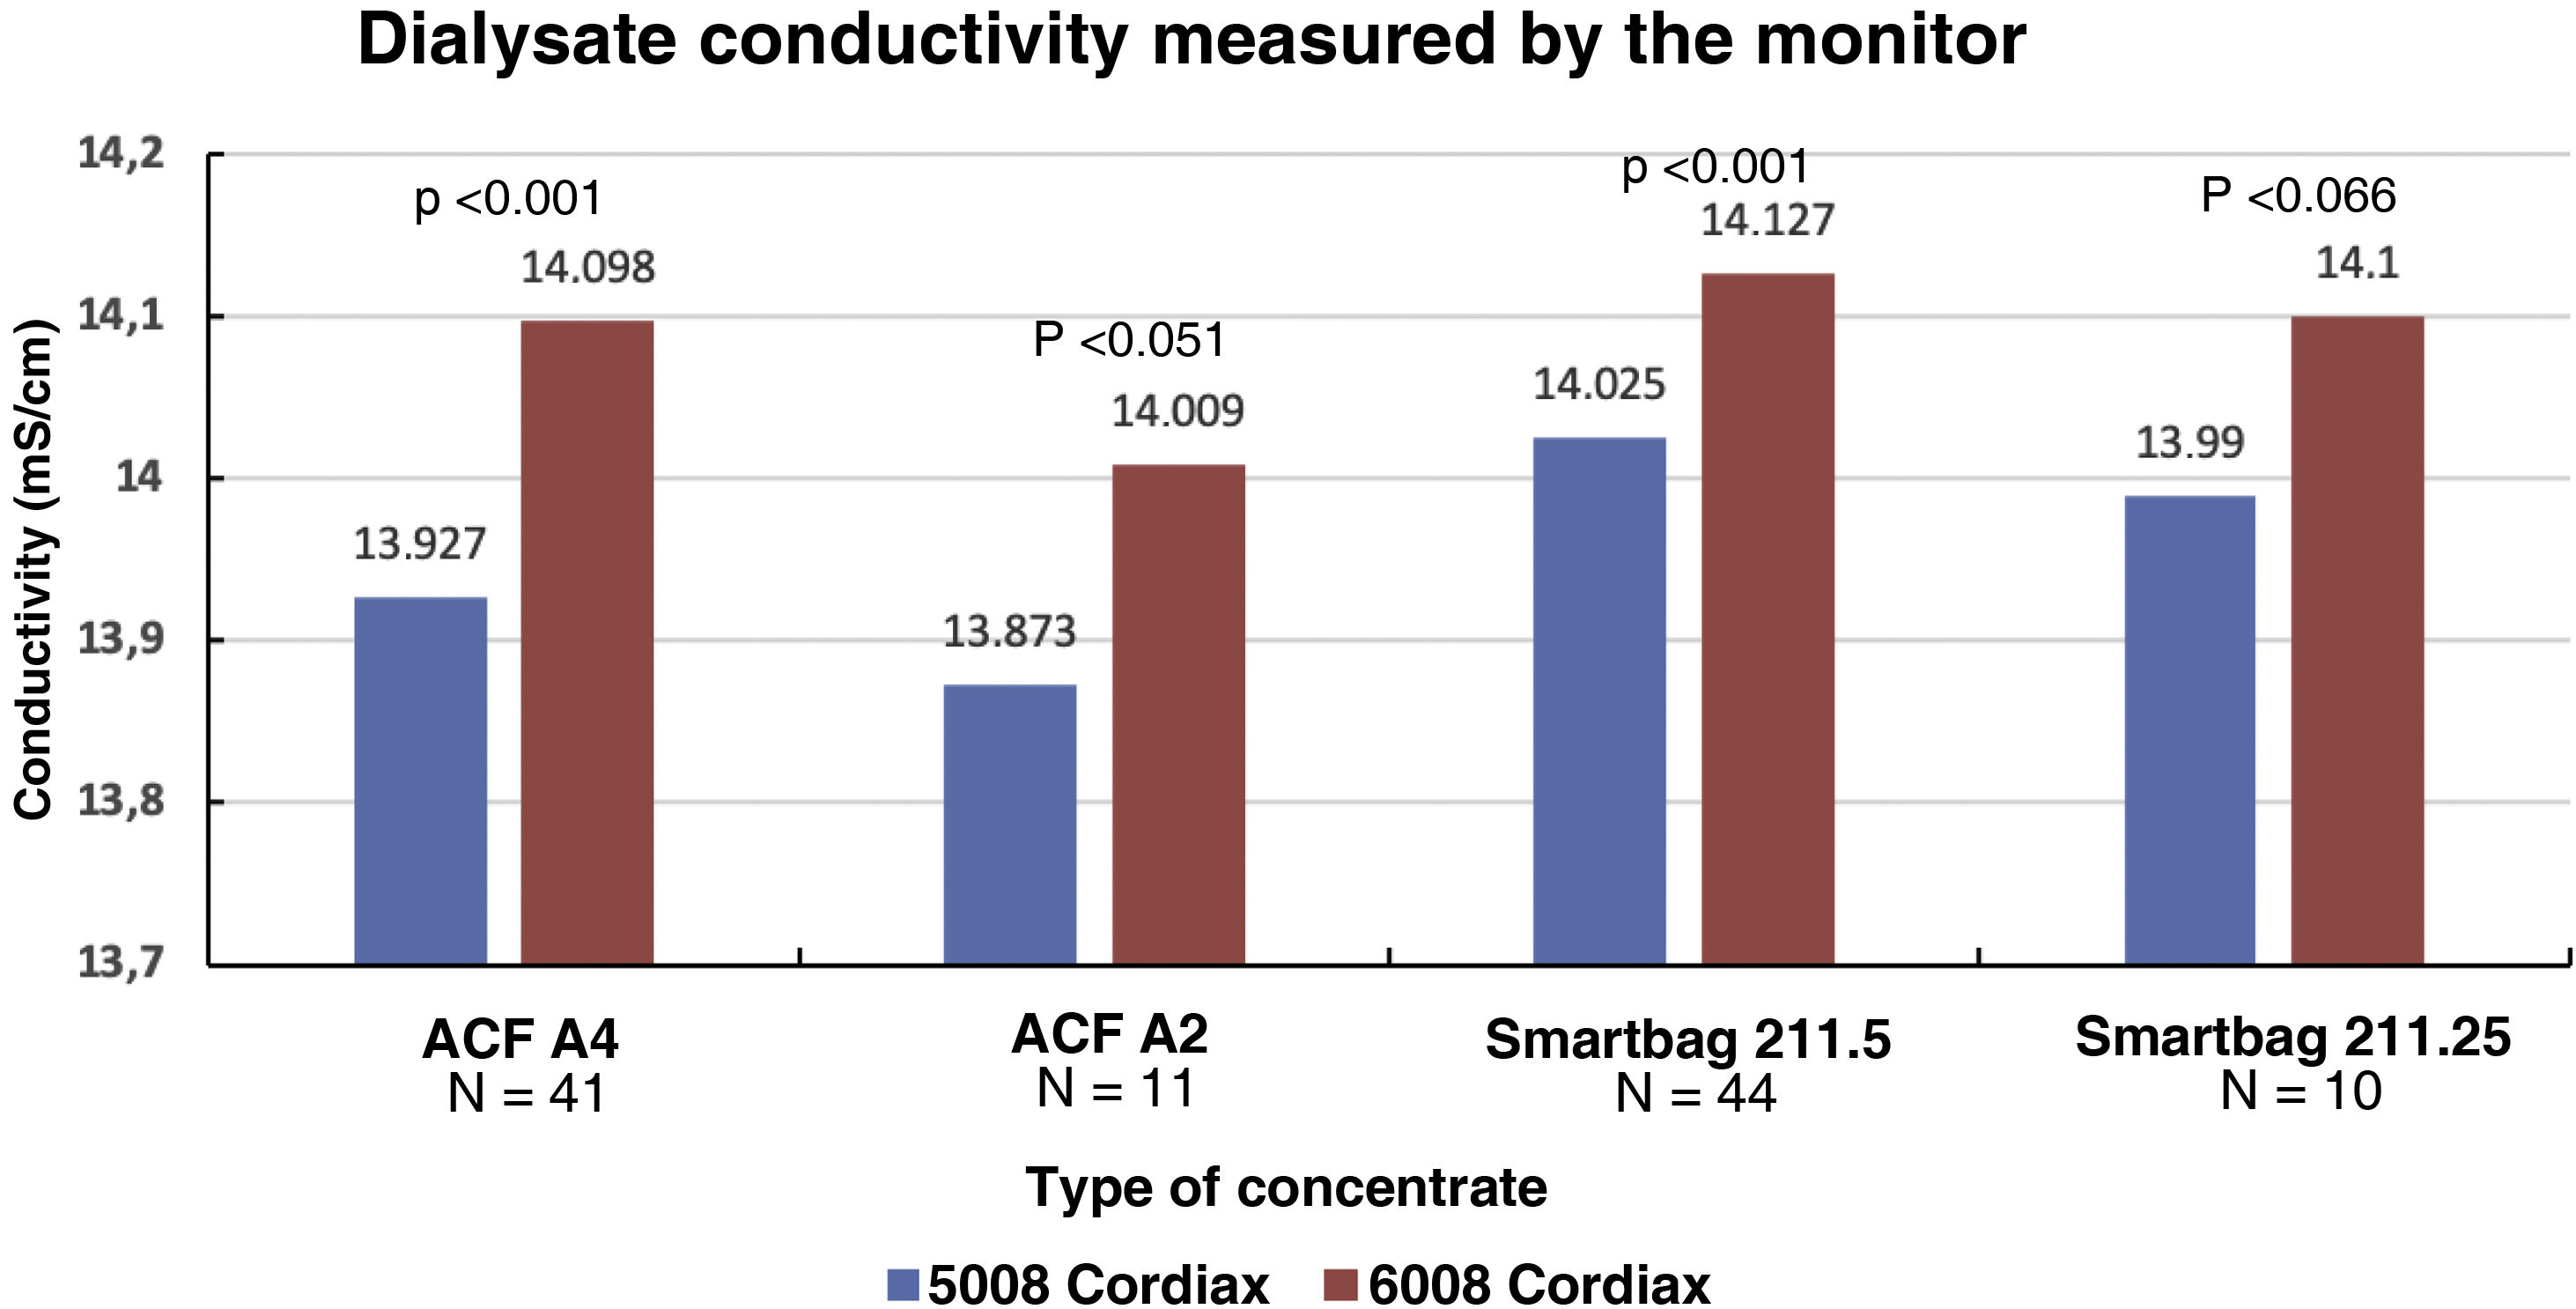
The change in dialysis monitor showed significant differences in the dialysate conductivity measured by the dialysis monitor (Fig. 2). Conductivity increased when switching to the 6008 monitor, despite maintaining the same treatment and concentrate prescription. These differences were maintained regardless of the concentrate used (Fig. 3).
.")
.")
Consequently, there were also significant differences between the two monitors in final serum Na (139.58±1.27mmol/l with monitor 5008 vs 140.97±0.88mmol/l with monitor 6008 [P<.001]), these differences also maintained regardless of the type of concentrate used (Fig. 4). There was also a significant correlation between final serum Na values between the two monitors (Nainitial5008=0.68×Nainitial6008+43.97, R=0.57, P<.001).
.")
The mean ΔSNa values were 1.426±1.67mmol with monitor 5008 vs 1.793±2.57 with monitor 6008, P=.037. The distribution of ΔSNa was less than 0mmol/l in 19 patients (17.9%) vs 26 (24.5%); between 0 and 1.99mmol/l in 44 patients (41.5%) vs 30 (28.3%); between 2 and 3.99mmol/l in 36 patients (34%) vs 25 (23.6%); and above 4mmol/l in seven patients (6.6%) vs 25 (23.6%), with the 5008 vs 6008 monitors respectively (P<.001, χ2 test).
DiscussionThis study shows that switching dialysis monitor from the 5008 to the 6008 leads to an increase in dialysate conductivity and pre- and post-dialysis serum Na values. This increase in osmolarity and serum Na at the end of the session may have clinical implications and be associated with increased thirst, increased interdialysis gain and, consequently, changes in blood pressure. However, knowing about this change allows the Na prescription to be adjusted to maintain conductivity levels similar to previous values. This would be the first step or starting point for being able to use the new dialysate Na control biosensor incorporated in the new generation of 6008 monitors which, with their automated Na adjustment, try to keep the diffusive Na balance to a minimum during the session.10
Dialysate is the result of three factors, acid concentrate, bicarbonate concentrate and water treatment, currently in the ratio of 1 (concentrates):44 (water). Control of the final dialysate output is monitored by conductivity (as an alternative to Na) and allows for small adjustments in the proportion of concentrates, the alarms or for leaving in bypass mode if appropriate.11 However, the monitors have a fairly wide window of safety in conductivity of 0.3−0.5mS/cm, and therefore a source of variability.12 In this article we have shown how the same manufacturer provides a new monitor with an increase in conductivity of 0.1−0.2mS/cm for the same prescription. This variation is within acceptable safety margins, but it seems a good idea for the nephrologist to correct the deviation by adjusting the dialysate Na prescription and monitoring the conductivity measured by the dialysis monitor during their rounds. Each concentrate extraction pump allows minor modifications to personalise the prescription of bicarbonate (±8mmol/l) and/or Na (±15mmol/l). However, over time, these pumps may deteriorate, leading to a lower than desired amount and, consequently, a decrease in the conductivity of the dialysis fluid, and they may need to be replaced over the years.
The prescribed Na or conductivity of the dialysis fluid and that actually received by the patient is wrongly assumed to be the same. Ng et al.9 conducted a systematic review of studies that measure the Na content of the dialysate administered and compare it with that prescribed, or in other words, explore the mean difference between measured and prescribed dialysate Na values (independent of serum Na). The study showed that although there was no difference in the average between measured and prescribed dialysate Na values, among the individually reported samples, the measured Na was almost 2mmol/l lower than prescribed, depending on the type of dialysis machine or type of concentrate. The authors concluded that in view of variations in the final amounts of Na delivered, more precision is required in Na prescribing.9 Significant differences between prescribed and measured Na concentrations can have both beneficial and detrimental effects on clinical outcomes.13
Pre-dialysis serum Na fluctuations in each patient are usually small, which supports the hypothesis of an individual sodium reference point for each patient (Na “setpoint”).7,14 However, the variability of pre-dialysis serum Na among patients is very high, showing differences in diet, lifestyle and comorbidities,15 as in our study, where the range was 131–143mmol/l. Albalate et al.16 found that the blood sodium of haemodialysis patients has a low coefficient of variability, but does not show a constant value, and even less so in patients with hyponatraemia. Furthermore, they noted the lack of association between blood sodium and blood volume status, stressing the need to independently assess the sodium balance needed by each patient and insisting on the importance of personalised prescribing. In our study, Na prescribing only ranged from 138 to 140mmol/l, reflecting a nearly constant Na prescription with minimal adjustments related to individualisation of bicarbonate. This is the approach of most dialysis centres; a fixed or standard prescription of Na.17 New dialysis machines with sodium control modules will make it possible to automatically individualise the Na in the dialysate, with the aim of this having as little effect as possible on the Na balance during the treatment.10,18,19 As demonstrated by Shendi et al., it is also important to note that there are differences between pre-dialysis sodium levels depending on the method of determination (flame photometer, autoanalyser or gas apparatus).20
Switching from 5008 to 6008 has been associated with an increase in dialysate conductivity and, consequently, the patient ending up with a higher serum Na. This can then lead to possible undesirable effects such as increased osmolarity, increased thirst, increased extracellular volume and, as a consequence, high blood pressure, increased left ventricular hypertrophy and adverse cardiovascular effects.1 It is therefore important to consider that rather than relying on the dialysis concentrate prescription (with the Na, bicarbonate and conductivity specified by the manufacturer), we need to give more importance to and put more trust in the conductivity monitoring by the dialysis monitor. The dialysis monitor may show dialysate conductivities different from those expected, sometimes with differences between similar monitors, between monitors of the same make but different generations (as in our study), and sometimes between monitors of different makes which also possibly use different concentrates. Being able to consult the dialysate conductivity as measured by the monitor while the doctors are doing their rounds in real time during treatment allows individualised adjustments of Na in the concentrate to correct and obtain the prescribed and desired conductivity.
Using data from the Japanese dialysis and transplant registry, Fujisaki et al.6 showed that both hyponatraemia and a ΔSNa variation greater than 4mmol/l were associated with increased mortality in HD patients (especially the combination of the two), suggesting that an increase in ΔSNa may be a cause of organ damage. The harmful effect of intradialysis ΔSNa may reflect cyclical changes in the brain structure (swelling and shrinkage) with dialysis-induced osmotic changes.21 In our study, ΔSNa above 4mmol/l increased from 6% to 22% with the change of monitor and this, along with verification of an increase in the actual conductivity and final serum Na, prompted a reduction in the Na prescription for the dialysate.
Adequate dialysis should enable complete removal of interdialysis sodium gain and avoid intradialysis sodium loading and consequent increased interdialysis weight gain.22 Only the ionised proportion of sodium is available for diffusion, so its movement is determined by the gradient between the concentrations of electrochemically active ions from the plasma into the dialysate, as well as by temperature and acidity. The Gibbs-Donnan effect refers to a phenomenon caused by anionic plasma proteins which are too large to pass through the dialysis membrane, creating an electrical field which attracts cations and reduces the amount of diffusible sodium in plasma.23 This is why we sometimes find that serum Na values correct themselves and end up close to those of the dialysate, and can even exceed the dialysate levels due to the Gibbs-Donnan effect.
We conclude that switching from the 5008 to the 6008 monitor was associated with an increase in dialysate conductivity and, as a consequence, the patient ending up with a higher serum Na level. Knowing about and having been able to confirm this change means that we are able to individualise the Na prescription and avoid possible undesirable effects. This could be the preliminary study, to keep patients in a situation similar to that with the previous dialysis machine, and so be able to explore the potential benefits of the new sodium control biosensor incorporated into the new generation of monitors, which could help reduce the intradialysis sodium gradient.
FundingNo funding was received for this study.
Conflicts of interestFM has received fees from Amgen, Baxter, Fresenius Medical Care, Medtronic, Nipro and Vifor. All the other authors declare that they have no conflicts of interest.
We would like to thank all the patients who participated, as well as all the staff of the dialysis section of Hospital Clínic de Barcelona for their collaboration and enthusiasm in this study.


