One of the consequences of the CKD, is the deterioration of the functional capacity, being able to manifest from different stages of the disease, until renal replacement therapy.
The objective of this study was to determine the functionality of patients with CKD through functional capacity test, valuing the usefulness of the SPPB as a screening test in parallel.
Materials and methodsIt assessed the functional capacity of patients with CKD, using the test SPPB, 6MM, TUTG and STS. Also found the muscle strength with manual dynamometry.
ResultsOf 121 patients who came to the CKD query, 118 presented a minimum functionality to perform tests of functional capacity, a 71.2% of the patients were able to perform 4 tests, a 28.8% only could make the SPPB test.
To a 71.43% of patients who presented a low score in SPPB, not could follow assessed them with the rest of the test, while the 92.31% of which had a high score, continued with the rest of the evidence. To differentiate by age ranges, the majority of young patients have minimal limitations, finding higher rates of disability in older age ranges. A good score in SPPB meant to present good functional capacity and allowed to continue evaluating the patient, obtaining better results with the rest of test and more muscle strength. A good nutritional better status and body composition was a better functionality.
ConclusionIn the absence of a consensus of what is the best method of determining the functional capacity of the kidney patient, and to assess all patients, propose to use the test SPPB as screening method, and depending on the result used as the rest of the test to more complete if it is necessary to study.
Una de las consecuencias de la ERC, es el deterioro de la capacidad funcional, pudiéndose manifestar desde distintos estadios de la enfermedad, hasta el tratamiento renal sustitutivo.
El objetivo de este estudio fue determinar la funcionalidad de los pacientes con ERCA, mediante test de capacidad funcional, valorando de forma paralela la utilidad del SPPB como test de cribado.
Materiales y métodosSe evaluó la capacidad funcional de pacientes ERCA, utilizando los test SPPB, 6MM, TUTG y STS. También se determinó la fuerza muscular con dinamometría manual.
ResultadosDe 121 pacientes que acudieron a la consulta ERCA, 118 presentaron una mínima funcionalidad para poder realizar pruebas de capacidad funcional, un 71,2% de los pacientes fueron capaces de realizar los 4 test, un 28,8% solo pudo realizar el test SPPB.
A un 71,43% de pacientes que presentaron una puntuación baja en SPPB, no se les pudo seguir evaluando con el resto de test, mientras que el 92,31% de los que presentaron una puntuación alta, continuaron con el resto de pruebas. Al diferenciar por rangos de edad, la mayoría de los pacientes jóvenes presentaban mínimas limitaciones, encontrando tasas más altas de discapacidad en rangos de edad mayores. Una buena puntuación en SPPB supuso presentar buena capacidad funcional y permitió seguir evaluando al paciente, obteniendo mejores resultados con el resto de test y más fuerza muscular. Una buena composición corporal y mejor estado nutricional supuso una mejor funcionalidad.
ConclusiónA falta de un consenso de cuál es el mejor método de determinar la capacidad funcional del paciente renal, y para poder evaluar a todos los pacientes, proponemos utilizar el test SPPB como método de screening, y en función del resultado utilizar el resto de los test para realizar estudio más completo si es necesario.
Chronic kidney disease (CKD) affects approximately 7–12% of the population, with rates varying by geographical area, and is one of the leading causes of death together with type 2 diabetes and cardiovascular disease.1
The organisation Kidney Disease Improving Global Outcomes defines CKD as sustained kidney injury for at least three months, diagnosed:
- 1.
Directly due to histological alterations in renal biopsy, or indirectly due to the presence of albuminuria or urinary sediment abnormalities or through imaging techniques.
- 2.
By calculation of glomerular filtration rate (being considered as below 60ml/min/1.73m2). There are a number of formulas, but the CKD-EPI is the one that best differentiate the patient into the different stages and is therefore the one that should be used.1
Progression of CKD is associated with a deterioration in functional capacity, mainly due to the loss and/or atrophy of muscle mass, myopathy, inactivity and malnutrition leading to a reduction in physical capacity, which may become evident in more advanced stages of CKD before renal replacement therapy is required.2–4
Increased life expectancy means that patients became older. Thus, it is necessary to assess their physical capacity, and there has to be included the disease-related deterioration in addition to the decrease in activity in older patients. Moreover, a decrease in functional capacity is a prognostic factor of death, a high rate of hospital admissions and poor quality of life.5–9
There are different tests to evaluate functional capacity, and it is possible to choose which test fit the population to be assessed. To perform a full study, it may even be necessary to use a combination of several tests. With the increase in age and their associated comorbidities, some tests may not be valid for all patients. It may be necessary to use tests valid for geriatric population.10,11
The aim of this study was to determine the functional capacity of patients with advanced chronic kidney disease (CKD) using various functional tests and determine the relationship of functional capacity with body composition, muscle strength and nutritional status. At the same time it was assessed the utility of the Short Physical Performance Battery (SPPB) as a screening test, as this can be used in all patients.
Materials and methodsCross-sectional, prospective study, including 118 patients from the advanced CKD clinic at Hospital Universitario de la Princesa, in Madrid, that were assessed over 12 months according to usual practice (from January to December 2017). Patients included had a GFR lower than 45ml/min/1.73m2 measured by CKD-EPI (CKD stages 3B, 4 and 5) excluding those patients without a minimal mobility. The following studies were performed:
- 1.
Biochemical study of classic nutritional parameters and part of routine clinical practice in the clinic: albumin, prealbumin, CRP, lymphocytes, transferrin and estimation of glomerular filtration rate using the CKD-EPI formula.
- 2.
Assessment of body composition using single-frequency bioimpedance, with the Bioelectrical Impedance Analyser (AKERN BIA-101); the patient was laid on a trolley bed, with all metal objects removed (ring, bracelets, chains, keys, etc.), one pair of electrodes was placed on the right hand and another on the right foot and they were then connected. This measurement provides resistance and reactance data, and with the specific software for the device model, the following data were obtained: phase angle, Na/K and percentages of total body water, intracellular water, fat mass and muscle mass (%MM).
- 3.
Anthropometric study: the circumferences of the arm, waist and hip were measured with a non-elastic anthropometric tape measure, and the triceps skinfold (TSF) was measured with a Holtain calliper (model HOL-9810ND), the arm muscle circumference (AMC) calculated with the formula: AMC=arm circumference (cm)−(π×TSF [mm]).
- 4.
Malnutrition status – inflammation: we used the Malnutrition-Inflammation Score (MIS), which utilize components of the subjective global assessment in combination with body mass index, serum albumin and transferrin. Each of the ten components of the scale are graduated according to severity (from normal to very severe), and the sum of the score of the ten components classifies the patient according to their degree of malnutrition.12
- 5.
Determination of muscle strength using a Baseline hand dynamometer (model Baseline 12-0240). Both arms are measured three times at 90°, taking the highest value for each arm.11,13–15
- 6.
Assessment of functional capacity: we chose the following functional capacity tests: Short Physical Performance Battery (SPPB), 6-Minute Walk Test (6MWT), Timed Up and Go (TUG) test and the Sit-to-Stand (STS) test (also performing the 4 variants described for this last test). These tests were chosen because they are some of the most used in CKD, easily reproducible, not requiring specific facilities or materials and because they are validated in CKD.
- •
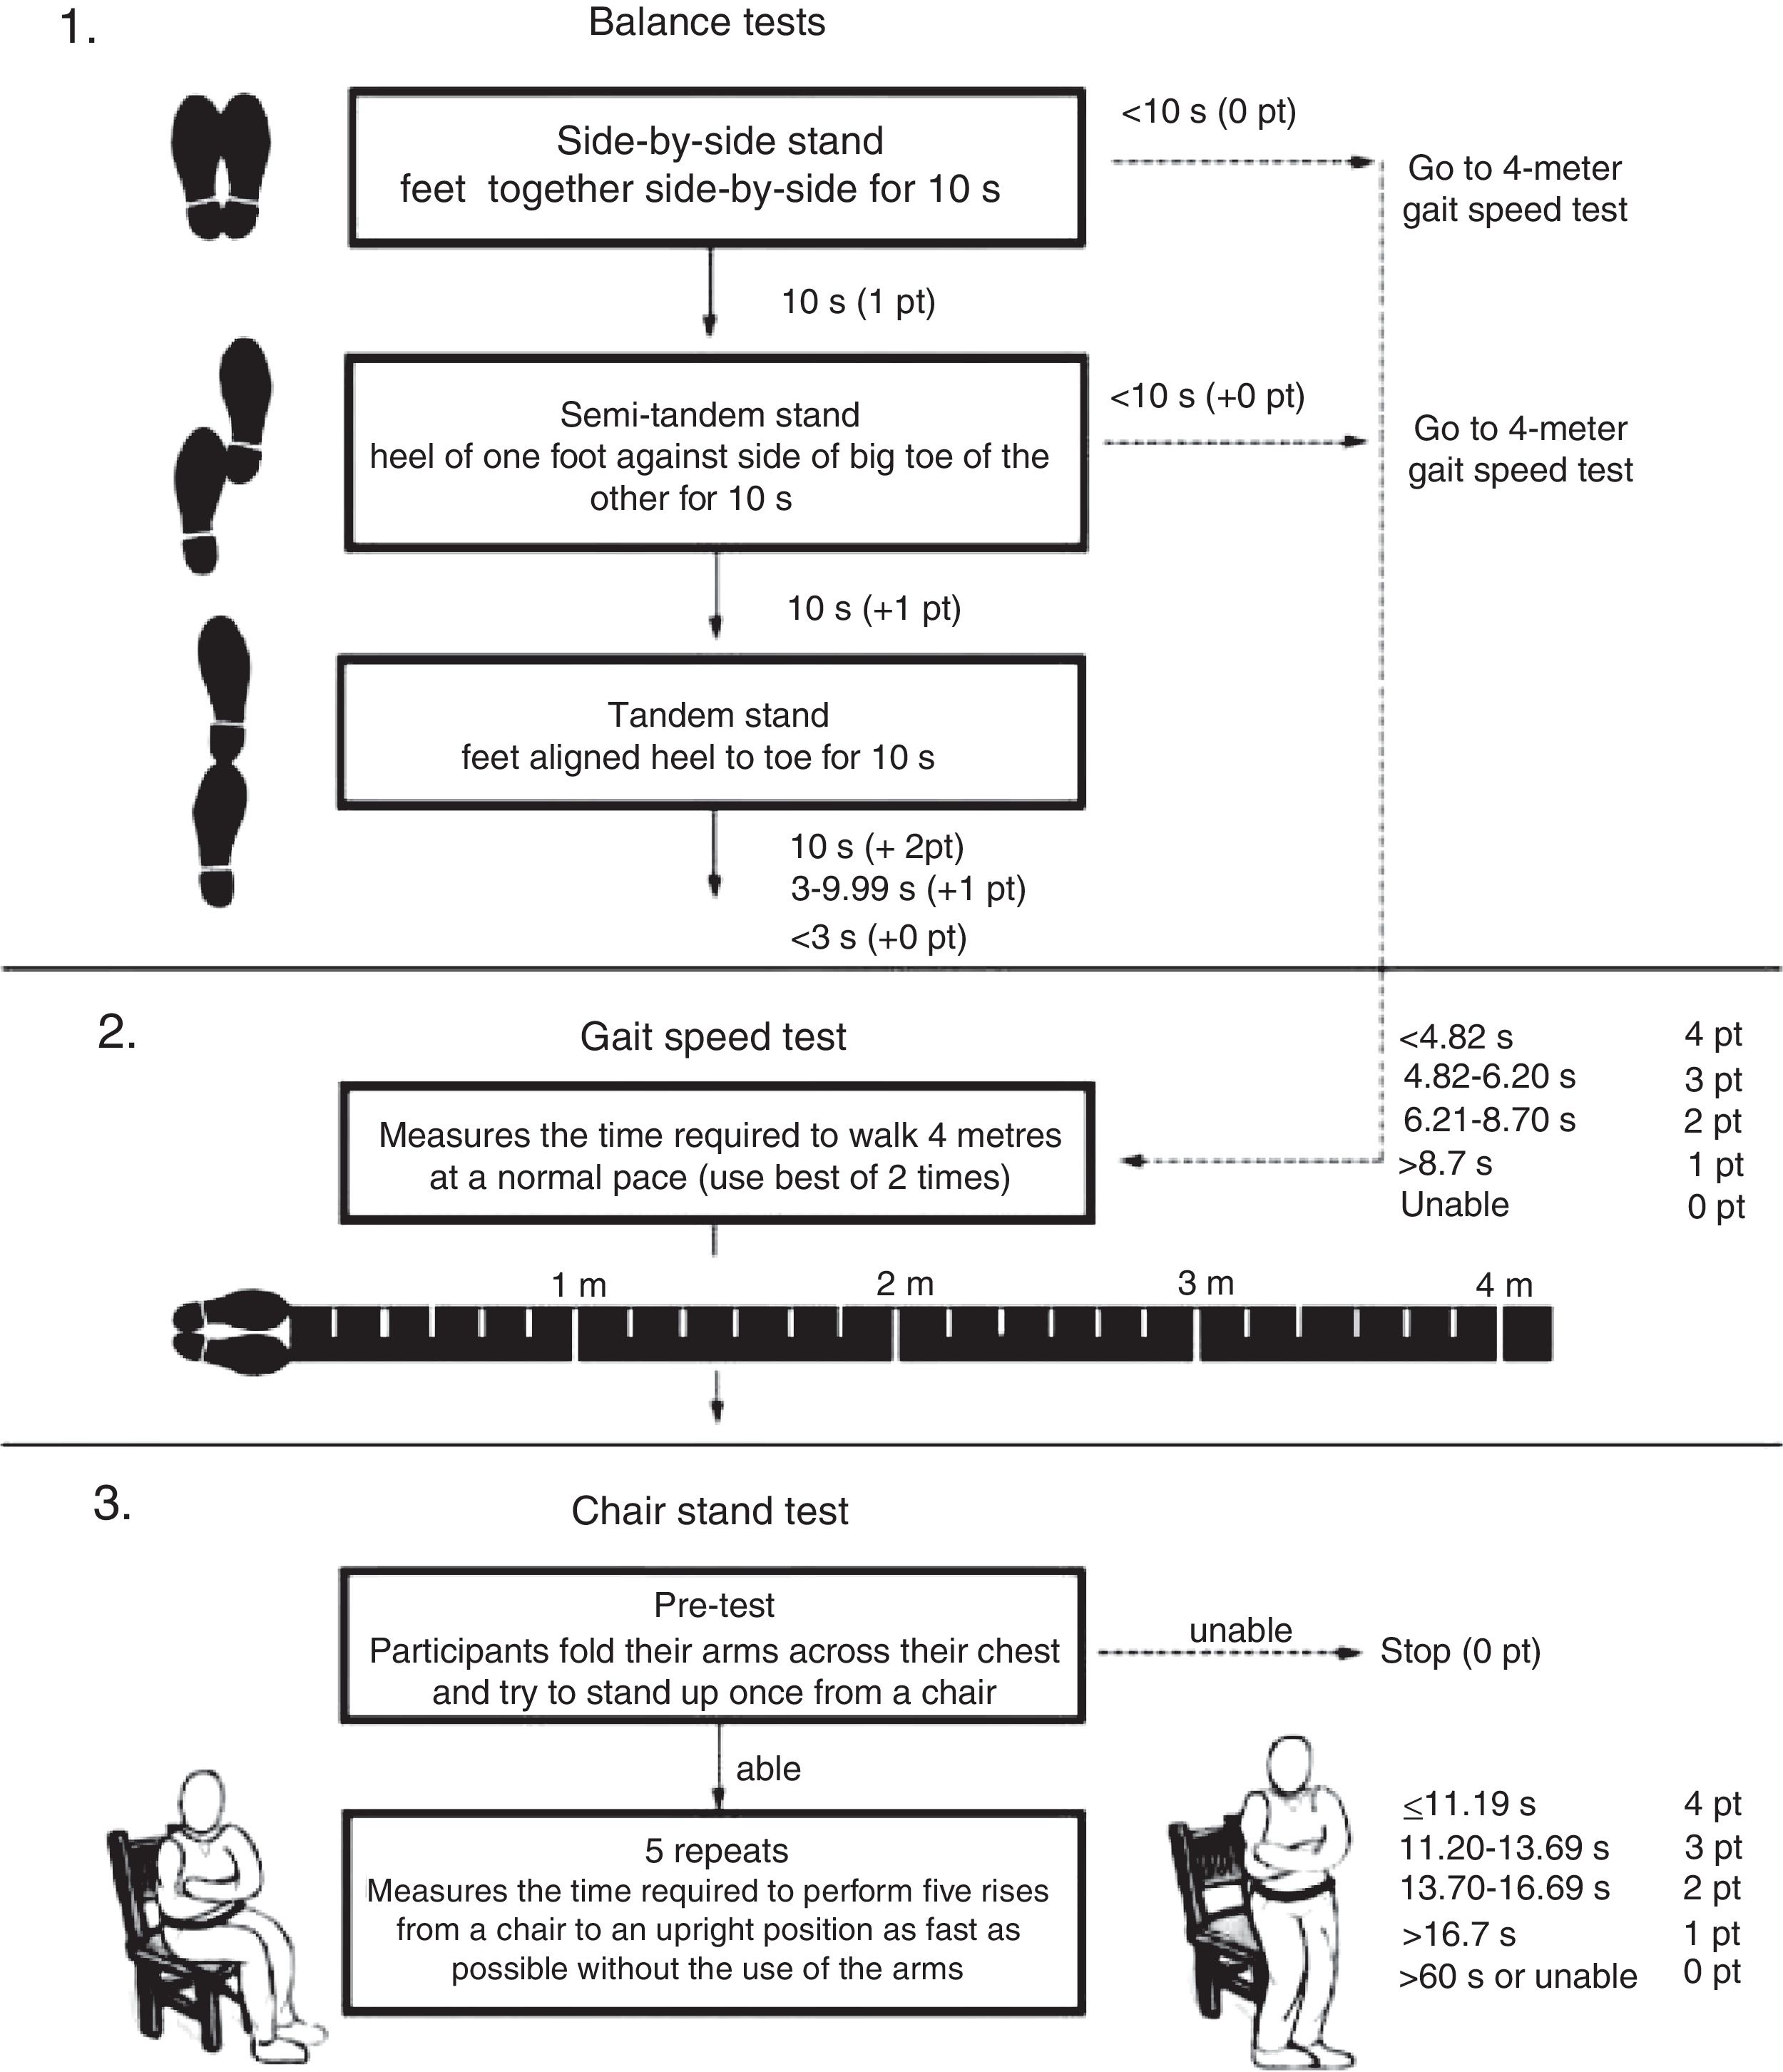
SPPB: this is a short test battery, widely used in geriatrics, which assesses the patient from three points of view: it measures the patient's balance, assessing whether or not they are able to maintain their balance for at least 10s with their feet together, in semi-tandem and full tandem: it assesses gait speed by measuring the time it takes to walk 4m; and it assesses lower extremity strength and endurance, measuring the time it takes to sit down and stand up five times (STS5). Adding the scores from each test, the total score indicates the patient's degree of disability; from the lowest to the highest score the patient would be classified with severe, moderate, or mild limitations or with minimal/no limitations, i.e. the higher the score, the fewer the limitations the patient has.8,9,11,16–19 A flowchart of the SPPB is shown in Fig. 1.
- •
6MWT: this test measures endurance. It consists of the patient walking a distance of 30–35m (for example, along a corridor) for 6min; the total distance is obtained by multiplying the length of the corridor by the number of times the patient covers that distance.11,14,16,17
- •
TUG test: this test assesses the risk of falling. It consists of measuring the time taken to get up from a sitting position, walk three metres and sit down again. If the time is less than 10s the patient is not at risk of falling.8,11,17,20,21
- •
STS test and its four variants: this test assesses lower extremity strength and endurance; STS5 and STS10 consist of measuring the time it takes to get up from a chair and sit back down five or ten times and the STS30 and STS60 count the number of times they can get up and sit back down in 30 and 60s, respectively.11,17,22–24

The qualitative data is described using absolute frequencies and percentages and the quantitative data, by mean±standard deviation (SD), median and interquartile range (P25–P75 – IQR), minimum and maximum.
Quantitative data were analysed using the Kolmogorov–Smirnov test to assess normal distribution.
The comparison of quantitative data between groups was performed using the Mann–Whitney U test and the Student's t test. Qualitative data were compared using the chi-square test. The study of the correlations between quantitative variables was performed using Spearman's or Pearson's coefficient of correlation, according to the distribution of the data.
All statistical tests were considered bilateral and p-values lower than 0.05 as significant. The data were analysed with the statistical program SPSS version 23.0 (IBM Corp., Armonk, NY, USA).
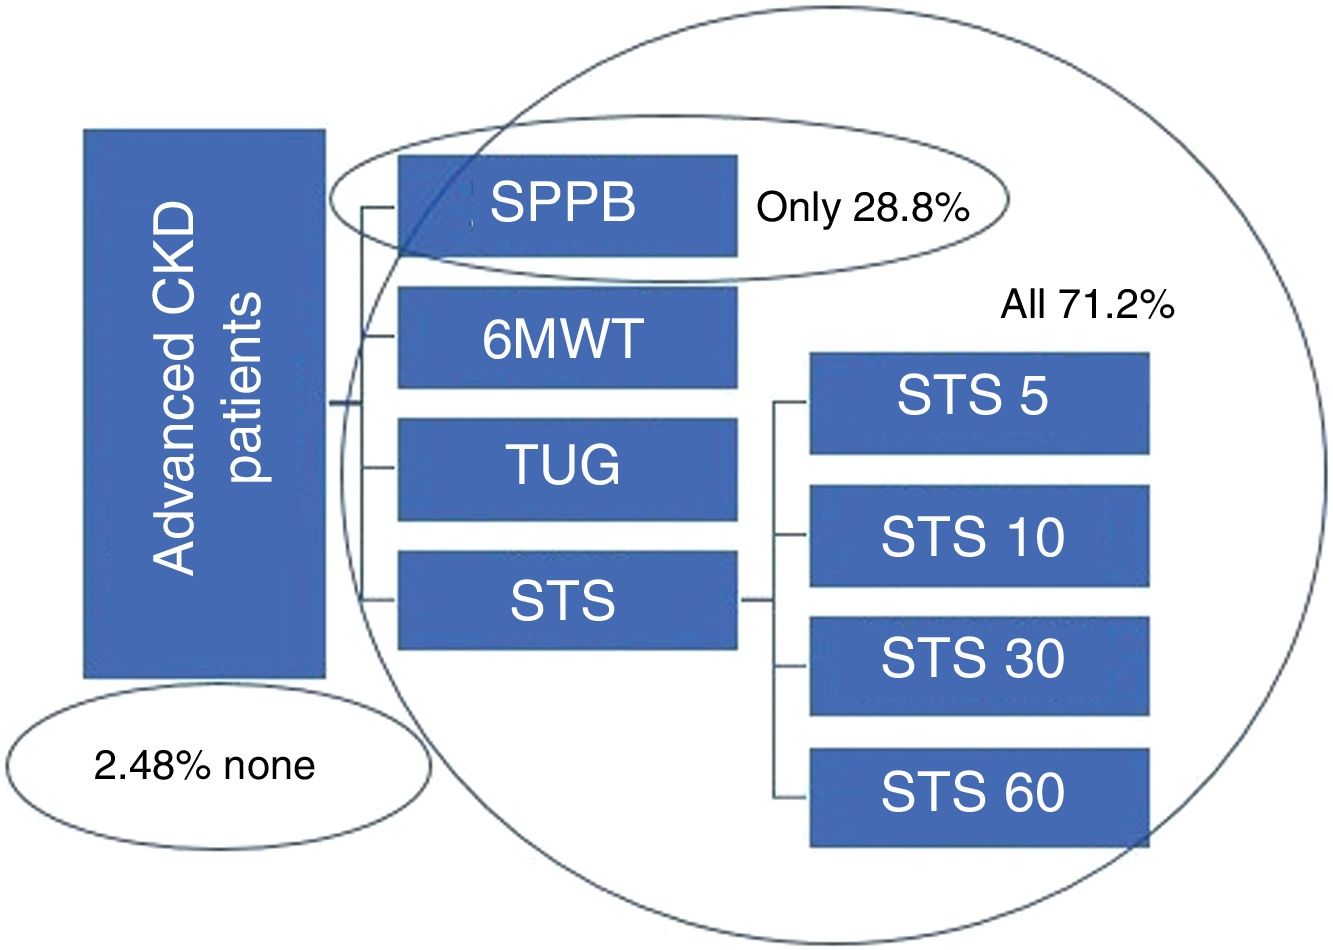
ResultsOf the total of 121 patients who attended the advanced CKD clinic over the one-year period, only 118 were taken into account; three patients (2.48%) were excluded, as they were not able to perform any of the functional tests proposed; two because they were in a wheelchair, and the third due to a recent stroke. Of the 118 patients, 71.2% (84 patients) were able to perform all four tests (SPPB, 6MWT, TUTG and STS) and 28.8% (34 patients) were only able to perform the SPPB. Fig. 2 shows the percentages of patients who completed the different tests proposed in the study.

Of the 118 patients, 76 (64.4%) were male and 42 (35.6%) female. The median age was 74 (62–80), with a range of 36–94 years, with no significant difference in the mean age of males and females.
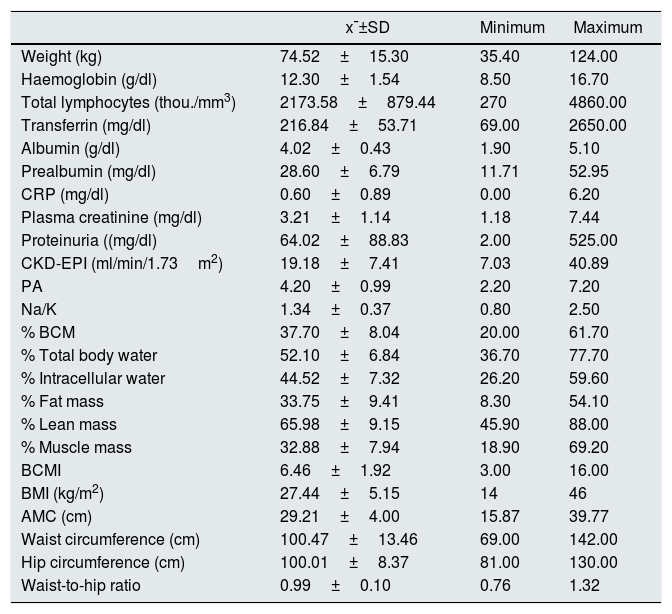
The table below (Table 1) shows the clinical biochemistry and body composition data.
Results of biochemical parameters and body composition by bioimpedance-anthropometry.
| x¯±SD | Minimum | Maximum | |
|---|---|---|---|
| Weight (kg) | 74.52±15.30 | 35.40 | 124.00 |
| Haemoglobin (g/dl) | 12.30±1.54 | 8.50 | 16.70 |
| Total lymphocytes (thou./mm3) | 2173.58±879.44 | 270 | 4860.00 |
| Transferrin (mg/dl) | 216.84±53.71 | 69.00 | 2650.00 |
| Albumin (g/dl) | 4.02±0.43 | 1.90 | 5.10 |
| Prealbumin (mg/dl) | 28.60±6.79 | 11.71 | 52.95 |
| CRP (mg/dl) | 0.60±0.89 | 0.00 | 6.20 |
| Plasma creatinine (mg/dl) | 3.21±1.14 | 1.18 | 7.44 |
| Proteinuria ((mg/dl) | 64.02±88.83 | 2.00 | 525.00 |
| CKD-EPI (ml/min/1.73m2) | 19.18±7.41 | 7.03 | 40.89 |
| PA | 4.20±0.99 | 2.20 | 7.20 |
| Na/K | 1.34±0.37 | 0.80 | 2.50 |
| % BCM | 37.70±8.04 | 20.00 | 61.70 |
| % Total body water | 52.10±6.84 | 36.70 | 77.70 |
| % Intracellular water | 44.52±7.32 | 26.20 | 59.60 |
| % Fat mass | 33.75±9.41 | 8.30 | 54.10 |
| % Lean mass | 65.98±9.15 | 45.90 | 88.00 |
| % Muscle mass | 32.88±7.94 | 18.90 | 69.20 |
| BCMI | 6.46±1.92 | 3.00 | 16.00 |
| BMI (kg/m2) | 27.44±5.15 | 14 | 46 |
| AMC (cm) | 29.21±4.00 | 15.87 | 39.77 |
| Waist circumference (cm) | 100.47±13.46 | 69.00 | 142.00 |
| Hip circumference (cm) | 100.01±8.37 | 81.00 | 130.00 |
| Waist-to-hip ratio | 0.99±0.10 | 0.76 | 1.32 |
With respect to glomerular filtration calculated by the CKD-EPI equation, 33.9% had a stage 5 CKD, 58.9% stage 4, and 10.2% stage 3B.
The score for the nutritional study using a malnutrition-inflammation score (MIS) was 5.40±2.82, which corresponds to mild-to-moderate malnutrition or risk of malnutrition.
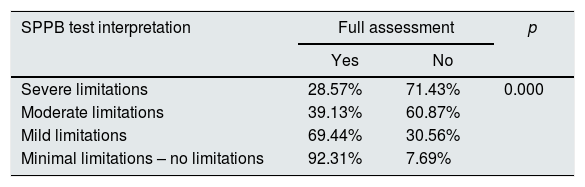
Table 2 shows how most of the patients with a high score in the SPPB test (minimal limitations and mild limitations) were able to perform what we have called a “full assessment” (consisting of the 6MWT and TUG tests and the 4 STS tests), while the majority of those who obtained a lower score were not able to do the full assessment.
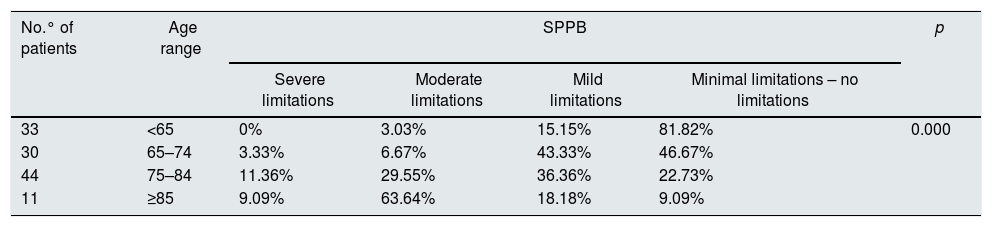
The analysis separating by age (Table 3), revealed that no patients under 65 had severe limitations in the SPPB, the majority having minimal limitations, and similar results were obtained in the 65–74 age group. The 75–84 age group included the largest number of patients, and also the largest number patients classified with mild or moderate limitations. The group with age over-85 had the highest percentage of moderate-to-severe limitations.
Relationship between age and SPPB.
| No.° of patients | Age range | SPPB | p | |||
|---|---|---|---|---|---|---|
| Severe limitations | Moderate limitations | Mild limitations | Minimal limitations – no limitations | |||
| 33 | <65 | 0% | 3.03% | 15.15% | 81.82% | 0.000 |
| 30 | 65–74 | 3.33% | 6.67% | 43.33% | 46.67% | |
| 44 | 75–84 | 11.36% | 29.55% | 36.36% | 22.73% | |
| 11 | ≥85 | 9.09% | 63.64% | 18.18% | 9.09% | |
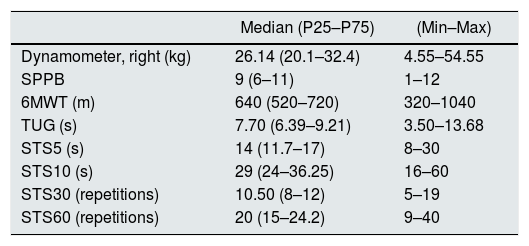
Table 4 shows the results obtained in the different tests of functional capacity and muscle strength; the data are expressed as median and interquartile range (IQR), as well as maximum and minimum values.
Test results for functional capacity and muscle strength with dynamometer.
| Median (P25–P75) | (Min–Max) | |
|---|---|---|
| Dynamometer, right (kg) | 26.14 (20.1–32.4) | 4.55–54.55 |
| SPPB | 9 (6–11) | 1–12 |
| 6MWT (m) | 640 (520–720) | 320–1040 |
| TUG (s) | 7.70 (6.39–9.21) | 3.50–13.68 |
| STS5 (s) | 14 (11.7–17) | 8–30 |
| STS10 (s) | 29 (24–36.25) | 16–60 |
| STS30 (repetitions) | 10.50 (8–12) | 5–19 |
| STS60 (repetitions) | 20 (15–24.2) | 9–40 |
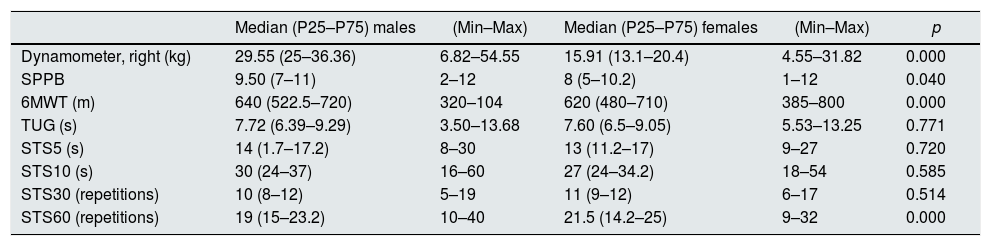
The results according to gender are presented in Table 5, males had greater strength measured by dynamometer than the females. In the functional capacity tests, there was a significant difference between males and females in the SPPB, 6MWT and STS60, with males achieving better results in the SPPB and 6MWT, and females in the STS60. Although the result was not statistically significant, the females obtained better results in the rest of the tests.
Test results for functional capacity and muscle strength with dynamometer by gender.
| Median (P25–P75) males | (Min–Max) | Median (P25–P75) females | (Min–Max) | p | |
|---|---|---|---|---|---|
| Dynamometer, right (kg) | 29.55 (25–36.36) | 6.82–54.55 | 15.91 (13.1–20.4) | 4.55–31.82 | 0.000 |
| SPPB | 9.50 (7–11) | 2–12 | 8 (5–10.2) | 1–12 | 0.040 |
| 6MWT (m) | 640 (522.5–720) | 320–104 | 620 (480–710) | 385–800 | 0.000 |
| TUG (s) | 7.72 (6.39–9.29) | 3.50–13.68 | 7.60 (6.5–9.05) | 5.53–13.25 | 0.771 |
| STS5 (s) | 14 (1.7–17.2) | 8–30 | 13 (11.2–17) | 9–27 | 0.720 |
| STS10 (s) | 30 (24–37) | 16–60 | 27 (24–34.2) | 18–54 | 0.585 |
| STS30 (repetitions) | 10 (8–12) | 5–19 | 11 (9–12) | 6–17 | 0.514 |
| STS60 (repetitions) | 19 (15–23.2) | 10–40 | 21.5 (14.2–25) | 9–32 | 0.000 |
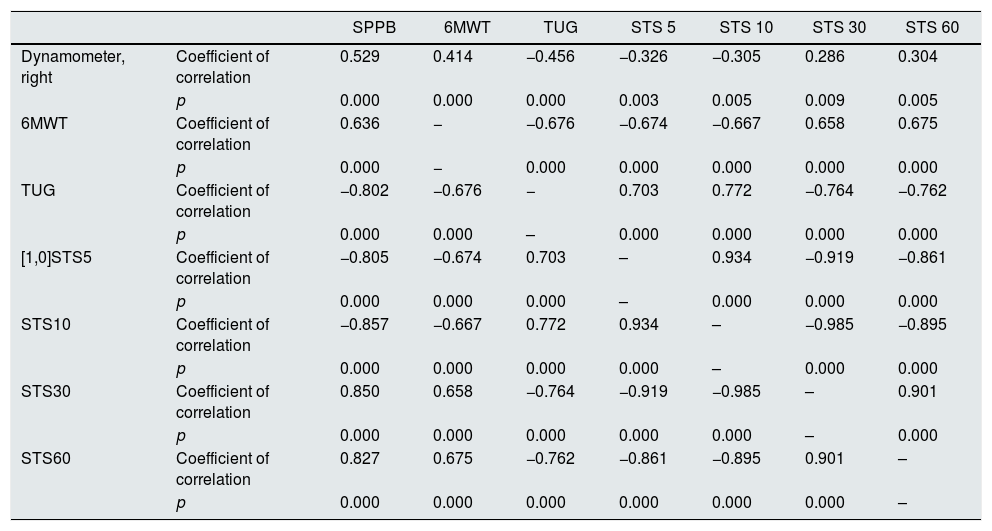
Table 6 shows the correlation of the SPPB test with muscle strength and other tests; it can be seen that a better result in the SPPB meant a better result in the rest of the tests, i.e. they showed more strength, walked further, had less risk of falling and had better scores for time taken and number of times they could sit down and stand up. This was also found comparing with muscle strength, i.e. having more strength meant better functional capacity.
Relationship between SPPB, functional capacity test and muscle strength with dynamometer.
| SPPB | 6MWT | TUG | STS 5 | STS 10 | STS 30 | STS 60 | ||
|---|---|---|---|---|---|---|---|---|
| Dynamometer, right | Coefficient of correlation | 0.529 | 0.414 | −0.456 | −0.326 | −0.305 | 0.286 | 0.304 |
| p | 0.000 | 0.000 | 0.000 | 0.003 | 0.005 | 0.009 | 0.005 | |
| 6MWT | Coefficient of correlation | 0.636 | − | −0.676 | −0.674 | −0.667 | 0.658 | 0.675 |
| p | 0.000 | − | 0.000 | 0.000 | 0.000 | 0.000 | 0.000 | |
| TUG | Coefficient of correlation | −0.802 | −0.676 | − | 0.703 | 0.772 | −0.764 | −0.762 |
| p | 0.000 | 0.000 | – | 0.000 | 0.000 | 0.000 | 0.000 | |
| [1,0]STS5 | Coefficient of correlation | −0.805 | −0.674 | 0.703 | – | 0.934 | −0.919 | −0.861 |
| p | 0.000 | 0.000 | 0.000 | – | 0.000 | 0.000 | 0.000 | |
| STS10 | Coefficient of correlation | −0.857 | −0.667 | 0.772 | 0.934 | – | −0.985 | −0.895 |
| p | 0.000 | 0.000 | 0.000 | 0.000 | – | 0.000 | 0.000 | |
| STS30 | Coefficient of correlation | 0.850 | 0.658 | −0.764 | −0.919 | −0.985 | – | 0.901 |
| p | 0.000 | 0.000 | 0.000 | 0.000 | 0.000 | – | 0.000 | |
| STS60 | Coefficient of correlation | 0.827 | 0.675 | −0.762 | −0.861 | −0.895 | 0.901 | – |
| p | 0.000 | 0.000 | 0.000 | 0.000 | 0.000 | 0.000 | – |
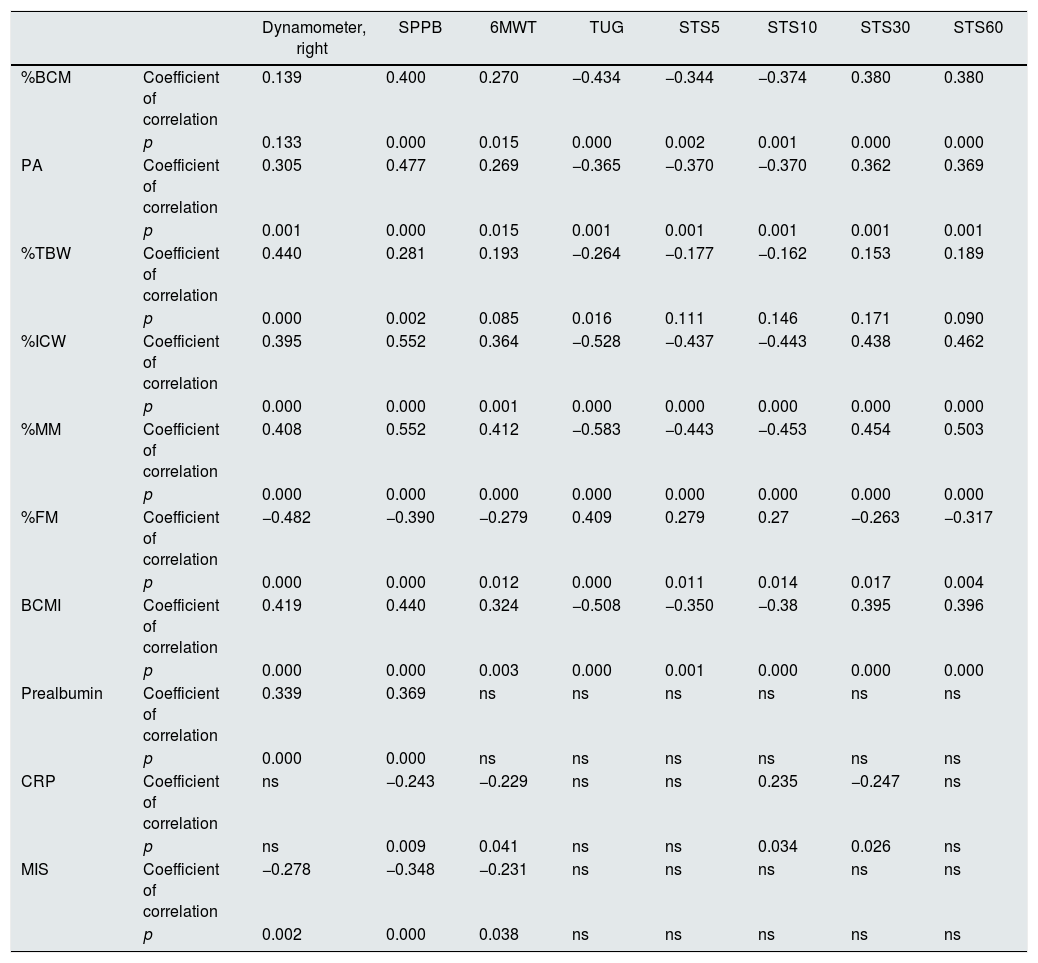
When differentiating by gender, we found no significant difference for BMI, AMC, MIS, CKD-EPI and CRP, but there was a significant difference with TSF (0.000, higher in females) and prealbumin (0.029, higher in males). Table 7 shows that patients with better body composition had better functional capacity and muscle strength, but this was not the case with the anthropometric parameters, where there was no statistical significance.
Relationship between test and dynamometer readings and bioimpedance body composition parameters, clinical biochemistry parameters and malnutrition-inflammation score (MIS).
| Dynamometer, right | SPPB | 6MWT | TUG | STS5 | STS10 | STS30 | STS60 | ||
|---|---|---|---|---|---|---|---|---|---|
| %BCM | Coefficient of correlation | 0.139 | 0.400 | 0.270 | −0.434 | −0.344 | −0.374 | 0.380 | 0.380 |
| p | 0.133 | 0.000 | 0.015 | 0.000 | 0.002 | 0.001 | 0.000 | 0.000 | |
| PA | Coefficient of correlation | 0.305 | 0.477 | 0.269 | −0.365 | −0.370 | −0.370 | 0.362 | 0.369 |
| p | 0.001 | 0.000 | 0.015 | 0.001 | 0.001 | 0.001 | 0.001 | 0.001 | |
| %TBW | Coefficient of correlation | 0.440 | 0.281 | 0.193 | −0.264 | −0.177 | −0.162 | 0.153 | 0.189 |
| p | 0.000 | 0.002 | 0.085 | 0.016 | 0.111 | 0.146 | 0.171 | 0.090 | |
| %ICW | Coefficient of correlation | 0.395 | 0.552 | 0.364 | −0.528 | −0.437 | −0.443 | 0.438 | 0.462 |
| p | 0.000 | 0.000 | 0.001 | 0.000 | 0.000 | 0.000 | 0.000 | 0.000 | |
| %MM | Coefficient of correlation | 0.408 | 0.552 | 0.412 | −0.583 | −0.443 | −0.453 | 0.454 | 0.503 |
| p | 0.000 | 0.000 | 0.000 | 0.000 | 0.000 | 0.000 | 0.000 | 0.000 | |
| %FM | Coefficient of correlation | −0.482 | −0.390 | −0.279 | 0.409 | 0.279 | 0.27 | −0.263 | −0.317 |
| p | 0.000 | 0.000 | 0.012 | 0.000 | 0.011 | 0.014 | 0.017 | 0.004 | |
| BCMI | Coefficient of correlation | 0.419 | 0.440 | 0.324 | −0.508 | −0.350 | −0.38 | 0.395 | 0.396 |
| p | 0.000 | 0.000 | 0.003 | 0.000 | 0.001 | 0.000 | 0.000 | 0.000 | |
| Prealbumin | Coefficient of correlation | 0.339 | 0.369 | ns | ns | ns | ns | ns | ns |
| p | 0.000 | 0.000 | ns | ns | ns | ns | ns | ns | |
| CRP | Coefficient of correlation | ns | −0.243 | −0.229 | ns | ns | 0.235 | −0.247 | ns |
| p | ns | 0.009 | 0.041 | ns | ns | 0.034 | 0.026 | ns | |
| MIS | Coefficient of correlation | −0.278 | −0.348 | −0.231 | ns | ns | ns | ns | ns |
| p | 0.002 | 0.000 | 0.038 | ns | ns | ns | ns | ns |
Lastly, with biochemistry parameters and the MIS, we only found statistical significance with muscle strength, SPPB and the 6MWT. Prealbumin appeared to be a good marker of muscle strength and functional capacity measured with SPPB, while inflammation status (CRP) influenced functionality, and a worse nutritional status meant less strength, more limitations and less endurance.
DiscussionAssessment of functional capacity should be included in the diagnosis and monitoring of renal patients, as these patients have an increased risk of functional impairment. Functional capacity tests have a good correlation with body composition, muscle strength and parameters of nutritional status.
The study was carried out with assessment of the functional capacity of patients from the advanced CKD clinic at Madrid's Hospital Universitario de la Princesa which is performed as part of routine clinical practice. The usual tests for assessing functionality (6MWT, TUG, STS) could not be applied to all patients since not all patients were able to perform such tests. A significant number were left unassessed thus, we sought a test that was easy to execute, quick to complete and which could be used in all patients. The SPPB was a good alternative, despite being a test used in geriatric population. It allowed to assess a greater number of patients, from the very oldest to much younger patients who, for various reasons, had a reduction in their functional capacity in whom it was very difficult to assess using the other physical fitness tests.
The advantage of using this test is that in addition to not requiring complex material, or taking a long time to complete, it is possible to assess virtually all patients. Although in young people it may be insufficient, it can serve as a screening test before moving on to another battery or more intense tests. With the increase in life expectancy, patients became older. It is necessary to include tools used mainly in geriatrics for the assessment, diagnosis and monitoring of these patients.25 The SPPB is a very useful test, as a variation of at least one point in the score will have clinical significance.26 It is therefore possible to quickly assess and detect deterioration, maintenance or improvement in the patient's functional capacity, enabling the health care personnel to act rapidly if necessary, recommending physical activity to improve or maintain functionality.
Although most of the studies are performed in HD, it is important to stress that assessment of functional capacity is necessary in the initial stages of the disease. In addition to the fact that deterioration may occur early, once the time comes to initiate renal replacement therapy, it is important to ensure that the patient has the minimal amount of complications. In 2013, Baback Roshanravan et al.27 published a study in which they analysed mortality rates based on functional capacity, using as tools the 6MWT, TUG and dynamometer tests. They assessed patients who were in stages 2–4, and reported that a decrease of 0.1m/s in gait speed, a decrease in muscle strength and an increase of 1s in the result of the TUG test increased the mortality at 3 years.
There is little evidence on functional capacity assessment in patients with CKD prior to renal replacement therapy. Özlem et al.8 published a study in 2017 pointing out the need to assess the functional capacity of renal patients from early stages and they used the SPPB test (regardless of age). In that study, in addition to using the SPPB, they also used the TUG test. In line with our results, they found that, regardless of the patients’ age, compared to the TUG test, the SPPB was a better assessment test.
Another point to consider is how often to perform the functional assessment. In a study conducted by Lucia Ortega et al.17 in 2015 in Valencia (Spain), haemodialysis patients were assessed with a test battery consisting of SPPB, STS10, STS60, and the TUG test (also including the heel-rise test), performing an initial assessment and another at six months. They concluded that with the results obtained, it was not possible to assess the deterioration in six months, and that longer studies were therefore necessary.
Recent publications on HD and PD28,29 highlight the need for assessment of functional capacity and show that the monitoring of a physical activity, improving body composition and functionality, leads to an increase in both quality of life and life expectancy. There are even studies30 which show statistically significant associations between anxiety and depression and worse results in the 6MWT and STS tests.
ConclusionMore studies are needed in patients with advanced CKD, since most publications are focused on haemodialysis population. Functional capacity assessments should be performed as part of routine clinical practice in patients from advanced CKD clinics, choosing the test that best suits the characteristics of the patients.
In the absence of a consensus on the best method to determine the functional capacity of renal patients, and with the intention to assess all patients, we propose the SPPB test as a screening method and, depending on the results, using the 6MWT, TUG test and STS tests (any of the 4 variants described) to perform a complete study if necessary.
Conflicts of interestThe authors declare that they have no conflicts of interest.
Please cite this article as: Nogueira Á, Álvarez G, Russo F, San-José B, Sánchez-Tomero JA, Barril G. ¿Es útil el SPPB como método de screening de capacidad funcional en pacientes con enfermedad renal crónica avanzada?. Nefrología. 2019;39:489–496.


