

The European COSMOS study, which included 6,797 haemodialysis patients from 20 countries, demonstrated that elevated PTH levels were associated with a higher risk of mortality in diabetic patients compared to non-diabetic ones. Elevated PTH levels have been linked to inflammatory processes. This study aimed to analyse, in epigastric arteries of dialysis patients, whether diabetes and elevated PTH levels might synergistically modulate the expression of inflammatory and vascular calcification (VC) markers through ADAM17 and/or its inhibitor, TIMP3.
Materials and methodsEpigastric artery samples were examined from 62 chronic kidney disease patients, 31 non-diabetic and 31 diabetic with similar characteristics, obtained during kidney transplantation. The gene expression of ADAM17, TIMP3, inflammatory markers (TNFα, VCAM, and ICAM), α-actin, DKK1, and RUNX2, as well as protein expression of RUNX2 and vascular calcification, were evaluated. Analyses were performed based on the presence/absence of diabetes and serum PTH levels (using the median value as the cut-off). Differences between groups were assessed using Chi-squared tests for qualitative variables or Wilcoxon tests for quantitative variables.
ResultsIn the epigastric arteries of diabetic patients, there was lower gene expression of TIMP3 (1.0 (0.8) U.R. vs 0.6 (0.5) U.R.; p = 0.028) and α-actin (1.0 (0.6) U.R. vs 0.7 (0.5) U.R.; p = 0.006), higher gene expression of VCAM (1.0 (0.9) U.R. vs 2.1 (2.8) U.R.; p = 0.011), TNFα (1.0 (1.1) U.R. vs 2.0 (1.9) U.R.; p = 0.008), and RUNX2 (1.0 (0.8) U.R. vs 2.4 (2.8) U.R.; p = 0.009), and a higher percentage of RUNX2-positive nuclei (14.9 (15.8) vs 31.1 (27.1); p = 0.038) compared to non-diabetic patients. Arteries from patients with PTH levels above the median exhibited higher gene expression of ADAM17 (1.0 (0.6) U.R. vs 1.8 (1.6) U.R.; p = 0.026). The increase in ADAM17 expression persisted when only diabetic patients were analysed (1.0 (0.5) U.R. vs 2.9 (2.9) U.R.; p = 0.038), but not in non-diabetic patients. The combination of elevated PTH and diabetes was associated with higher gene expression of RUNX2 (1.0 (0.8) U.R. vs 2.7 (3.3) U.R.; p = 0.019), a higher percentage of RUNX2-positive nuclei (13.3 (17.0) vs 32.9 (27.2); p = 0.039), and a higher Kauppila index (3.9 (5.0) vs 9.7 (7.3); p = 0.045).
ConclusionsAlthough changes in ADAM17 and TIMP3 gene expression were observed in diabetic patients, potentially related to increased synthesis and/or release of pro-inflammatory factors, these do not appear to explain the difference in mortality associated with elevated PTH levels between diabetic and non-diabetic patients observed in the COSMOS study. However, the increased mortality in diabetic patients with elevated PTH may be linked to greater VC progression mediated by RUNX2.
El estudio europeo COSMOS, que incluye 6797 pacientes en hemodiálisis procedentes de 20 países, mostró que los niveles elevados de PTH se asociaban con un mayor riesgo de mortalidad en pacientes diabéticos comparados con no diabéticos. Los niveles de PTH elevados se han asociado a procesos inflamatorios. El objetivo de este estudio fue analizar en arterias epigástricas de pacientes en diálisis, si la diabetes y los niveles elevados de PTH podrían actuar sinérgicamente modulando la expresión de marcadores inflamatorios y de calcificación vascular (CV) a través de ADAM17 y/o su inhibidor, TIMP3.
Material y métodosSe examinaron muestras de arterias epigástricas de 62 pacientes con enfermedad renal crónica, 31 no diabéticos y 31 diabéticos con características similares, obtenidas durante el trasplante renal. Se evaluó la expresión génica de ADAM17, TIMP3, marcadores inflamatorios (TNFα, VCAM e ICAM), α-actina, DKK1 y RUNX2, la expresión proteica de RUNX2 y la calcificación vascular. Los análisis se realizaron en función de la presencia/ausencia de diabetes y de los niveles de PTH sérica (utilizando el valor de la mediana como punto de corte). Las diferencias entre los grupos se evaluaron mediante las pruebas estadísticas Chi-cuadrado en el caso de variables cualitativas o Wilcoxon en variables cuantitativas.
ResultadosEn las arterias epigástricas de pacientes diabéticos se observó menor expresión génica de TIMP3 (1,0 (0,8) U.R. vs 0,6 (0,5) U.R.; p = 0,028) y α-actina (1,0 (0,6) U.R. vs 0,7 (0,5) U.R.; p = 0,006), mayor expresión génica de VCAM (1,0 (0,9) U.R. vs 2,1 (2,8) U.R.; p = 0,011), TNFα (1,0 (1,1) U.R. vs 2,0 (1,9) U.R.; p = 0,008) y RUNX2 (1,0 (0,8) U.R. vs 2,4 (2,8) U.R.; p = 0,009) y mayor porcentaje de núcleos positivos para RUNX2 (14.9 (15.8) vs 31.1 (27.1); p = 0,038) en comparación con los no diabéticos. Las arterias de pacientes con PTH por encima de la mediana mostraron mayor expresión génica de ADAM17 (1,0 (0,6) U.R. vs 1,8 (1,6) U.R.; p = 0,026). El aumento en la expresión de ADAM17 se mantuvo cuando se analizaron solo los pacientes diabéticos (1,0 (0,5) U.R. vs 2,9 (2,9) U.R.; p = 0,038), pero no en los pacientes no diabéticos. La combinación de ambas circunstancias, PTH elevada y diabetes, se asoció con mayor expresión génica de RUNX2 (1,0 (0,8) U.R. vs 2,7 (3,3) U.R.; p = 0,019), mayor porcentaje de núcleos positivos para RUNX2 (13.3 (17.0) vs 32.9 (27.2); p = 0,039) y mayor índice de Kauppila (3,9 (5,0) vs 9,7 (7,3); p = 0,045).
ConclusionesAunque se observaron cambios en la expresión génica de ADAM17 y TIMP3 en pacientes diabéticos que podrían relacionarse con un aumento en la síntesis y/o liberación de factores proinflamatorios, estos no parecen explicar la diferencia en la mortalidad asociada a niveles elevados de PTH entre pacientes diabéticos y no diabéticos que se observó en el estudio COSMOS. Sin embargo, el aumento de la mortalidad en pacientes diabéticos con PTH elevada podría estar relacionado con una mayor progresión de la CV mediado por RUNX2.
The prevalence of vascular calcification (VC) in dialysis patients is higher than in the general population and ranges from 47% to 83% in those with chronic kidney disease (CKD) and a glomerular filtration rate below 60 mL/min/1.73 m2.1–5 This prevalence is even higher in diabetic patients with CKD, in whom VC tends to be more severe and manifest at earlier stages of the disease,1,6–8 although no differences are usually observed in the levels of classic procalcification factors such as phosphorus and fibroblast growth factor 23.9 These data show that in diabetic patients there may be other risk factors associated with VC, such as greater inflammation9 or inadequate glycemic control.10
Previous results from the COSMOS study (6,797 hemodialysis patients from 20 European countries) showed that diabetic patients with elevated serum parathyroid hormone (PTH) levels had a higher relative risk of mortality than non-diabetics,11 demonstrating that diabetic patients may be more sensitive to increases in PTH. Several studies have observed a correlation between PTH and inflammation in both the general population and in patients with primary hyperparathyroidism.12–14 Similarly, a study in hemodialysis patients with secondary hyperparathyroidism showed a decrease in the neutrophil/lymphocyte ratio (a marker of inflammation) after parathyroidectomy.15
These results show that elevated PTH could promote a more inflammatory state. Similarly, a recent study based on the National Health and Nutrition Examination Survey (NHANES) conducted by the US National Center for Health Statistics showed that inflammation could affect PTH levels, given that consumption of a pro-inflammatory diet was associated with an increased risk of hyperparathyroidism.16 One of the possible mechanisms involved in this inflammatory process could be the activation of ADAM17 (disintegrin and metalloproteinase 17) or the tumor necrosis factor alpha (TNF-α) converting enzyme (α), an important mediator of signaling events associated with inflammatory processes that participates in cell adhesion and proteolytic cleavage of various cell surface molecules.17 This possibility would be supported by the observation of increased ADAM17 expression/activity in CKD18 and hyperglycemia.19 In fact, mice lacking TIMP3, an inhibitor of ADAM17,17 show greater inflammation and insulin resistance.20 This enzyme also participates in the release of cell adhesion molecules, such as VCAM and ICAM, which are involved in leukocyte recruitment and vascular endothelial dysfunction.17,21
The hypothesis of the present study was that diabetic patients would have a higher expression of proinflammatory factors, which could be exacerbated by elevated PTH levels, contributing to a higher risk of and an increase in VC. Therefore, the objectives of this study were to analyze epigastric arteries for a possible association between the presence of diabetes and/or PTH levels with the ADAM17 expression, its inhibitor (TIMP3), and other molecules processed by this enzyme such as VCAM, ICAM, and TNF-α, as well as markers of contractile muscle phenotype (α -actin) and osteogenic phenotype (RUNX2 and DKK1), and calcification parameters such as vascular calcium content and the Kauppila index.
Materials and methodsStudy designA retrospective study was conducted on 62 dialysis patients (31 non-diabetic and 31 diabetic) who underwent kidney transplantation between 2011 and 2023 by selecting one non-diabetic patient with similar characteristics for each diabetic patient. During kidney transplant surgery, a fragment of the epigastric artery was collected from each patient, which was divided into two or three parts: one was used for RNA extraction, another for determining vascular calcium content, and, when sufficient tissue was available, a third fragment was embedded in paraffin for immunohistochemical studies.
Demographic and anthropometric data were collected from the medical records, including sex, age at the time of transplantation, smoking status, and body mass index; comorbidities such as hypertension, high cholesterol, and diabetes; type and duration of dialysis, and etiology of chronic kidney disease; and average biochemical data from the 6 months prior to transplantation: PTH, phosphate, calcium, magnesium, albumin, and hemoglobin, which were measured in a centralized manner at the laboratory of the Central University Hospital of Asturias using a Cobas® 8000 autoanalyzer (Roche Diagnostics, Switzerland).
The Research Ethics Committee of the Principality of Asturias approved the study (codes 42/2011, 53/2014, 110/2017, and 2022.240). All participants signed informed consent for inclusion in the study. The study was conducted in accordance with the ethical principles for medical research involving human subjects set out in the Declaration of Helsinki.
Determination of vascular calcificationTo determine the calcium content in the epigastric artery, a fragment was frozen with liquid nitrogen, crushed in a mortar, HCl 0.6N was added, and it was kept under agitation at 4 °C for 24 h. After centrifugation, the calcium content in the supernatant was measured using the O-cresolftaleína complexone method.22 The pellet was resuspended in lysis buffer (125 mM Tris and 2% SDS at pH 6.8) to extract the proteins and quantified using the Lowry method (Bio-Rad, USA). The vascular calcium content was normalized by the total protein content and expressed as μg Ca/mg protein.
The VC of the abdominal aorta was also assessed in each patient using a lateral abdominal X-ray in which the Kauppila index was determined, which gives a score between 0 and 24.23
RNA extraction and quantitative real-time PCR in epigastric arteriesAnother fragment of the epigastric artery was frozen in liquid nitrogen and crushed using a mortar. TRI Reagent® (Sigma-Aldrich, Merck KGaA, Germany) was used for RNA extraction following the manufacturer’s instructions. DNA copies were obtained using the High-Capacity cDNA Reverse Transcription kit (Applied Biosystem®, USA), followed by preamplification of the target genes using the TaqMan® PreAmp Master Mix kit (Applied Biosystem®, USA). The gene expression of ADAM17, TIMP3, VCAM, ICAM, TNF-α,α -actin, RUNX2, and DKK1 was measured by quantitative real-time PCR on a QuantStudio 3 Real-Time PCR System (Applied Biosystems, USA) using TaqMan probes (Applied Biosystems, USA). Glyceraldehyde-3-phosphate dehydrogenase was used as a constitutive gene. Relative quantification of genes was performed using theΔΔ Ct24 method. Results were expressed as relative units (R.U.).
Immunohistochemical analysis of RUNX2 expression and nuclear localization in epigastric arteriesIn 38 samples of epigastric arteries (21 non-diabetic and 17 diabetic), the expression and nuclear localization of RUNX2 were analyzed following a previously described protocol.25 The number of RUNX2-positive nuclei and the total number of nuclei were analyzed throughout the sample section. The result was expressed as the percentage of RUNX2-positive nuclei relative to total nuclei in each epigastric artery.
Statistical analysisThe data collected was used to analyze gene expression, calcium content, and biochemical parameters in diabetic and non-diabetic patients. Analyses were also performed based on PTH levels, for which the study population (all patients and diabetics and non-diabetics separately) was divided into two groups: low PTH (
The results were expressed as means and standard deviations. Differences between groups were assessed using Chi-square statistical tests for qualitative variables and Wilcoxon tests for quantitative variables. Correlations were analyzed using Spearman's test and are shown as nonparametric representations (ranges of parametric values of the variables). Differences were considered statistically significant when p < r 0.05. All statistical analyses and graphs were performed using R software for Windows (version 4.1.2; R Foundation for Statistical Computing, Austria).
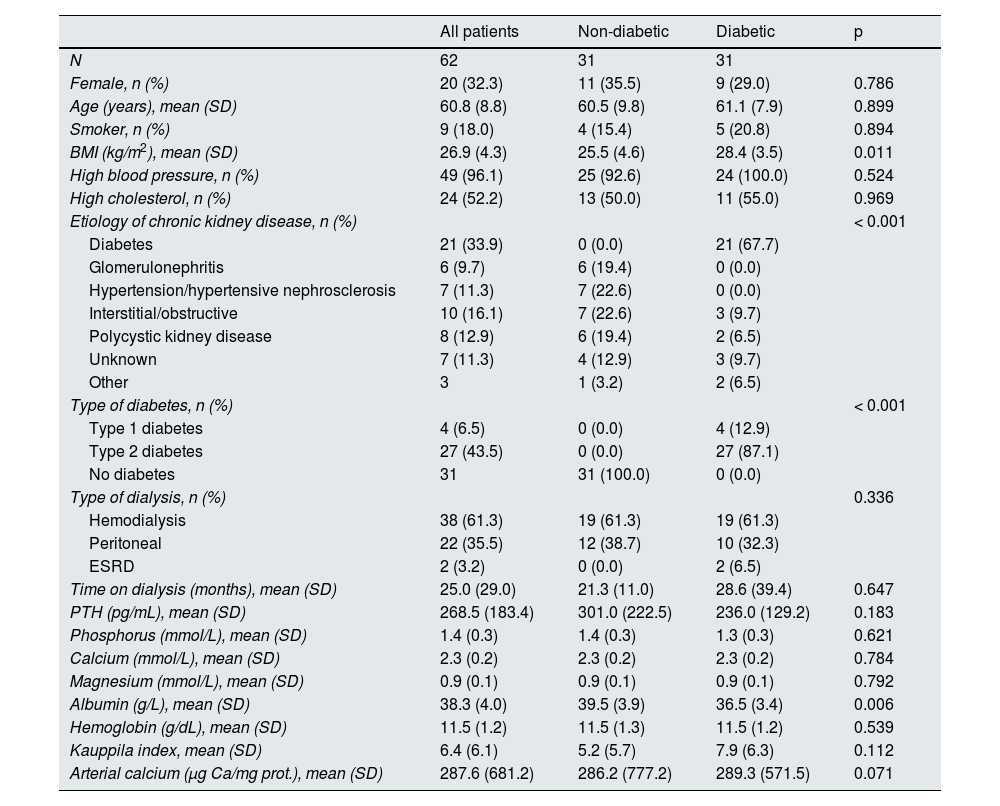
ResultsDemographic characteristics and biochemical values of the patients studiedSamples from the epigastric arteries of 31 non-diabetic and 31 diabetic patients undergoing kidney transplantation were analyzed. The mean age of the patients was 60.8 (8.8) years, 67.7% were men, and they had been on dialysis for a mean of 25 months, with hemodialysis being the most common type of dialysis. The characteristics of the patients are shown in Table 1. Diabetic patients had a significantly higher body mass index than non-diabetic patients, while serum albumin levels were significantly lower (Table 1). In diabetic patients, the most common cause of CKD was diabetes (67.7%), while in non-diabetic patients it was high blood pressure or hypertensive nephrosclerosis (22.6%) and interstitial or obstructive disease (22.6%).
Demographic characteristics and biochemical values in non-diabetic and diabetic patients.
| All patients | Non-diabetic | Diabetic | p | |
|---|---|---|---|---|
| N | 62 | 31 | 31 | |
| Female, n (%) | 20 (32.3) | 11 (35.5) | 9 (29.0) | 0.786 |
| Age (years), mean (SD) | 60.8 (8.8) | 60.5 (9.8) | 61.1 (7.9) | 0.899 |
| Smoker, n (%) | 9 (18.0) | 4 (15.4) | 5 (20.8) | 0.894 |
| BMI (kg/m2), mean (SD) | 26.9 (4.3) | 25.5 (4.6) | 28.4 (3.5) | 0.011 |
| High blood pressure, n (%) | 49 (96.1) | 25 (92.6) | 24 (100.0) | 0.524 |
| High cholesterol, n (%) | 24 (52.2) | 13 (50.0) | 11 (55.0) | 0.969 |
| Etiology of chronic kidney disease, n (%) | < 0.001 | |||
| Diabetes | 21 (33.9) | 0 (0.0) | 21 (67.7) | |
| Glomerulonephritis | 6 (9.7) | 6 (19.4) | 0 (0.0) | |
| Hypertension/hypertensive nephrosclerosis | 7 (11.3) | 7 (22.6) | 0 (0.0) | |
| Interstitial/obstructive | 10 (16.1) | 7 (22.6) | 3 (9.7) | |
| Polycystic kidney disease | 8 (12.9) | 6 (19.4) | 2 (6.5) | |
| Unknown | 7 (11.3) | 4 (12.9) | 3 (9.7) | |
| Other | 3 | 1 (3.2) | 2 (6.5) | |
| Type of diabetes, n (%) | < 0.001 | |||
| Type 1 diabetes | 4 (6.5) | 0 (0.0) | 4 (12.9) | |
| Type 2 diabetes | 27 (43.5) | 0 (0.0) | 27 (87.1) | |
| No diabetes | 31 | 31 (100.0) | 0 (0.0) | |
| Type of dialysis, n (%) | 0.336 | |||
| Hemodialysis | 38 (61.3) | 19 (61.3) | 19 (61.3) | |
| Peritoneal | 22 (35.5) | 12 (38.7) | 10 (32.3) | |
| ESRD | 2 (3.2) | 0 (0.0) | 2 (6.5) | |
| Time on dialysis (months), mean (SD) | 25.0 (29.0) | 21.3 (11.0) | 28.6 (39.4) | 0.647 |
| PTH (pg/mL), mean (SD) | 268.5 (183.4) | 301.0 (222.5) | 236.0 (129.2) | 0.183 |
| Phosphorus (mmol/L), mean (SD) | 1.4 (0.3) | 1.4 (0.3) | 1.3 (0.3) | 0.621 |
| Calcium (mmol/L), mean (SD) | 2.3 (0.2) | 2.3 (0.2) | 2.3 (0.2) | 0.784 |
| Magnesium (mmol/L), mean (SD) | 0.9 (0.1) | 0.9 (0.1) | 0.9 (0.1) | 0.792 |
| Albumin (g/L), mean (SD) | 38.3 (4.0) | 39.5 (3.9) | 36.5 (3.4) | 0.006 |
| Hemoglobin (g/dL), mean (SD) | 11.5 (1.2) | 11.5 (1.3) | 11.5 (1.2) | 0.539 |
| Kauppila index, mean (SD) | 6.4 (6.1) | 5.2 (5.7) | 7.9 (6.3) | 0.112 |
| Arterial calcium (μg Ca/mg prot.), mean (SD) | 287.6 (681.2) | 286.2 (777.2) | 289.3 (571.5) | 0.071 |
SD: standard deviation; ESRD: end-stage renal disease; HTN: hypertension; BMI: body mass index; prot.: protein; PTH: parathyroid hormone.
No significant differences were found between the two groups in terms of sex, age, percentage of smokers, high blood pressure, hyperlipidemia, time on dialysis, type of dialysis, average levels of PTH, phosphorus, calcium, magnesium, and hemoglobin, Kauppila index, or calcium content of the epigastric artery.
A positive correlation was observed between epigastric artery calcium content and abdominal aortic calcification as determined by the Kauppila index (rho = 0.392, p = 0.014) (Appendix B, Supplementary Fig. 1).
Expression analysis in non-diabetic and diabetic patientsIn diabetic patients, the expression of TIMP3 and α -actin was significantly lower, while the expression of VCAM, TNF-α, and RUNX2 was higher compared to non-diabetic patients (Table 2). In diabetic patients, the percentage of RUNX2-positive nuclei was significantly higher than in non-diabetic patients (14.9 [15.8] vs. 31.1 [27.1]; p = 0.038) (Fig. 1A and B).
Gene expression levels and vascular calcification markers in non-diabetic and diabetic patients.
| Non-diabetics | Diabetics | p | |
|---|---|---|---|
| N | 31 | 31 | |
| ADAM17 (U. R.) | 1.0 (0.7) | 1.1 (1.2) | 0.356 |
| TIMP3 (U. R.) | 1.0 (0.8) | 0.6 (0.5) | 0.028 |
| VCAM (U.R.) | 1.0 (0.9) | 2.1 (2.8) | 0.011 |
| ICAM (U.R.) | 1.0 (1.5) | 0.7 (1.0) | 0.751 |
| TNF-α (U. R.) | 1.0 (1.1) | 2.0 (1.9) | 0.008 |
| α-actin (U. R.) | 1.0 (0.6) | 0.7 (0.5) | 0.006 |
| RUNX2 (U. R.) | 1.0 (0.8) | 2.4 (2.8) | 0.009 |
| DKK1 (U. R.) | 1.0 (0.9) | 1.7 (2.4) | 0.840 |
Results are expressed as means and standard deviations.
ADAM17: a disintegrin and metalloproteinase 17; TIMP3: tissue inhibitor of metalloproteinase 3; VCAM: vascular cell adhesion molecules; ICAM: intercellular ad adhesion molecules; TNF-α: tumor necrosis factor-alpha; RUNX2: runt-related transcription factor 2; DKK1: Dickkopf-1; U.R.: relative units.
 Representative images of the expression and localization of RUNX2 in epigastric arteries of non-diabetic and diabetic patients (arrows indicate nuclei with positive staining for RUNX2). Quantification of RUNX2-positive nuclei relative to total nuclei in epigastric arteries of non-diabetic and diabetic patients (*p = 0.038) in B, and in non-diabetic and diabetic patients with serum PTH above the mean (≥ 241 pg/mL) (*p = 0.039) in C, expressed as a percentage.")
Immunohistochemistry of RUNX2 in epigastric arteries. A) Representative images of the expression and localization of RUNX2 in epigastric arteries of non-diabetic and diabetic patients (arrows indicate nuclei with positive staining for RUNX2). Quantification of RUNX2-positive nuclei relative to total nuclei in epigastric arteries of non-diabetic and diabetic patients (*p = 0.038) in B, and in non-diabetic and diabetic patients with serum PTH above the mean (≥ 241 pg/mL) (*p = 0.039) in C, expressed as a percentage.
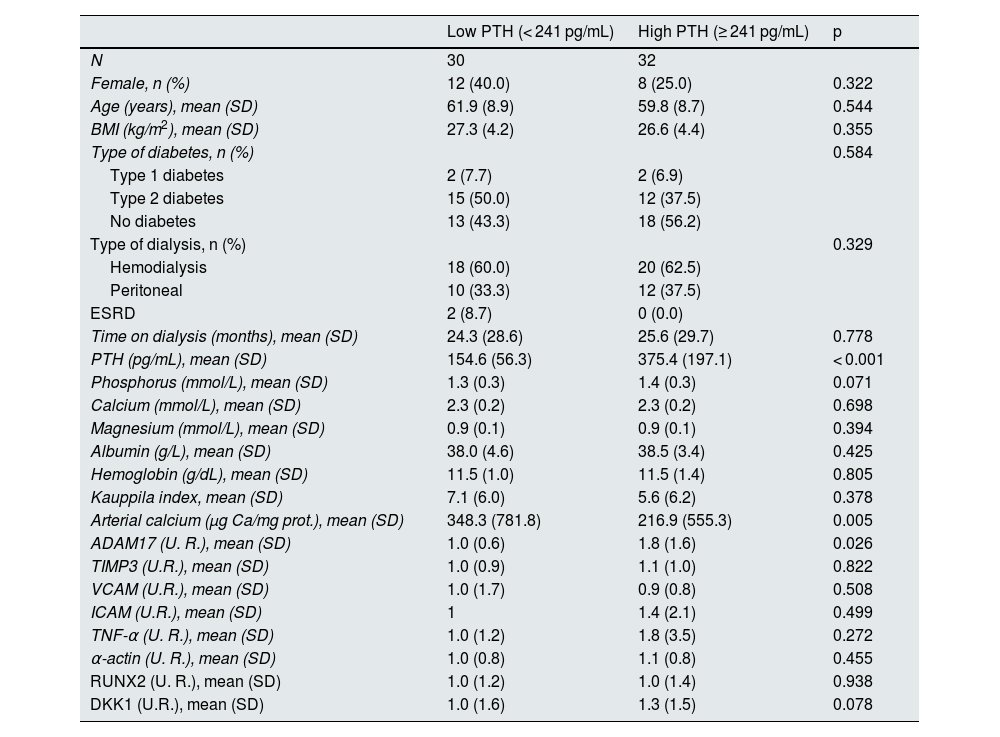
The median serum PTH level in the 62 patients included in the study was 241 pg/mL, which was used to divide the population into 2 groups: low PTH and high PTH (Table 3).
Demographic characteristics, biochemical values, gene expression levels, and vascular calcification markers in patients with low and high serum PTH.
| Low PTH (< 241 pg/mL) | High PTH (≥ 241 pg/mL) | p | |
|---|---|---|---|
| N | 30 | 32 | |
| Female, n (%) | 12 (40.0) | 8 (25.0) | 0.322 |
| Age (years), mean (SD) | 61.9 (8.9) | 59.8 (8.7) | 0.544 |
| BMI (kg/m2), mean (SD) | 27.3 (4.2) | 26.6 (4.4) | 0.355 |
| Type of diabetes, n (%) | 0.584 | ||
| Type 1 diabetes | 2 (7.7) | 2 (6.9) | |
| Type 2 diabetes | 15 (50.0) | 12 (37.5) | |
| No diabetes | 13 (43.3) | 18 (56.2) | |
| Type of dialysis, n (%) | 0.329 | ||
| Hemodialysis | 18 (60.0) | 20 (62.5) | |
| Peritoneal | 10 (33.3) | 12 (37.5) | |
| ESRD | 2 (8.7) | 0 (0.0) | |
| Time on dialysis (months), mean (SD) | 24.3 (28.6) | 25.6 (29.7) | 0.778 |
| PTH (pg/mL), mean (SD) | 154.6 (56.3) | 375.4 (197.1) | < 0.001 |
| Phosphorus (mmol/L), mean (SD) | 1.3 (0.3) | 1.4 (0.3) | 0.071 |
| Calcium (mmol/L), mean (SD) | 2.3 (0.2) | 2.3 (0.2) | 0.698 |
| Magnesium (mmol/L), mean (SD) | 0.9 (0.1) | 0.9 (0.1) | 0.394 |
| Albumin (g/L), mean (SD) | 38.0 (4.6) | 38.5 (3.4) | 0.425 |
| Hemoglobin (g/dL), mean (SD) | 11.5 (1.0) | 11.5 (1.4) | 0.805 |
| Kauppila index, mean (SD) | 7.1 (6.0) | 5.6 (6.2) | 0.378 |
| Arterial calcium (μg Ca/mg prot.), mean (SD) | 348.3 (781.8) | 216.9 (555.3) | 0.005 |
| ADAM17 (U. R.), mean (SD) | 1.0 (0.6) | 1.8 (1.6) | 0.026 |
| TIMP3 (U.R.), mean (SD) | 1.0 (0.9) | 1.1 (1.0) | 0.822 |
| VCAM (U.R.), mean (SD) | 1.0 (1.7) | 0.9 (0.8) | 0.508 |
| ICAM (U.R.), mean (SD) | 1 | 1.4 (2.1) | 0.499 |
| TNF-α (U. R.), mean (SD) | 1.0 (1.2) | 1.8 (3.5) | 0.272 |
| α-actin (U. R.), mean (SD) | 1.0 (0.8) | 1.1 (0.8) | 0.455 |
| RUNX2 (U. R.), mean (SD) | 1.0 (1.2) | 1.0 (1.4) | 0.938 |
| DKK1 (U.R.), mean (SD) | 1.0 (1.6) | 1.3 (1.5) | 0.078 |
SD: standard deviation; ESRD: end-stage renal disease; BMI: body mass index; prot.: protein; PTH: parathyroid hormone; RU: relative units.
In this case, ADAM17 expression in the epigastric arteries was significantly higher in patients with serum PTH levels equal to or above the median. On the other hand, patients with low PTH levels had higher calcium content in the epigastric artery.
No significant differences were found in the other parameters analyzed.
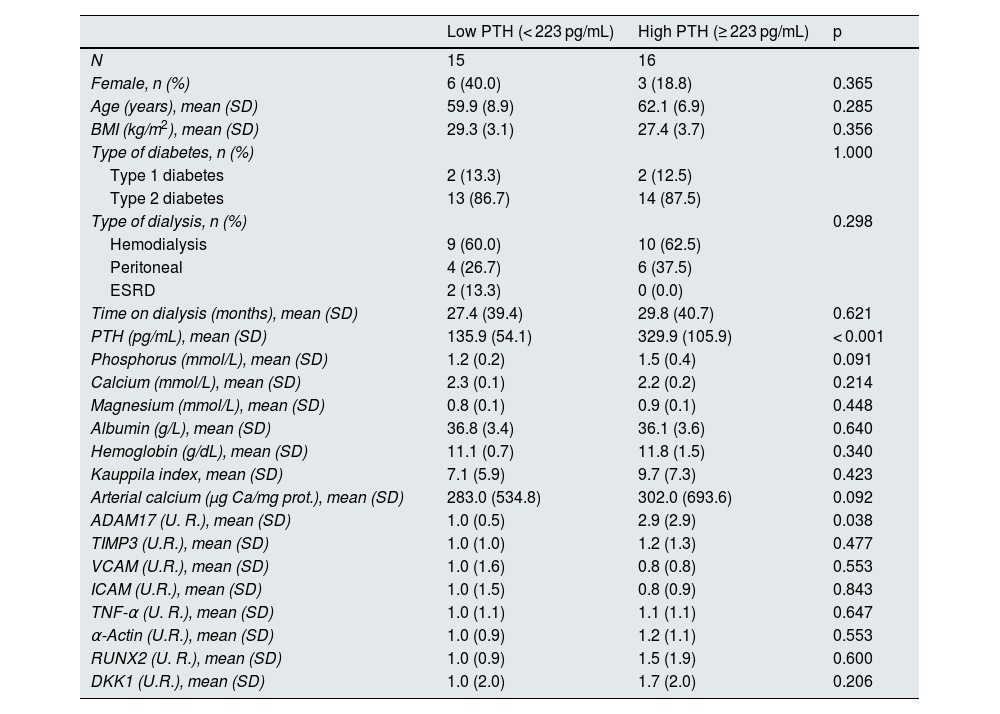
This same analysis was performed considering only patients with diabetes (Table 4). In this case, the median PTH values were 223 pg/mL.
Demographic characteristics, biochemical values, gene expression levels, and vascular calcification markers in diabetic patients with low and high serum PTH.
| Low PTH (< 223 pg/mL) | High PTH (≥ 223 pg/mL) | p | |
|---|---|---|---|
| N | 15 | 16 | |
| Female, n (%) | 6 (40.0) | 3 (18.8) | 0.365 |
| Age (years), mean (SD) | 59.9 (8.9) | 62.1 (6.9) | 0.285 |
| BMI (kg/m2), mean (SD) | 29.3 (3.1) | 27.4 (3.7) | 0.356 |
| Type of diabetes, n (%) | 1.000 | ||
| Type 1 diabetes | 2 (13.3) | 2 (12.5) | |
| Type 2 diabetes | 13 (86.7) | 14 (87.5) | |
| Type of dialysis, n (%) | 0.298 | ||
| Hemodialysis | 9 (60.0) | 10 (62.5) | |
| Peritoneal | 4 (26.7) | 6 (37.5) | |
| ESRD | 2 (13.3) | 0 (0.0) | |
| Time on dialysis (months), mean (SD) | 27.4 (39.4) | 29.8 (40.7) | 0.621 |
| PTH (pg/mL), mean (SD) | 135.9 (54.1) | 329.9 (105.9) | < 0.001 |
| Phosphorus (mmol/L), mean (SD) | 1.2 (0.2) | 1.5 (0.4) | 0.091 |
| Calcium (mmol/L), mean (SD) | 2.3 (0.1) | 2.2 (0.2) | 0.214 |
| Magnesium (mmol/L), mean (SD) | 0.8 (0.1) | 0.9 (0.1) | 0.448 |
| Albumin (g/L), mean (SD) | 36.8 (3.4) | 36.1 (3.6) | 0.640 |
| Hemoglobin (g/dL), mean (SD) | 11.1 (0.7) | 11.8 (1.5) | 0.340 |
| Kauppila index, mean (SD) | 7.1 (5.9) | 9.7 (7.3) | 0.423 |
| Arterial calcium (μg Ca/mg prot.), mean (SD) | 283.0 (534.8) | 302.0 (693.6) | 0.092 |
| ADAM17 (U. R.), mean (SD) | 1.0 (0.5) | 2.9 (2.9) | 0.038 |
| TIMP3 (U.R.), mean (SD) | 1.0 (1.0) | 1.2 (1.3) | 0.477 |
| VCAM (U.R.), mean (SD) | 1.0 (1.6) | 0.8 (0.8) | 0.553 |
| ICAM (U.R.), mean (SD) | 1.0 (1.5) | 0.8 (0.9) | 0.843 |
| TNF-α (U. R.), mean (SD) | 1.0 (1.1) | 1.1 (1.1) | 0.647 |
| α-Actin (U.R.), mean (SD) | 1.0 (0.9) | 1.2 (1.1) | 0.553 |
| RUNX2 (U. R.), mean (SD) | 1.0 (0.9) | 1.5 (1.9) | 0.600 |
| DKK1 (U.R.), mean (SD) | 1.0 (2.0) | 1.7 (2.0) | 0.206 |
SD: standard deviation; ESRD: end-stage renal disease; BMI: body mass index; prot.: protein; PTH: parathyroid hormone; R.U.: relative units.
In diabetic patients with serum PTH levels equal to or above the median, ADAM17 expression in the epigastric arteries was significantly higher compared to those with PTH levels below the median. No significant differences were found in the other parameters analyzed.
No statistically significant correlations were found between serum PTH levels and the markers of inflammation and calcification analyzed in this study in diabetic patients, although a trend can be observed between serum PTH levels and ADAM17 expression in the epigastric artery (rho = 0.359, p = 0.051) (Appendix B, Supplementary Figs. 2 and 4).
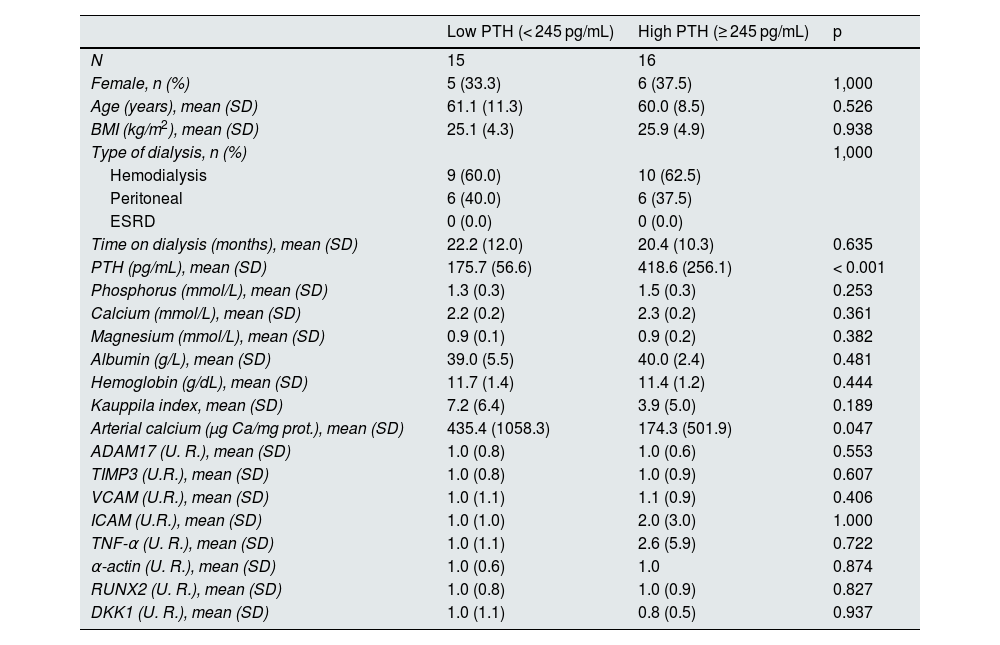
The same analysis was performed in non-diabetic patients, with a median value of 245 mg/dL dividing the population into low and high PTH groups (Table 5).
Demographic characteristics, biochemical values, gene expression levels, and vascular calcification markers in non-diabetic patients with low and high serum PTH levels.
| Low PTH (< 245 pg/mL) | High PTH (≥ 245 pg/mL) | p | |
|---|---|---|---|
| N | 15 | 16 | |
| Female, n (%) | 5 (33.3) | 6 (37.5) | 1,000 |
| Age (years), mean (SD) | 61.1 (11.3) | 60.0 (8.5) | 0.526 |
| BMI (kg/m2), mean (SD) | 25.1 (4.3) | 25.9 (4.9) | 0.938 |
| Type of dialysis, n (%) | 1,000 | ||
| Hemodialysis | 9 (60.0) | 10 (62.5) | |
| Peritoneal | 6 (40.0) | 6 (37.5) | |
| ESRD | 0 (0.0) | 0 (0.0) | |
| Time on dialysis (months), mean (SD) | 22.2 (12.0) | 20.4 (10.3) | 0.635 |
| PTH (pg/mL), mean (SD) | 175.7 (56.6) | 418.6 (256.1) | < 0.001 |
| Phosphorus (mmol/L), mean (SD) | 1.3 (0.3) | 1.5 (0.3) | 0.253 |
| Calcium (mmol/L), mean (SD) | 2.2 (0.2) | 2.3 (0.2) | 0.361 |
| Magnesium (mmol/L), mean (SD) | 0.9 (0.1) | 0.9 (0.2) | 0.382 |
| Albumin (g/L), mean (SD) | 39.0 (5.5) | 40.0 (2.4) | 0.481 |
| Hemoglobin (g/dL), mean (SD) | 11.7 (1.4) | 11.4 (1.2) | 0.444 |
| Kauppila index, mean (SD) | 7.2 (6.4) | 3.9 (5.0) | 0.189 |
| Arterial calcium (μg Ca/mg prot.), mean (SD) | 435.4 (1058.3) | 174.3 (501.9) | 0.047 |
| ADAM17 (U. R.), mean (SD) | 1.0 (0.8) | 1.0 (0.6) | 0.553 |
| TIMP3 (U.R.), mean (SD) | 1.0 (0.8) | 1.0 (0.9) | 0.607 |
| VCAM (U.R.), mean (SD) | 1.0 (1.1) | 1.1 (0.9) | 0.406 |
| ICAM (U.R.), mean (SD) | 1.0 (1.0) | 2.0 (3.0) | 1.000 |
| TNF-α (U. R.), mean (SD) | 1.0 (1.1) | 2.6 (5.9) | 0.722 |
| α-actin (U. R.), mean (SD) | 1.0 (0.6) | 1.0 | 0.874 |
| RUNX2 (U. R.), mean (SD) | 1.0 (0.8) | 1.0 (0.9) | 0.827 |
| DKK1 (U. R.), mean (SD) | 1.0 (1.1) | 0.8 (0.5) | 0.937 |
SD: standard deviation; ESRD: end-stage renal disease; BMI: body mass index; prot.: protein; PTH: parathyroid hormone; RU: relative units.
In the group of non-diabetic patients, the calcium content of the epigastric artery was significantly higher in patients with low PTH compared to non-diabetic patients with high PTH. No significant differences were found in the other parameters analyzed (Table 5).
No statistically significant correlations were found between serum PTH levels and the markers of inflammation and calcification analyzed in this study in non-diabetic patients (Appendix B, Supplementary Figs. 3 and 5).
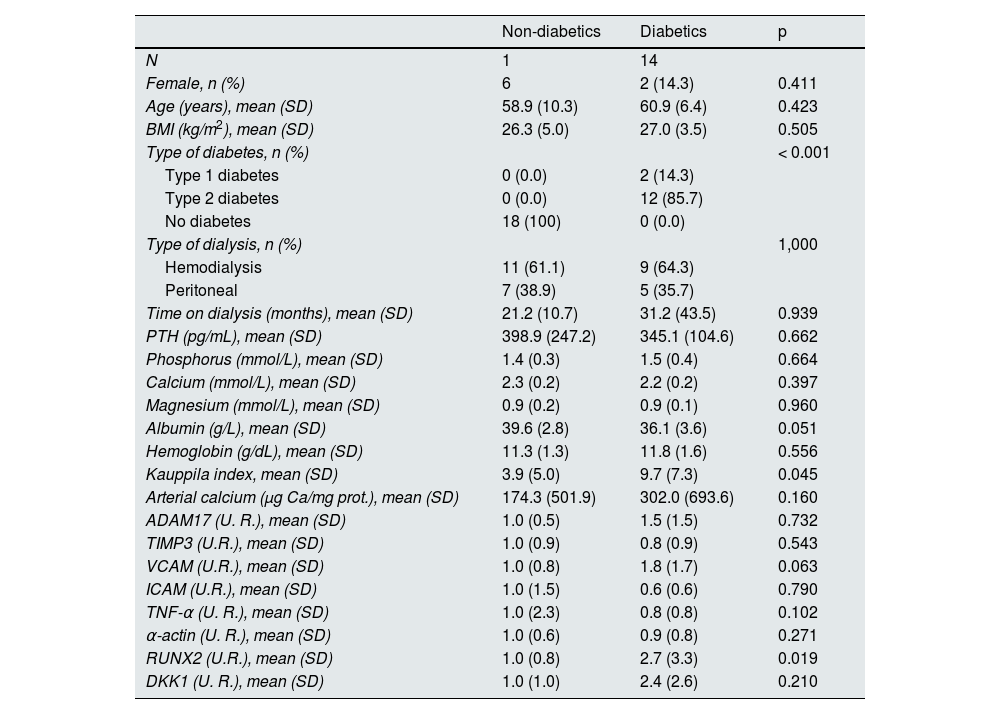
Expression analysis in diabetic and non-diabetic patients with elevated PTHIn the group of patients with serum PTH levels equal to or above the median, RUNX2 expression and the Kauppila index were significantly higher in diabetic patients compared to non-diabetic patients (Table 6). A significant increase was also observed in the proportion of RUNX2-positive nuclei relative to total nuclei in the epigastric arteries of diabetic patients compared with non-diabetic patients with elevated PTH (13.3 [17.0] vs. 32.9 [27.2]; p = 0.039) (Fig. 1C).
Demographic characteristics, biochemical values, gene expression levels, and vascular calcification markers in non-diabetic and diabetic patients with serum PTH above the median (≥ 241 pg/mL).
| Non-diabetics | Diabetics | p | |
|---|---|---|---|
| N | 1 | 14 | |
| Female, n (%) | 6 | 2 (14.3) | 0.411 |
| Age (years), mean (SD) | 58.9 (10.3) | 60.9 (6.4) | 0.423 |
| BMI (kg/m2), mean (SD) | 26.3 (5.0) | 27.0 (3.5) | 0.505 |
| Type of diabetes, n (%) | < 0.001 | ||
| Type 1 diabetes | 0 (0.0) | 2 (14.3) | |
| Type 2 diabetes | 0 (0.0) | 12 (85.7) | |
| No diabetes | 18 (100) | 0 (0.0) | |
| Type of dialysis, n (%) | 1,000 | ||
| Hemodialysis | 11 (61.1) | 9 (64.3) | |
| Peritoneal | 7 (38.9) | 5 (35.7) | |
| Time on dialysis (months), mean (SD) | 21.2 (10.7) | 31.2 (43.5) | 0.939 |
| PTH (pg/mL), mean (SD) | 398.9 (247.2) | 345.1 (104.6) | 0.662 |
| Phosphorus (mmol/L), mean (SD) | 1.4 (0.3) | 1.5 (0.4) | 0.664 |
| Calcium (mmol/L), mean (SD) | 2.3 (0.2) | 2.2 (0.2) | 0.397 |
| Magnesium (mmol/L), mean (SD) | 0.9 (0.2) | 0.9 (0.1) | 0.960 |
| Albumin (g/L), mean (SD) | 39.6 (2.8) | 36.1 (3.6) | 0.051 |
| Hemoglobin (g/dL), mean (SD) | 11.3 (1.3) | 11.8 (1.6) | 0.556 |
| Kauppila index, mean (SD) | 3.9 (5.0) | 9.7 (7.3) | 0.045 |
| Arterial calcium (μg Ca/mg prot.), mean (SD) | 174.3 (501.9) | 302.0 (693.6) | 0.160 |
| ADAM17 (U. R.), mean (SD) | 1.0 (0.5) | 1.5 (1.5) | 0.732 |
| TIMP3 (U.R.), mean (SD) | 1.0 (0.9) | 0.8 (0.9) | 0.543 |
| VCAM (U.R.), mean (SD) | 1.0 (0.8) | 1.8 (1.7) | 0.063 |
| ICAM (U.R.), mean (SD) | 1.0 (1.5) | 0.6 (0.6) | 0.790 |
| TNF-α (U. R.), mean (SD) | 1.0 (2.3) | 0.8 (0.8) | 0.102 |
| α-actin (U. R.), mean (SD) | 1.0 (0.6) | 0.9 (0.8) | 0.271 |
| RUNX2 (U.R.), mean (SD) | 1.0 (0.8) | 2.7 (3.3) | 0.019 |
| DKK1 (U. R.), mean (SD) | 1.0 (1.0) | 2.4 (2.6) | 0.210 |
SD: standard deviation; BMI: body mass index; prot.: protein; PTH: parathyroid hormone; U. R.: relative units.
In the present study, the epigastric arteries of diabetic patients on dialysis showed greater inflammation (less TIMP3 expression and more VCAM and TNF-α expression) along with a loss of contractile muscle phenotype (α -actin) and greater expression of bone phenotype markers (RUNX2) compared with non-diabetics (Table 1). In addition, elevated PTH was associated with higher ADAM17 expression, although lower calcium content in the epigastric artery. In diabetic patients, elevated PTH was also associated with higher ADAM17 expression, while in non-diabetics, low PTH was associated with more calcification of the epigastric artery (Tables 4 and 5, respectively). The combination of both circumstances, elevated PTH and diabetes, was associated with higher expression of RUNX2 and greater calcification of the abdominal artery (Table 6).
Despite advances in dialysis techniques, the mortality rate of patients undergoing chronic hemodialysis remains high.26 Diabetes is one of the factors that has the greatest impact on increased mortality risk in CKD, especially in dialysis patients, whose risk is twice that of non-diabetic patients.11,27 Several factors may contribute to this increase in mortality, such as blood glucose levels. Although a reduction in glucose levels decreases the risk of microvascular complications, glycemic control alone is not sufficient to reduce the risk of macrovascular complications.28 On the other hand, elevated PTH levels are associated with a higher incidence of cardiovascular events and rapid progression of CKD.29 However, to our knowledge, there are no studies evaluating the combined effect of elevated PTH levels and diabetes on the vascular system of dialysis patients at the molecular level.
In the epigastric arteries of diabetic patients, lower TIMP3 expression was observed along with increased expression of proinflammatory factors such as TNF-α, and VCAM compared to non-diabetics (Table 3). Reduced TIMP3 expression has been linked to the onset and progression of diabetic kidney disease30 and increased ADAM17 activity and circulating levels of TNF-α, and VCAM.31 TIMP3 inhibits ADAM17 by binding to its catalytic domain, blocking its function.17 ADAM17 activity was not analyzed in the present study, but the inhibition of TIMP3 and the increase in the expression of TNF-α, and VCAM could lead to increased circulating levels of these inflammation-related molecules. The decrease in TIMP3 expression could be due to the increase in RUNX2 expression, as several studies describe RUNX2 as an inhibitor of TIMP3 expression.32,33 On the other hand, the increase in RUNX2 and the decrease in α -actin would indicate a change in phenotype from vascular smooth muscle cells to osteoblast-associated type associated with VC,34 although no changes were observed in the calcium content of the arteries or in the Kauppila index. These results could indicate greater inflammation and faster progression to CV in diabetic patients compared to non-diabetic patients.
Diabetic patients with PTH levels above the median showed higher gene and protein expression of RUNX2 and a higher Kauppila index, which would indicate greater VC burden compared to non-diabetic patients with elevated PTH (Table 6). In CKD, high PTH levels have been associated with increases in serum phosphorus and calcium levels, leading to greater CKD progression and increases in LVH and valvular disease.29,34–36 Furthermore, in type 2 diabetic patients without severe CKD, elevated serum PTH levels are also associated with increased peripheral LVMI.37 In the present study, in contrast, when non-diabetic patients were analyzed, low PTH levels were associated with higher calcium content in the epigastric artery, as described in other studies.38 These results, where low and high PTH values are associated with calcification, have been previously described in in vitro culture,34 and both have been linked to increased cardiovascular mortality.39 These findings seem to indicate that PTH could be a mediator of different processes in diabetic and non-diabetic patients.
Several studies have shown that glucose activates the expression and activity of ADAM17,19,40 which in turn has been correlated with insulin resistance.41 In our study, no statistically significant differences were found in the expression of ADAM17 between diabetics and non-diabetics. However, ADAM17 expression appears to be related to PTH, as serum PTH levels above the median were associated with higher ADAM17 expression. These data confirm previous results from our group, in which lower ADAM17 expression was observed in the hearts of animals with chronic renal failure and parathyroidectomy compared to non-parathyroidectomy patients.42
The highest expression of ADAM17 was also observed, and with even more marked changes, in diabetic patients with elevated PTH compared to diabetics with low PTH. These differences in ADAM17 expression were not found in non-diabetic patients. Therefore, ADAM17 expression in the epigastric arteries appears to be related to PTH levels only in diabetic patients. Although ADAM17 activity was not analyzed in this study, other studies have shown a correlation between increased expression of this protein and increased activity.19 Therefore, the higher expression of ADAM17 observed in diabetic patients with elevated PTH could be associated with a higher inflammatory state due to the release of proinflammatory factors such as TNF-α, VCAM, and ICAM, compared to diabetic patients with low PTH.
Previous studies have shown an association between serum magnesium levels and PTH.43 In addition, hypomagnesemia has been linked to inflammation, cardiovascular mortality, and VC, mainly in patients with diabetes, in whom hypomagnesemia is much more common.44 Clinical studies have shown that magnesium supplementation has a regulatory effect on the immune response.45 In our study, no significant differences in magnesium levels were found between the different groups of patients analyzed that could explain the differences found in inflammatory parameters.
Although this study delves into various aspects of the interrelationship between diabetes, PTH, and inflammation, several limitations must be acknowledged, such as the fact that PTH levels were not excessively high. While in the COSMOS study, increased mortality in diabetic patients was mainly observed with serum PTH levels of >400 pg/mL, in the present study only 11 (17.7%) had levels above that value. The greater availability of treatments such as calcimimetics, unlike at the time of the COSMOS study, may have contributed to the lower PTH levels in the present study. Furthermore, the COSMOS study only included patients on hemodialysis, whereas the present study also included patients on peritoneal dialysis and with advanced CKD. Another limitation of the study is that serum levels of fibroblast growth factor 23, a regulator of PTH expression that increases in inflammatory conditions46 and correlates positively with VC,47 were not available.
ConclusionThe results of this study did not show a relationship between elevated PTH levels and the expression of ADAM17, its inhibitor TIMP3, and the proinflammatory factors ICAM, VCAM, and TNF-α in diabetic patients compared to non-diabetic patients. However, it did find that elevated serum PTH levels correlated with increased ADAM17 expression in diabetic patients. Therefore, the relationship between inflammation and elevated serum PTH levels in diabetic patients should not be completely ruled out, and clarifying these results would require further studies.
In addition, diabetic patients with elevated PTH concentrations showed increased expression of RUNX2 and the Kauppila index, which could indicate faster progression of VC, which is negatively associated with survival,2–4 which may partly explain the higher mortality observed in diabetic patients with high PTH compared to non-diabetics, as found in the COSMOS study.
FundingThis work was made possible thanks to a 2021 research grant in nephrology from the Senefro Foundation and the Spanish Society of Nephrology for “Association between PTH levels and inflammation in the risk of mortality in diabetic patients with chronic kidney disease. An experimental clinical study.” This study has also been funded by the Carlos III Health Institute (ISCIII, PI14/00707, PI17/00384, PI20/00633, PI22/00195, PI23/00833, and PI24/01785) and the RICORS program (RD21/0005/0019 and RD24/0004/006) funded by the European Union-Next Generation, Mechanism for Recovery and Resilience (MRR), Science, Technology and Innovation Plan 2018-2027 of the Principality of Asturias (IDI-2018-000152, IDI/2021/000080 and IDE/2024/000706) and the Íñigo Álvarez de Toledo Renal Foundation (FRIAT). B.M.C. and S.F.V. have received funding through a grant from the Government of the Principality of Asturias (Severo Ochoa Program BP19-057 and BP20-081), N.G.G. from the ISCIII (PFIS Program, FI23/00007), S.P. and N.C.L. by ISCIII (Miguel Servet Program CP23/00105 and CP23/00058, respectively) and co-funded by the European Union, and C.A.M. by the Biosanitaria Foundation of the Principality of Asturias (ISPA).
The authors declare that they have no conflicts of interest.
We would like to express our gratitude to all the patients who participated in the study, to Francisco Otero García and Pilar Alonso Suarez, from the Transplant Coordination Unit of the Central University Hospital of Asturias, for their assistance with sample collection, and to the BioBank of the Principality of Asturias for its help in the processing and storage of the epigastric arteries. We would also like to thank the Asociación para la lucha contra las Enfermedades Renales de Asturias (ALCER) and the Asociación de Diabéticos del Principado de Asturias (ASDIPAS) for their support for basic research.
The following is Supplementary data to this article:


AL DÍA

