


Hereditary transthyretin amyloidosis (ATTRv) is a progressive, autosomal dominant multisystem disorder. While nerves and heart are most affected, the kidneys may also be involved. Renal amyloid deposition may involve glomeruli and other compartments. Subclinical tubulointerstitial involvement may be an early sign. We aimed to assess tubular function in ATTRv.
We conducted a cross-sectional study of ATTRv patients aged>18 years with an estimated GFR>45mL/min/1.73m2. Participants underwent a 12-h water deprivation test. We assessed urine biomarkers: albumin, protein, β2-microglobulin (uβ2M), gamma-glutamyltransferase (uϒGT), specific gravity by dipstick (uSG), and urine osmolality (uOSM) to detect urinary concentrating disorder (UCD). Fractional excretion was calculated from a 24-h urine collection. We used Spearman correlation and ROC curve analysis.
Among 49 subjects (median age 40; 63% female; 84% Caucasian), 94% had the V50M variant and 57% had neurologic or cardiac symptoms. Uβ2M was elevated in 2 subjects; 53% had UCD. uSG correlated with uOSM (Rho=0.78, p<0.001); uSG>1.015 excluded UCD (AUC=0.89). The symptomatic subgroup (n=28) had a higher prevalence of UCD. The UCD subgroup (n=26) had more neuro/cardiac symptoms. uϒGT was elevated in 35%. uϒGT levels did not differ between subgroups. ATTRv individuals with preserved renal function had a high prevalence of UCD and increased uϒGT.
Further studies should explore the clinical impact and treatments.
La amiloidosis hereditaria por transtiretina (ATTRv) es un trastorno multisistémico progresivo de herencia autosómica dominante. Aunque los nervios y el corazón son los órganos más afectados, los riñones también pueden verse comprometidos. Los depósitos amiloides renales pueden afectar los glomérulos y otros compartimentos. El compromiso túbulo-intersticial subclínico puede ser un signo temprano. Nuestro objetivo fue evaluar la función tubular en pacientes con ATTRv.
Se realizó un estudio transversal en pacientes con ATTRv mayores de 18 años y con tasa de filtración glomerular estimada (TFGe)>45mL/min/1,73m2. Los participantes fueron sometidos a una prueba de restricción hídrica de 12 horas. Se evaluaron biomarcadores urinarios: albúmina, proteína, β2-microglobulina (uβ2M), gamma-glutamiltransferasa (uϒGT), densidad específica por tira reactiva (uSG) y osmolalidad urinaria (uOSM) para detectar trastorno de la concentración urinaria (UCD). La excreción fraccional se calculó a partir de la orina de 24 horas. Se utilizaron análisis de correlación de Spearman y de la curva ROC.
Entre 49 sujetos (edad mediana de 40 años, 63% mujeres, 84% caucásicos), el 94% presentó la variante V50M y el 57% presentó síntomas neurológicos y/o cardíacos. uβ2M se encontró elevada en 2 individuos; el 53% presentó UCD. uSG se correlacionó con uOSM (Rho=0,78; p<0,001); uSG>1,015 excluyó UCD (AUC=0,89). El subgrupo sintomático (n=28) presentó una mayor prevalencia de UCD. El subgrupo con UCD (n=26) presentó más síntomas neurológicos y/o cardíacos. uϒGT se encontró elevada en un 35%. Los niveles de uϒGT no difirieron entre los subgrupos. Indivíduos con ATTRv y función renal preservada presentaron una alta prevalencia de UCD y un aumento de uϒGT.
Se requieren estudios adicionales para explorar el impacto clínico y las opciones terapéuticas.
Hereditary transthyretin amyloidosis (ATTRv) is a rare, autosomal dominant multisystem disease with a progressive and disabling course. It results from mutations in the transthyretin (TTR) gene, leading to unstable TTR molecules that deposit as amyloid fibrils in various tissues.1 Although ATTRv is multisystemic, the peripheral nervous system and heart are most frequently affected. Renal involvement is also possible. The classic renal manifestation is glomerular, with proteinuria (from subnephrotic to nephrotic syndrome) and/or reduced glomerular filtration rate (GFR).2 Other renal manifestations, including tubular dysfunction, have been investigated only rarely, and significant knowledge gaps remain regarding their clinical relevance. However, renal biopsies have revealed amyloid deposits in multiple compartments, including glomeruli, tubulointerstitial regions, and vessels.3
Glomerular and tubulointerstitial integrity can also be assessed noninvasively using specific tools. Glomerular function is typically evaluated by serum creatinine and/or cystatin C using the CKD-EPI equation, or by 24-h creatinine clearance.4 Urinary albumin and/or protein excretion is measured in spot or 24-h urine samples.5 Proximal tubular function is assessed by calculating the fractional excretion (FE) of phosphorus, potassium, and uric acid, along with the detection of glycosuria and tubular injury biomarkers. Some biomarkers, such as β2-microglobulin (uβ2M), are well established, whereas others, such as gamma-glutamyl transpeptidase (uϒGT), are less commonly used. uϒGT, located in the brush border of proximal tubular cells, has been studied in diabetes, nephrotoxicity, and critical illness.6–8 It may serve as an early marker of tubular injury and correlates with albuminuria.9
Specific biomarkers for distal tubular function are lacking. However, impairment of urinary concentration may reflect altered functional integrity of the distal nephron, particularly the collecting duct segment involved in vasopressin-mediated water reabsorption. For this purpose, urine specific gravity (uSG) can be determined by dipstick, and, if available, urine osmolality (uOSM) by osmometry (the gold standard).
Given the limited data on renal involvement in ATTRv, we aimed to assess glomerular and tubular function in both symptomatic and asymptomatic subjects. We hypothesized that renal dysfunction, particularly subclinical tubular involvement consistent with amyloid deposition, may be present.
Patients and methodsThis cross-sectional study aimed to assess the prevalence of glomerular and tubular renal disorders in individuals with TTR mutations, followed at the Antonio Rodrigues de Mello Paramyloidosis Study Center (CEPARM), located in the Clementino Fraga Filho University Hospital (HUCFF), Federal University of Rio de Janeiro (UFRJ), Brazil.
We included symptomatic and asymptomatic individuals aged 18 years or older with GFR>45mL/min/1.73m2, estimated using the CKD-EPI equation. This relatively preserved level of GFR allows for earlier diagnosis of renal tubular function impairment and less bias in the interpretation of functional tests. Exclusion criteria were: active urinary tract infection, acute diarrhea, HIV, HBV or HCV infection, neurogenic bladder, autoimmune diseases, pregnancy, chronic use of nephrotoxic agents (e.g., NSAIDs), or inability to discontinue loop diuretics for more than 48h. Patients were evaluated between March 2019 and February 2020.
Symptomatic patients were defined as those presenting with sensorimotor polyneuropathy, dysautonomia, cardiac conduction disturbances, arrhythmias, or systolic/diastolic dysfunction. Asymptomatic individuals had a positive genetic test but no clinical signs or symptoms listed above.10–12
All participants had their last meal at 8:00p.m. on the evening before testing, then underwent complete fasting from solids and liquids until 8:00a.m. the next morning to achieve maximal urinary concentration over 12h (Water Deprivation Test – WDT). The protocol comprised two distinct phases. The home (overnight) phase began at 8:00p.m. and lasted 12h, during which participants were instructed to abstain from all food and fluid intake. Patients using loop diuretics discontinued their medication 48h before the functional tests. They received standardized written and verbal guidance, including clear instructions to discontinue the test if marked weakness, hypotension, dizziness, or any sudden gastrointestinal symptoms, such as nausea, vomiting, or diarrhea, were observed. The hospital phase started at 8:00a.m. the following morning. It was based on previously validated, internationally recognized models.13,14 Upon arrival at the hospital, the first urine sample (baseline sample) was collected for subsequent measurements: uSG by dipstick and uOSM by freezing-point depression (Advanced® Instruments Osmometer Model 3320, USA) to diagnose urine concentration disorder (UCD). UCD was defined as uOSM<680mOsm/kgH2O after WDT.15
Venous blood was collected at the same time for the following tests: complete blood count, glucose, HbA1c, electrolytes (Na, K, Ca, Mg, P, Cl), uric acid, albumin, urea, creatinine, intact PTH (12–65pg/mL), and vitamin D (25(OH)D3) (>30ng/mL).
In the same week, 24-h urine samples were collected to measure proteinuria (normal<150mg/24h), albuminuria (<30mg/24h), creatinine, Na, K, Ca, Mg, P, Cl, and uric acid.16 Spot urine samples were also collected for albumin and protein quantification, as well as for determination of uβ2M by ELISA (Sigma–Aldrich SDS-PAGE kit, Saint Louis, USA) (<0.25mg/L) and uϒGT by its enzyme activity and the results were adjusted by urinary creatinine at the same sample (Bioclin Kit #K080, Belo Horizonte, MG, Brazil) (14–79U/g creatinine).17
From these samples, we estimated GFR using the CKD-EPI equation and measured GFR via 24-h creatinine clearance (>60mL/min). Protein intake was assessed by protein nitrogen appearance (PNA=[(urea×0.46)+2]×6.25/body weight; 0.8–1.2g protein/kg/day), and NaCl intake was also calculated. FE of electrolytes was calculated using: FE=100×(urine electrolyte×plasma creatinine)/(plasma electrolyte×urine creatinine). Reference values for FE were: Na<1%, K<30%, Ca<3%, phosphate reabsorption rate (PRR)>80%, Mg<6%, and uric acid<10%.
Categorical variables were reported as absolute numbers and percentages; continuous variables as mean±SD or median (IQR). Group comparisons used Chi-squared tests for categorical variables and Student's t test or Mann–Whitney U test for continuous variables. Associations between variables were analyzed using Spearman's correlation and linear regression. The diagnostic accuracy of uSG for UCD was assessed using receiver operating characteristic (ROC) curve analysis. All analyses were conducted using IBM SPSS Statistics version 24 (USA), with statistical significance set at p<0.05 (two-tailed).
The study was approved by the HUCFF-UFRJ local ethics committee (approval no. 47772021.5.0000.5257). All procedures adhered to institutional and national research ethics standards, as well as the 1964 Declaration of Helsinki and its amendments. All participants provided written informed consent before study enrollment.
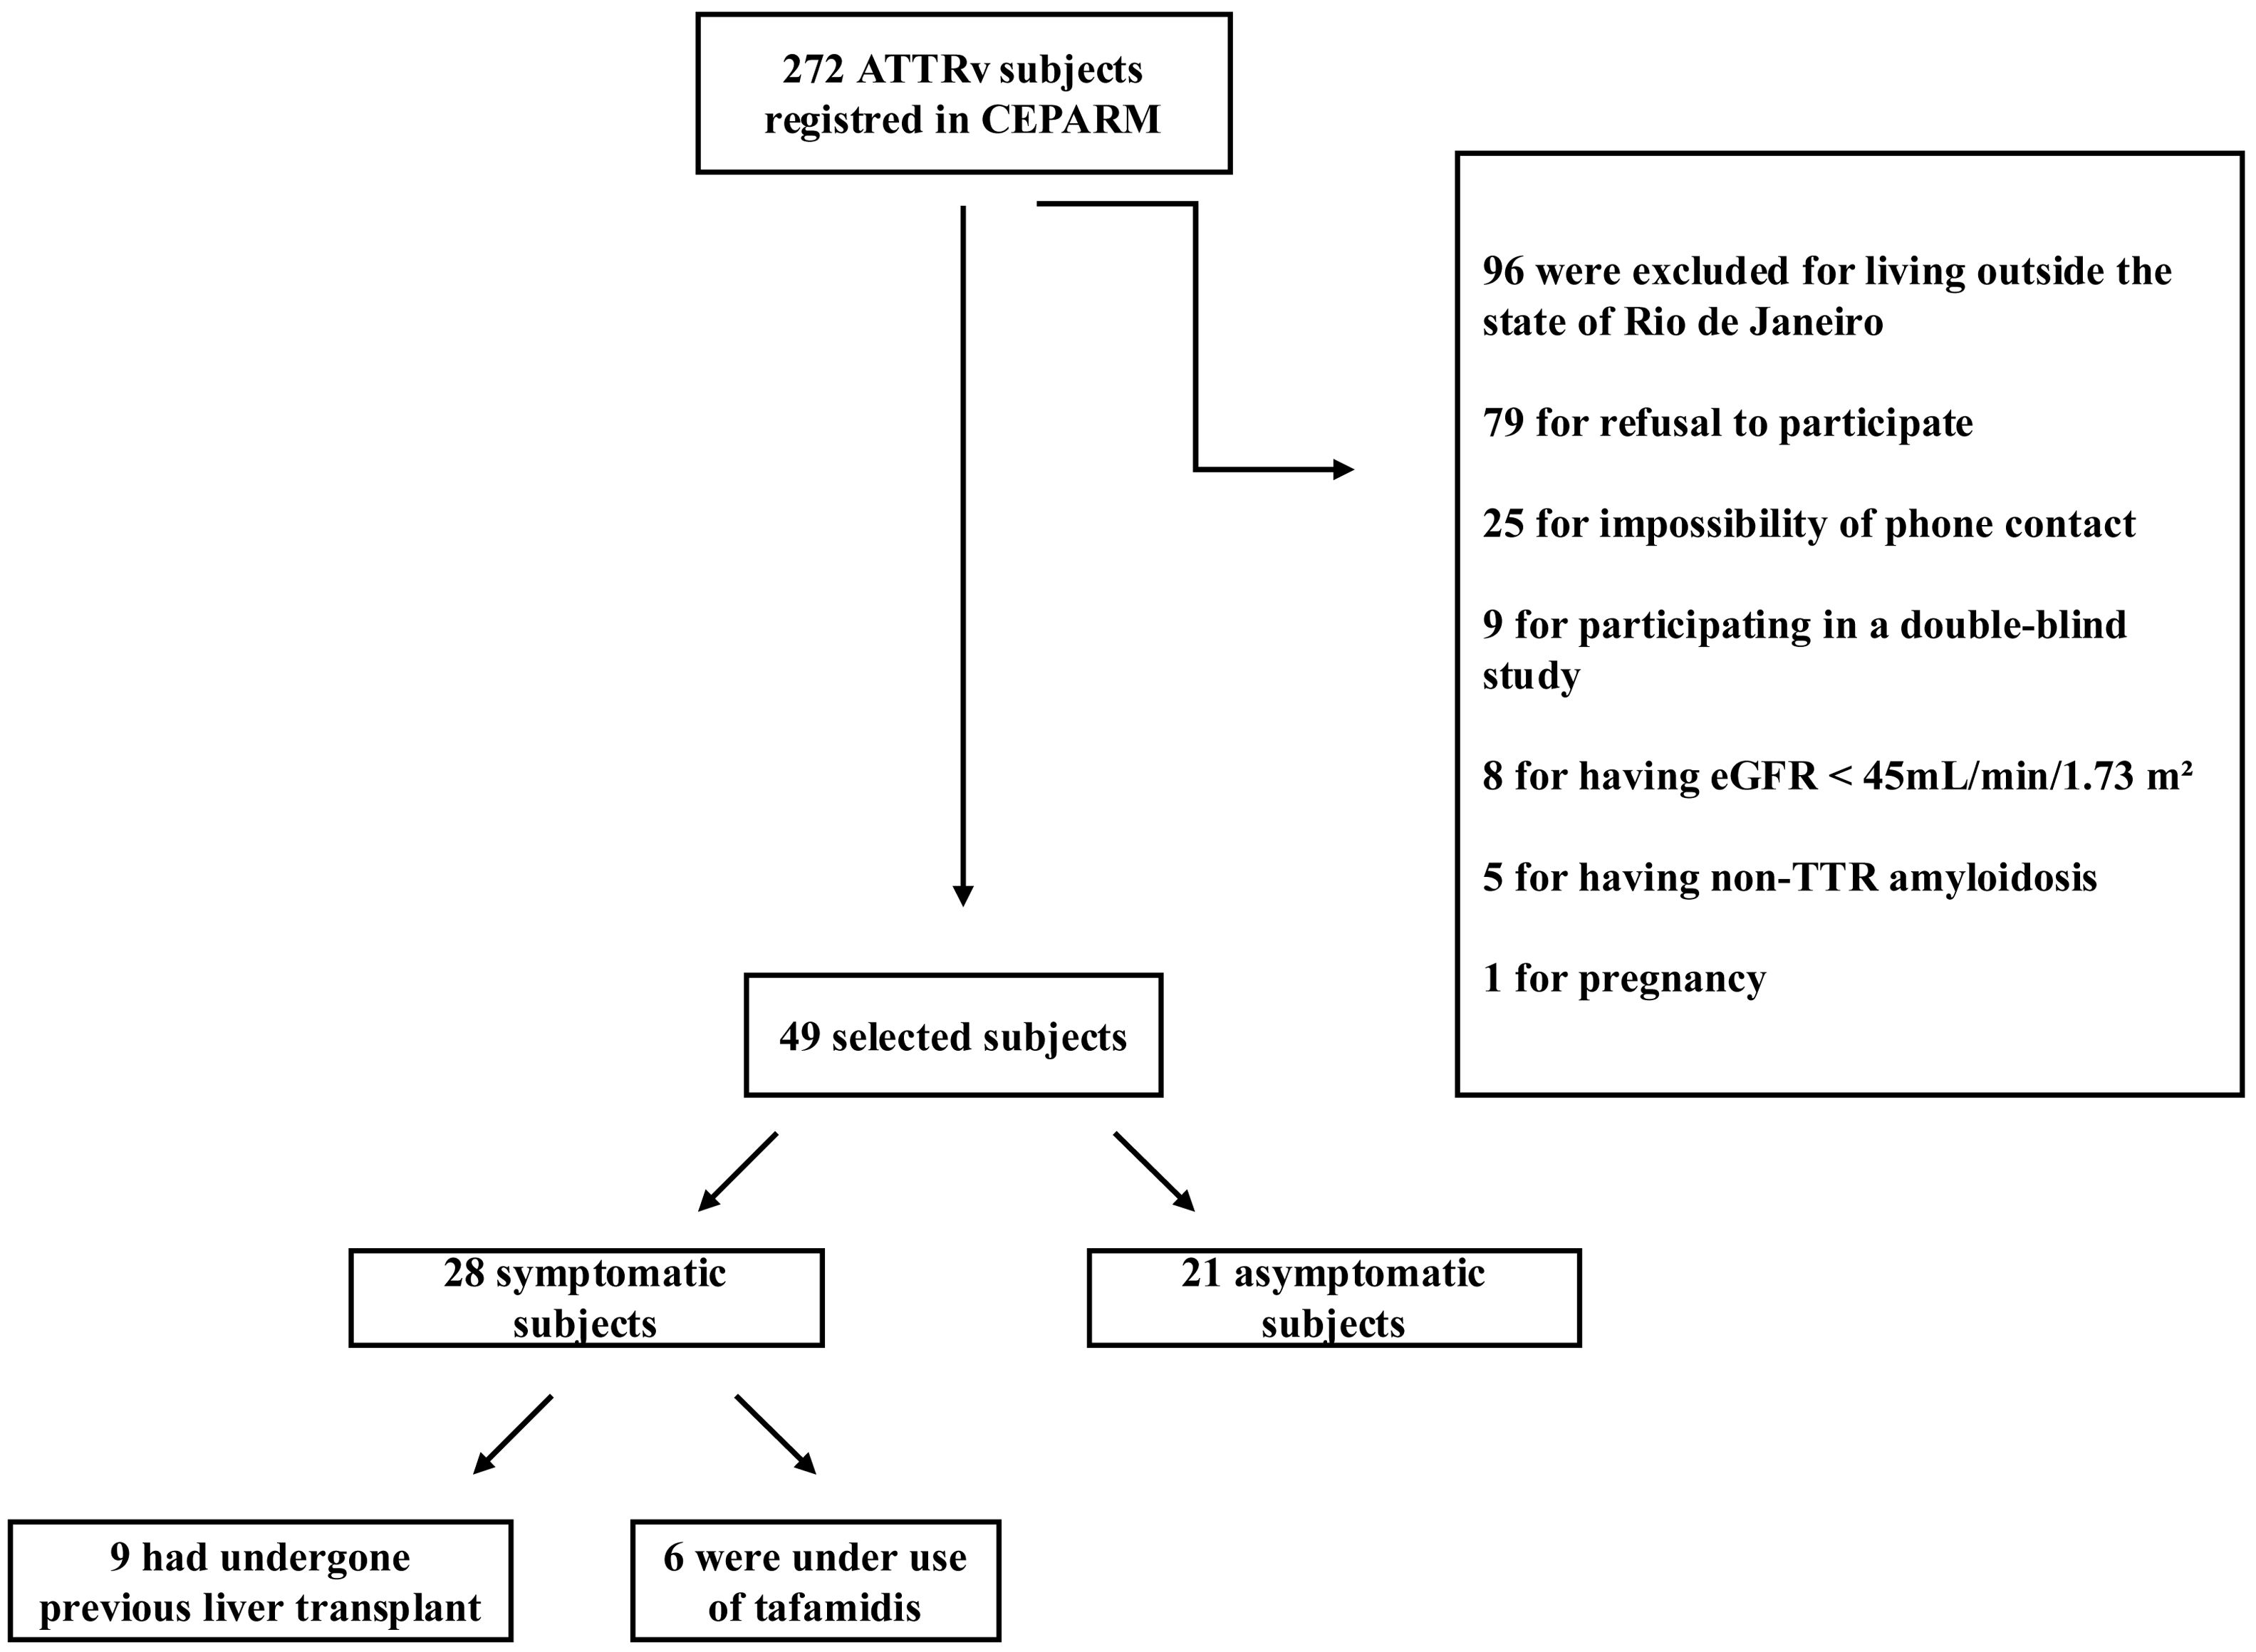
ResultsAt the time of recruitment, 272 ATTRv subjects were registered in the study center's database. From this total, 49 individuals met the inclusion criteria and were selected. The most common reasons for exclusion were residence outside Rio de Janeiro (n=96) and refusal to participate (n=79). Additional exclusion criteria are detailed in the flowchart (Fig. 1).
The final cohort had a median age of 40 years (IQR 35.5–56.5), with a predominance of females (63%) and Caucasians (84%). The V50M variant was present in 94% of participants. The median time from symptom onset to diagnosis was 3 years. According to predefined clinical criteria, 57% of participants were symptomatic. Among symptomatic individuals, nine had undergone liver transplantation, and six were receiving tafamidis, a TTR stabilizer. Other comorbidities were infrequent in the study population. Only two patients had heart failure, and five patients were taking diuretics. No patients were taking nonsteroidal anti-inflammatory drugs or renin–angiotensin–aldosterone system inhibitors.
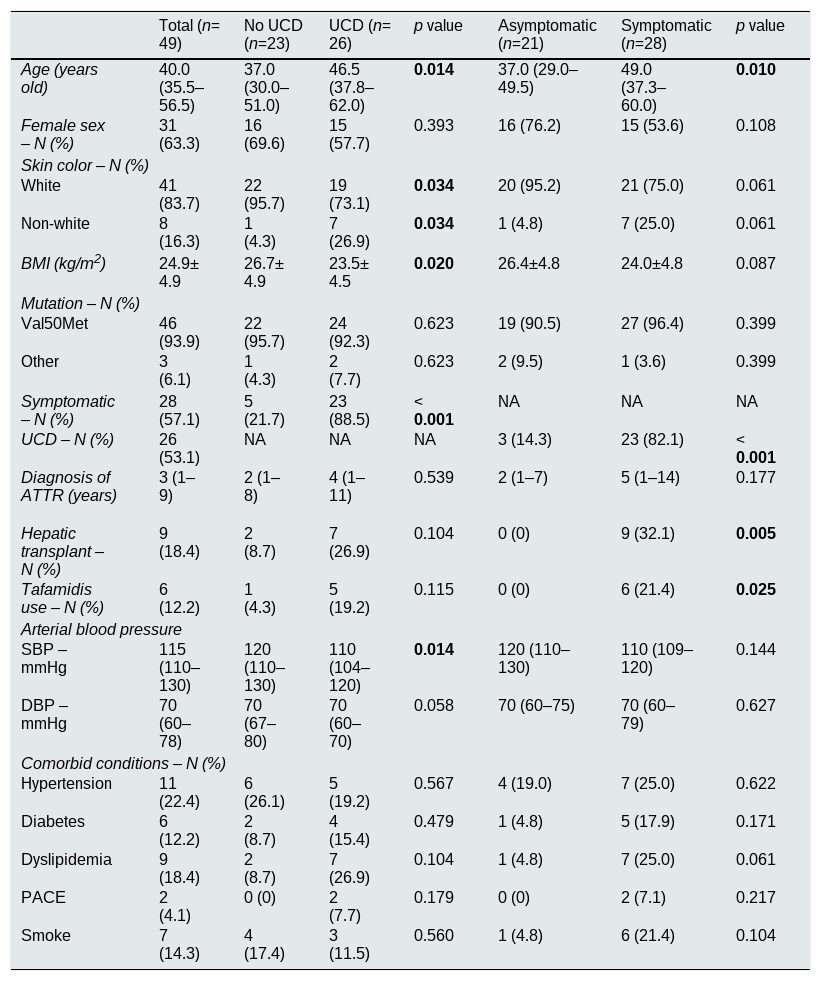
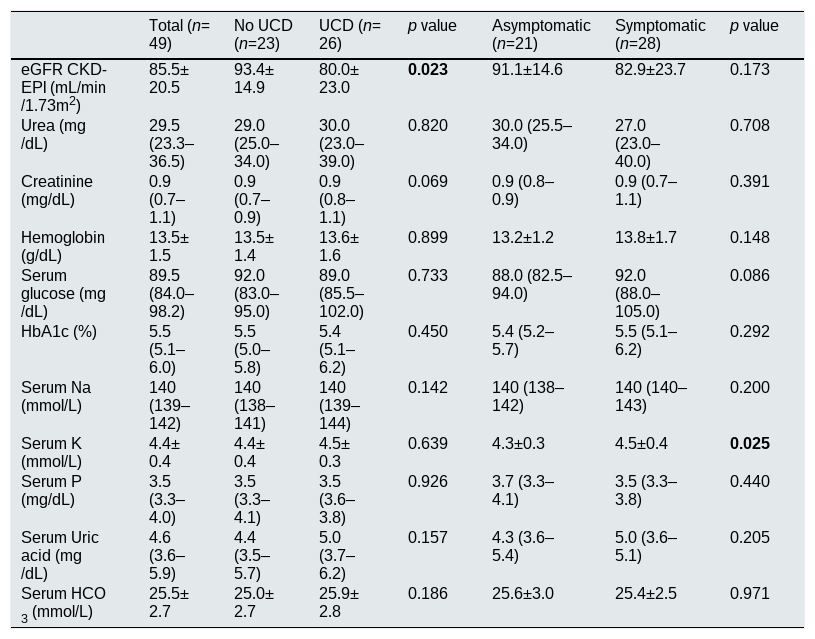
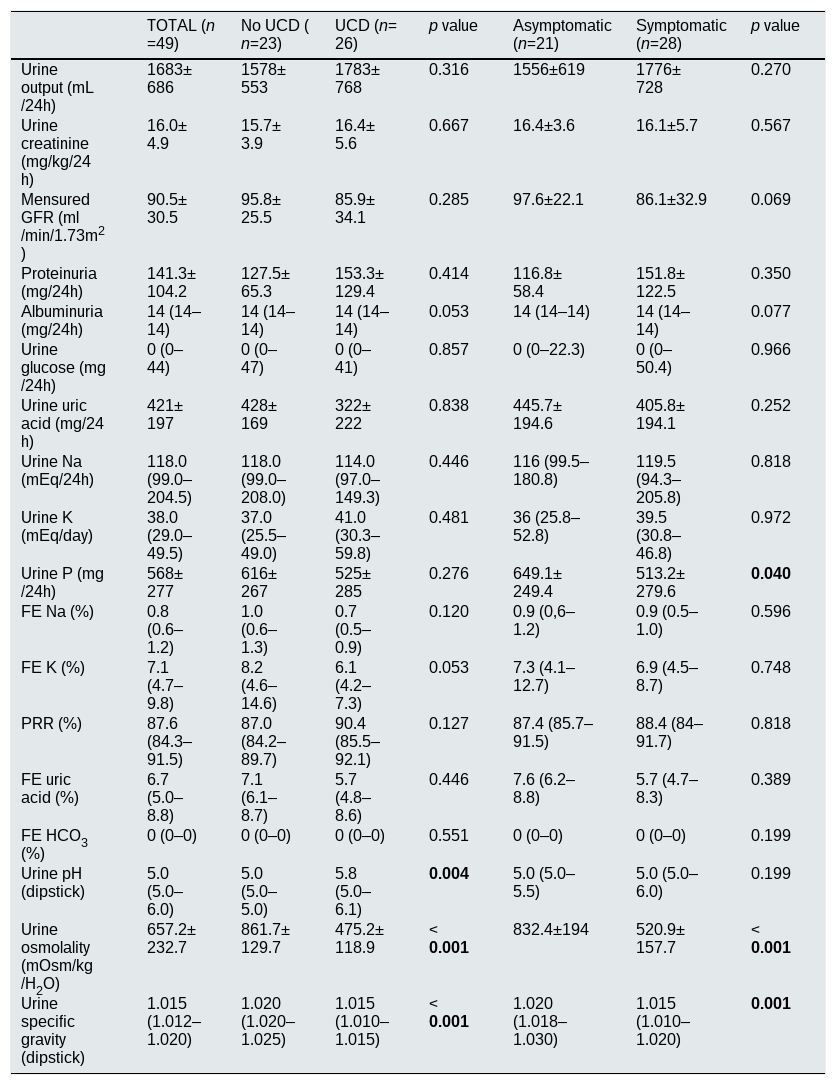
Both estimated GFR by CKD-EPI and 24-h proteinuria were within normal limits in the overall sample. Nonetheless, 6 participants (12%) had an estimated GFR<60mL/min/1.73m2, 16 (33%) had proteinuria, and 4 (8%) had albuminuria. Glycosuria was negligible, and PRR was within normal range. Elevated uβ2M levels were detected in 2 participants (4%). Mean uOSM was 657.2±232.7mOsm/kg H2O, and median uSG was 1.015 (IQR 1.012–1.020). UCD was identified in 53% of participants. Demographic and clinical data for the entire cohort are presented in (Table 1). Biochemical parameters in serum and urine are detailed in Tables 2 and 3.
Epidemiological and clinical features.
| Total (n=49) | No UCD (n=23) | UCD (n=26) | p value | Asymptomatic (n=21) | Symptomatic (n=28) | p value | |
|---|---|---|---|---|---|---|---|
| Age (years old) | 40.0 (35.5–56.5) | 37.0 (30.0–51.0) | 46.5 (37.8–62.0) | 0.014 | 37.0 (29.0–49.5) | 49.0 (37.3–60.0) | 0.010 |
| Female sex – N (%) | 31 (63.3) | 16 (69.6) | 15 (57.7) | 0.393 | 16 (76.2) | 15 (53.6) | 0.108 |
| Skin color – N (%) | |||||||
| White | 41 (83.7) | 22 (95.7) | 19 (73.1) | 0.034 | 20 (95.2) | 21 (75.0) | 0.061 |
| Non-white | 8 (16.3) | 1 (4.3) | 7 (26.9) | 0.034 | 1 (4.8) | 7 (25.0) | 0.061 |
| BMI (kg/m2) | 24.9±4.9 | 26.7±4.9 | 23.5±4.5 | 0.020 | 26.4±4.8 | 24.0±4.8 | 0.087 |
| Mutation – N (%) | |||||||
| Val50Met | 46 (93.9) | 22 (95.7) | 24 (92.3) | 0.623 | 19 (90.5) | 27 (96.4) | 0.399 |
| Other | 3 (6.1) | 1 (4.3) | 2 (7.7) | 0.623 | 2 (9.5) | 1 (3.6) | 0.399 |
| Symptomatic – N (%) | 28 (57.1) | 5 (21.7) | 23 (88.5) | <0.001 | NA | NA | NA |
| UCD – N (%) | 26 (53.1) | NA | NA | NA | 3 (14.3) | 23 (82.1) | <0.001 |
| Diagnosis of ATTR (years) | 3 (1–9) | 2 (1–8) | 4 (1–11) | 0.539 | 2 (1–7) | 5 (1–14) | 0.177 |
| Hepatic transplant – N (%) | 9 (18.4) | 2 (8.7) | 7 (26.9) | 0.104 | 0 (0) | 9 (32.1) | 0.005 |
| Tafamidis use – N (%) | 6 (12.2) | 1 (4.3) | 5 (19.2) | 0.115 | 0 (0) | 6 (21.4) | 0.025 |
| Arterial blood pressure | |||||||
| SBP – mmHg | 115 (110–130) | 120 (110–130) | 110 (104–120) | 0.014 | 120 (110–130) | 110 (109–120) | 0.144 |
| DBP – mmHg | 70 (60–78) | 70(67–80) | 70(60–70) | 0.058 | 70 (60–75) | 70 (60–79) | 0.627 |
| Comorbid conditions – N (%) | |||||||
| Hypertension | 11 (22.4) | 6 (26.1) | 5 (19.2) | 0.567 | 4 (19.0) | 7 (25.0) | 0.622 |
| Diabetes | 6 (12.2) | 2 (8.7) | 4 (15.4) | 0.479 | 1 (4.8) | 5 (17.9) | 0.171 |
| Dyslipidemia | 9 (18.4) | 2 (8.7) | 7 (26.9) | 0.104 | 1 (4.8) | 7 (25.0) | 0.061 |
| PACE | 2 (4.1) | 0 (0) | 2 (7.7) | 0.179 | 0 (0) | 2 (7.1) | 0.217 |
| Smoke | 7 (14.3) | 4 (17.4) | 3 (11.5) | 0.560 | 1 (4.8) | 6 (21.4) | 0.104 |
Mean ± SD or median [interquartile range], proportions where appropriate. BMI: body mass index, UCD: urinary concentration disorder, SBP: systolic blood pressure, DBP: diastolic blood pressure.
Serum biochemical parameters.
| Total (n=49) | No UCD (n=23) | UCD (n=26) | p value | Asymptomatic (n=21) | Symptomatic (n=28) | p value | |
|---|---|---|---|---|---|---|---|
| eGFR CKD-EPI (mL/min/1.73m2) | 85.5±20.5 | 93.4±14.9 | 80.0±23.0 | 0.023 | 91.1±14.6 | 82.9±23.7 | 0.173 |
| Urea (mg/dL) | 29.5 (23.3–36.5) | 29.0 (25.0–34.0) | 30.0 (23.0–39.0) | 0.820 | 30.0 (25.5–34.0) | 27.0 (23.0–40.0) | 0.708 |
| Creatinine (mg/dL) | 0.9 (0.7–1.1) | 0.9 (0.7–0.9) | 0.9 (0.8–1.1) | 0.069 | 0.9 (0.8–0.9) | 0.9 (0.7–1.1) | 0.391 |
| Hemoglobin (g/dL) | 13.5±1.5 | 13.5±1.4 | 13.6±1.6 | 0.899 | 13.2±1.2 | 13.8±1.7 | 0.148 |
| Serum glucose (mg/dL) | 89.5 (84.0–98.2) | 92.0 (83.0–95.0) | 89.0 (85.5–102.0) | 0.733 | 88.0 (82.5–94.0) | 92.0 (88.0–105.0) | 0.086 |
| HbA1c (%) | 5.5 (5.1–6.0) | 5.5 (5.0–5.8) | 5.4 (5.1–6.2) | 0.450 | 5.4 (5.2–5.7) | 5.5 (5.1–6.2) | 0.292 |
| Serum Na (mmol/L) | 140 (139–142) | 140 (138–141) | 140 (139–144) | 0.142 | 140 (138–142) | 140 (140–143) | 0.200 |
| Serum K (mmol/L) | 4.4±0.4 | 4.4±0.4 | 4.5±0.3 | 0.639 | 4.3±0.3 | 4.5±0.4 | 0.025 |
| Serum P (mg/dL) | 3.5 (3.3–4.0) | 3.5 (3.3–4.1) | 3.5 (3.6–3.8) | 0.926 | 3.7 (3.3–4.1) | 3.5 (3.3–3.8) | 0.440 |
| Serum Uric acid (mg/dL) | 4.6 (3.6–5.9) | 4.4 (3.5–5.7) | 5.0 (3.7–6.2) | 0.157 | 4.3 (3.6–5.4) | 5.0 (3.6–5.1) | 0.205 |
| Serum HCO3 (mmol/L) | 25.5±2.7 | 25.0±2.7 | 25.9±2.8 | 0.186 | 25.6±3.0 | 25.4±2.5 | 0.971 |
Mean ± SD or median [interquartile range], proportions where appropriate. eGFR CKD-EPI: estimated glomerular filtration rate (CKD-EPI equation), HbA1C: glycated hemoglobin, HCO3: bicarbonate.
Urine biochemical parameters.
| TOTAL (n=49) | No UCD (n=23) | UCD (n=26) | p value | Asymptomatic (n=21) | Symptomatic (n=28) | p value | |
|---|---|---|---|---|---|---|---|
| Urine output (mL/24h) | 1683±686 | 1578±553 | 1783±768 | 0.316 | 1556±619 | 1776±728 | 0.270 |
| Urine creatinine (mg/kg/24h) | 16.0±4.9 | 15.7±3.9 | 16.4±5.6 | 0.667 | 16.4±3.6 | 16.1±5.7 | 0.567 |
| Mensured GFR (ml/min/1.73m2) | 90.5±30.5 | 95.8±25.5 | 85.9±34.1 | 0.285 | 97.6±22.1 | 86.1±32.9 | 0.069 |
| Proteinuria (mg/24h) | 141.3±104.2 | 127.5±65.3 | 153.3±129.4 | 0.414 | 116.8±58.4 | 151.8±122.5 | 0.350 |
| Albuminuria (mg/24h) | 14 (14–14) | 14 (14–14) | 14 (14–14) | 0.053 | 14 (14–14) | 14 (14–14) | 0.077 |
| Urine glucose (mg/24h) | 0 (0–44) | 0 (0–47) | 0 (0–41) | 0.857 | 0 (0–22.3) | 0 (0–50.4) | 0.966 |
| Urine uric acid (mg/24h) | 421±197 | 428±169 | 322±222 | 0.838 | 445.7±194.6 | 405.8±194.1 | 0.252 |
| Urine Na (mEq/24h) | 118.0 (99.0–204.5) | 118.0 (99.0–208.0) | 114.0 (97.0–149.3) | 0.446 | 116 (99.5–180.8) | 119.5 (94.3–205.8) | 0.818 |
| Urine K (mEq/day) | 38.0 (29.0–49.5) | 37.0 (25.5–49.0) | 41.0 (30.3–59.8) | 0.481 | 36 (25.8–52.8) | 39.5 (30.8–46.8) | 0.972 |
| Urine P (mg/24h) | 568±277 | 616±267 | 525±285 | 0.276 | 649.1±249.4 | 513.2±279.6 | 0.040 |
| FE Na (%) | 0.8 (0.6–1.2) | 1.0 (0.6–1.3) | 0.7 (0.5–0.9) | 0.120 | 0.9 (0,6–1.2) | 0.9 (0.5–1.0) | 0.596 |
| FE K (%) | 7.1 (4.7–9.8) | 8.2 (4.6–14.6) | 6.1 (4.2–7.3) | 0.053 | 7.3 (4.1–12.7) | 6.9 (4.5–8.7) | 0.748 |
| PRR (%) | 87.6 (84.3–91.5) | 87.0 (84.2–89.7) | 90.4 (85.5–92.1) | 0.127 | 87.4 (85.7–91.5) | 88.4 (84–91.7) | 0.818 |
| FE uric acid (%) | 6.7 (5.0–8.8) | 7.1 (6.1–8.7) | 5.7 (4.8–8.6) | 0.446 | 7.6 (6.2–8.8) | 5.7 (4.7–8.3) | 0.389 |
| FE HCO3 (%) | 0 (0–0) | 0 (0–0) | 0 (0–0) | 0.551 | 0 (0–0) | 0 (0–0) | 0.199 |
| Urine pH (dipstick) | 5.0 (5.0–6.0) | 5.0 (5.0–5.0) | 5.8 (5.0–6.1) | 0.004 | 5.0 (5.0–5.5) | 5.0 (5.0–6.0) | 0.199 |
| Urine osmolality (mOsm/kg/H2O) | 657.2±232.7 | 861.7±129.7 | 475.2±118.9 | <0.001 | 832.4±194 | 520.9±157.7 | <0.001 |
| Urine specific gravity (dipstick) | 1.015 (1.012–1.020) | 1.020 (1.020–1.025) | 1.015 (1.010–1.015) | <0.001 | 1.020 (1.018–1.030) | 1.015 (1.010–1.020) | 0.001 |
Mean ± SD or median [interquartile range], proportions where appropriate. GFR: glomerular filtration rate, FE: fractional excretion, PRR: phosphate reabsorption rate, HCO3: bicarbonate, urine ϒGT activity: urine gamma-glutamyl transferase activity.
The symptomatic subgroup (n=28) was older (49.0 years [IQR 37.3–60.0] vs. 37.0 years [IQR 29.0–49.5], p=0.010) and had a significantly higher UCD prevalence (82% vs. 14%, p<0.001) than asymptomatic subjects. They also exhibited lower urine osmolality (520.9±157.7 vs. 832.4±194mOsm/kg H2O, p<0.001) and uSG (1.015 [IQR 1.010–1.020] vs. 1.020 [IQR 1.018–1.030], p=0.001). Comparative demographic and clinical characteristics of these subgroups are detailed in Table 1. Serum and urine test results for each subgroup are presented in Tables 2 and 3, respectively.
Compared to the non-UCD subgroup, individuals with UCD (n=26) were older (46.5 years [IQR 37.8–62.0] vs. 37.0 [IQR 30.0–51.0], p=0.014), had a higher proportion of non-Caucasians (27% vs. 4%, p=0.034), and more frequently exhibited symptoms (89% vs. 22%, p<0.001). The UCD group also had lower BMI, lower systolic blood pressure, reduced estimated GFR, and higher urinary pH (5.8 [IQR 5.0–6.1] vs. 5.0 [IQR 5.0–5.0], p=0.004), as measured by dipstick. We performed multivariate logistic regression with urinary concentration disorder as the dichotomous dependent variable and clinical parameters (gender, BMI, systolic and diastolic blood pressure, comorbidities, diuretic use) and laboratory parameters (Hb, eGFR, bicarbonate) as independent variables. None of these variables had a statistically significant impact on urinary concentration capacity. Demographic and clinical comparisons between UCD and non-UCD subgroups are summarized in Table 1. Relevant laboratory data from serum and urine for both groups are listed in Tables 2 and 3.
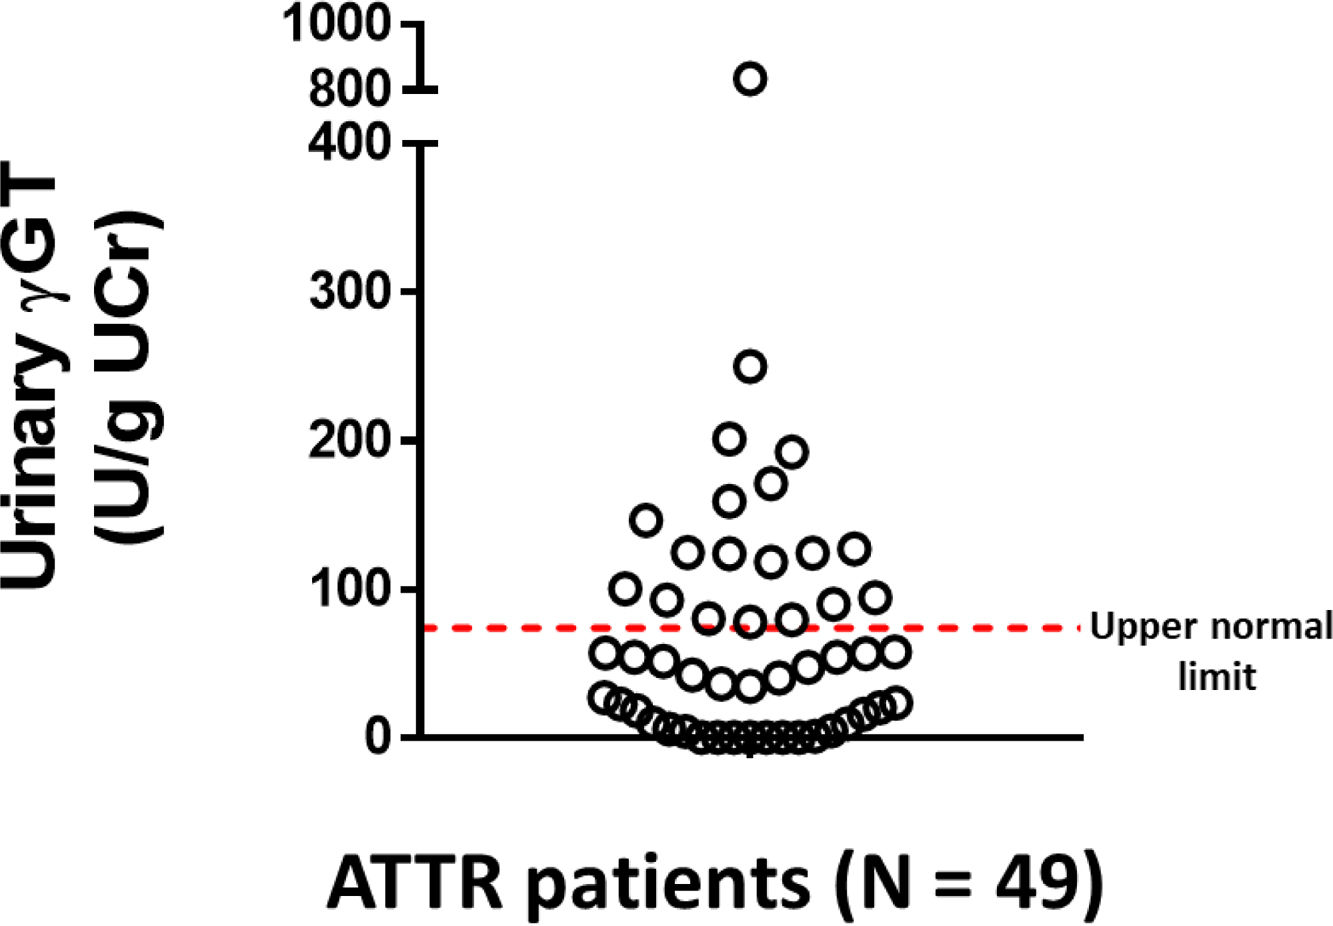
There were no significant differences in uϒGT levels between symptomatic and asymptomatic participants, or between those with and without UCD (Table 3). Nonetheless, 35% of all participants exhibited uϒGT values exceeding the reference range (Fig. 2).
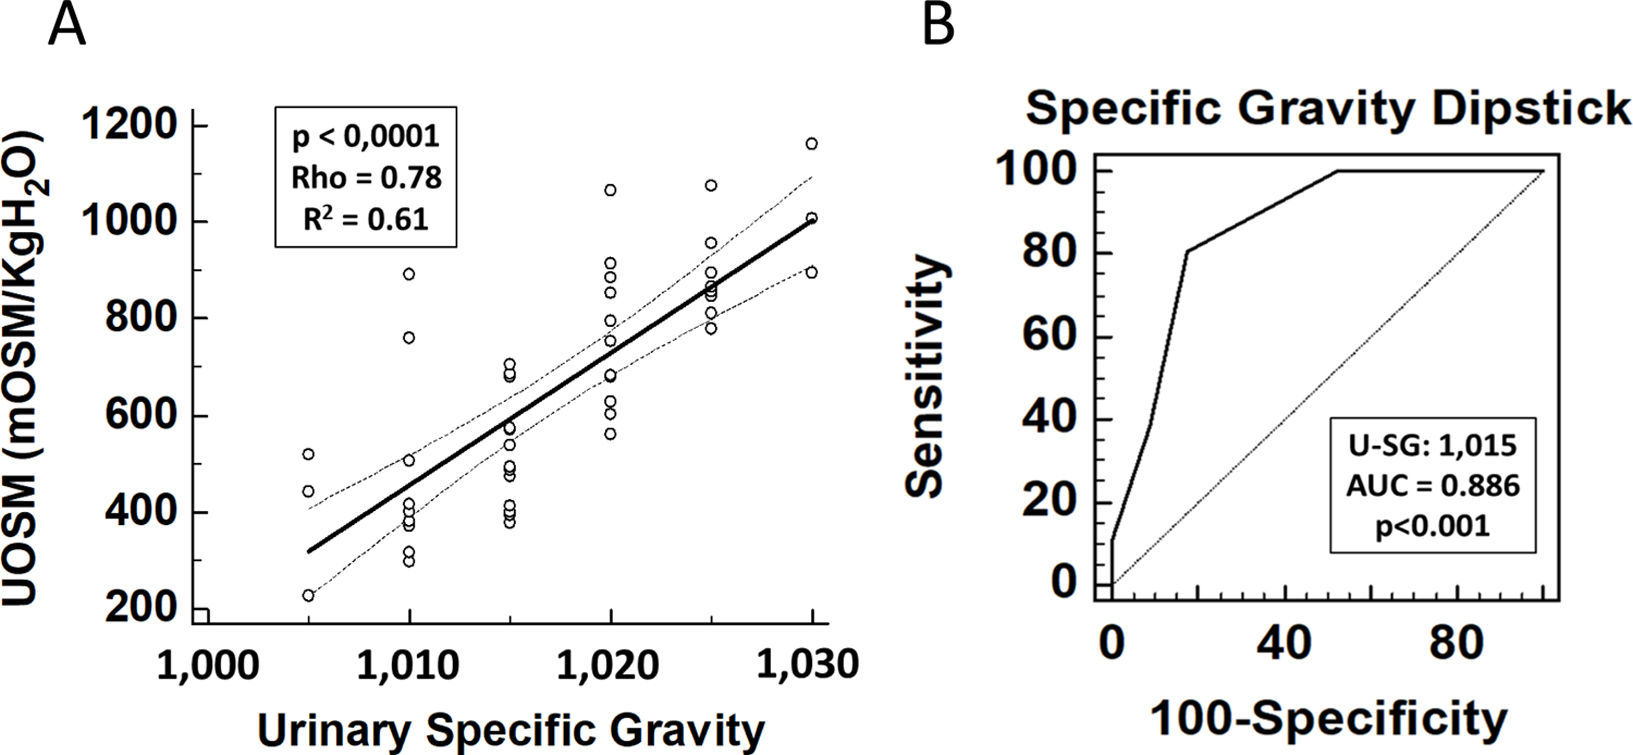
A strong correlation was observed between dipstick uSG and uOSM (Spearman's ρ=0.78, p<0.001), as illustrated by the regression line in Fig. 3A. ROC curve analysis indicated that a uSG>1.015 was the optimal threshold for excluding UCD, with an area under the curve (AUC) of 0.89 (Fig. 3B).
(A) Correlation between urinary specific gravity measured by dipstick (uSG) and urine osmolality measured by osmometry (uOSM). The solid line represents the fitted regression line. A strong positive correlation was observed (Spearman's ρ=0.78, p<0.001). (B) Receiver operating characteristic (ROC) curve evaluating the diagnostic performance of urinary specific gravity measured by dipstick (uSG) to exclude urinary concentrating defect. (UCD). A uSG threshold of >1.015 was identified as the optimal cutoff, with an area under the curve (AUC) of 0.89.
ATTRv is a rare multisystem disorder, and most available renal data derive from case series in endemic regions.2 Our cohort was predominantly composed of V50M carriers with predominantly neurological and/or cardiac manifestations, consistent with the typical phenotype observed in these settings.18
Glomerular function was largely preserved, with only 12% of participants presenting an estimated GFR<60mL/min/1.73m2 despite inclusion criteria requiring an estimated GFR>45mL/min/1.73m2. These findings are consistent with the broader experience at our center and suggest relatively limited glomerular involvement in this cohort, although they differ from reports from other referral centers, which describe more advanced renal impairment.19
Mild proteinuria was observed in 33% of participants, while albuminuria was detected in only 8%. Most individuals did not exhibit significant protein excretion, in contrast to some longitudinal cohorts reporting progressive albuminuria and CKD.20
Although amyloid deposition may involve multiple renal compartments, its impact on tubulointerstitial function in ATTRv remains insufficiently characterized.3 Our group has previously demonstrated impaired urinary acidification in this population21; however, data regarding proximal tubular function and urinary concentrating capacity remain limited.
In our cohort, conventional markers of proximal tubular function (glycosuria, FE of uric acid, PRR) were within normal limits, and elevated uβ2M was uncommon (4%). In contrast, uϒGT activity was increased in approximately 35% of participants. However, this elevation was not associated with UCD or with other renal parameters.
uϒGT has been described as a marker of proximal tubular injury in various clinical settings.7,22 In our study, however, the absence of consistent associations limits its interpretability in the context of ATTRv. Therefore, although elevated in a subset of patients, uϒGT should be regarded as an exploratory and hypothesis-generating finding rather than evidence of established proximal tubular injury in this population.
As no specific clinical biomarker is available to assess structural injury of the distal nephron, we evaluated urinary concentrating capacity as a functional marker of distal nephron performance following WDT. A high prevalence of urinary concentrating defect (53%) was observed in our cohort.
Although the clinical implications of UCD were not directly assessed, impaired urinary concentrating capacity may represent an early indicator of renal involvement in ATTRv.
The strong correlation between osmometry and dipstick-based specific gravity supports the potential use of dipstick-based specific gravity as a practical screening tool in settings where osmometry is unavailable. ROC curve analysis identified a dipstick uSG>1.015 as the optimal cutoff to exclude UCD, corresponding approximately to a uOSM of 680mOsm/kgH2O.
Symptomatic individuals were older and exhibited a significantly higher prevalence of UCD (82% vs. 14%), with lower uOSM and uSG values. In contrast to some longitudinal cohorts reporting higher rates of albuminuria among symptomatic patients,20 we observed no significant differences in urinary albumin excretion between symptomatic and asymptomatic participants.
Participants in the UCD subgroup were older, more frequently symptomatic, and had lower blood pressure levels. They also exhibited higher urinary pH values, which may reflect altered distal nephron acidification, consistent with our previous findings of incomplete distal renal tubular acidosis in ATTRv.21
We assessed uϒGT activity across subgroups (asymptomatic vs. symptomatic and UCD vs. non-UCD). Although elevated in approximately 35% of participants, uϒGT did not differ significantly between subgroups and was not associated with UCD or other renal parameters.
The absence of subgroup differences further limits the interpretability of this finding in ATTRv. Histopathological studies suggest that amyloid deposition may preferentially involve medullary and distal nephron structures,23,24 which could partially explain the lack of consistent proximal tubular biomarker alterations; however, this interpretation remains speculative.
This study has several limitations. Its cross-sectional design and relatively small sample size from a single-center cohort limit causal inference. However, ATTRv is a rare disease, and the high prevalence of the V50M variant (94%) supports the cohort's representativeness relative to ATTRv populations in Brazil and Portugal. Additionally, a substantial number of potentially eligible individuals were not included, mainly due to geographic constraints or refusal to participate. Although this reflects the logistical challenges inherent to studying a rare disease in a large country, selection bias cannot be ruled out, and the findings’ generalizability should be interpreted with caution.
Another limitation is the absence of a disease control group, which precludes determining whether the observed impairment in urinary concentrating capacity is specific to ATTRv or shared with other clinical conditions. Importantly, only two participants had overt heart failure, and the predominant phenotype was neurological, consistent with the V50M variant. Thus, advanced cardiac dysfunction is unlikely to be the sole driver of the observed findings. Nevertheless, the study was not designed to establish etiological specificity, and comparative studies will be necessary to clarify this issue.
Finally, the potential residual impact of concomitant medications, particularly diuretics, on urinary concentrating capacity must be acknowledged. Although these agents were discontinued before testing and used by only a minority of participants, their influence on the observed results cannot be completely ruled out. We also did not perform aminoaciduria testing to further evaluate proximal tubular abnormalities.
To our knowledge, this is the first study to systematically evaluate urinary concentrating capacity in patients with ATTRv. We identified a high prevalence of subclinical functional renal involvement, predominantly affecting distal nephron performance. These findings are exploratory and require longitudinal validation; however, they highlight the potential value of simple and accessible tools, such as dipstick-based specific gravity, for early renal assessment in ATTRv. These findings may contribute to earlier recognition of renal involvement in ATTRv, supporting comprehensive clinical monitoring in affected individuals.
Authors’ contributionAll authors have reviewed and approved the final version of this manuscript.
Declarations of generative AI and AI-assisted technologies in the writing processDuring the preparation of this work, the authors used ChatGPT-4 to improve the language. After using this tool, the authors reviewed and edited the content as needed and assumed full responsibility for the publication.
FundingThis research received no external funding.
Conflicts of interestThe authors declare that they have no conflicts of interest related to this manuscript.