Kt/V has been used as a synonym for hemodialysis dose. Patient survival improved with a Kt/V>1; this target was subsequently increased to 1.2 and 1.3. The HEMO study revealed no significant relationship between Kt/V and mortality. The relationship between Kt/V and mortality often shows a J-shaped curve. Is V the confounding factor in this relationship? The objective of this study is to determine the relationship between mortality and Kt/V, Kt and body water content (V) and lean mass (bioimpedance).
MethodsWe studied a cohort of 127 prevalent hemodialysis patients, who we followed-up for an average of 36 months. Kt was determined by ionic dialysance, and V and nutrition parameters by bioimpedance. Kt/V, Kt corrected for body surface area (Kt/BSA) and target Kt/BSA were calculated. The mean data from 18,998 sessions were used as hemodialysis parameters, with a mean of 155 sessions per patient.
ResultsMean age was 70.4±15.3 years and 61% were male; 76 were dialyzed via an arteriovenous fistula and 65 were on online hemodiafiltration. Weight was 70.6 (16.8)kg; BSA 1.8 (0.25)m2; total body water (V) 32.2 (7.41)l and lean mass index (LMI) 11.1 (2.7)kg/m2. Mean Kt/V was 1.84 (0.44); Kt 56.1(7)l and Kt/BSA 52.8 (10.4)l. The mean target Kt/BSA was 49.7 (4.5)l. Mean Kt/BSA−target Kt/BSA+6.4 (7.0)l. Patients with a higher Kt/V had worse survival rates than others; with Kt this is not the case. Higher Kt/V values are due to a lower V, with poorer nutrition parameters. LMI and serum albumin were the parameters that best independently predicted the risk of death and are lower in patients with a higher Kt/V and lower V.
ConclusionKt/V is not useful for determining dialysis doses in patients with low or reduced body water. Kt or the Kt/BSA are proposed as an alternative.
El Kt/V se ha usado como sinónimo de dosis de hemodiálisis. La supervivencia de los pacientes mejoraba con un Kt/V>1; este objetivo posteriormente fue elevado a 1,2 y a 1,3. En el estudio HEMO no se demostró una relación significativa entre Kt/V y la mortalidad. La relación Kt/V y mortalidad con frecuencia es una curva en «J». ¿Es la V el factor de confusión de esa relación? El objetivo de este estudio es buscar la relación de la mortalidad con el Kt/V, Kt y con el contenido de agua corporal (V) y masa magra (bioimpedancia).
MétodosSe ha estudiado una cohorte de 127 pacientes prevalentes en hemodiálisis seguidos durante una media de 36 meses. Se determinó el Kt por dialisancia iónica y la V y parámetros de nutrición mediante bioimpedancia. Se ha calculado el Kt/V y el Kt alcanzado corregido para superficie corporal (Ktsc) y el Ktsc objetivo. Como parámetros de hemodiálisis se ha utilizado la media de los datos de 18.998 sesiones, con una media de 155 sesiones por paciente.
ResultadosLa edad media fue 70,4 (15,3) años y un 61% eran hombres; 76 se dializaban mediante fístula arteriovenosa y 65 estaban en HDF-OL. Peso: 70,6(16,8)kg; superficie corporal: 1,8(0,25)m2; agua corporal total: 32,2(7,4)l; índice de masa magra (LTI): 11,1(2,7)kg/m2. El Kt/V medio fue 1,84(0,44); Kt: 56,1(7)l, y el Ktsc, 52,8(10,4)l. El Ktsc objetivo medio era de 49,7(4,5)l. La media del Ktsc–Ktsc objetivo: +6,4 (7,0)l. Los pacientes con un Kt/V mayor tienen peor supervivencia que el resto. Con el Kt no existe esta relación. Los Kt/V mayores se deben a una V menor, con peores parámetros de nutrición. La albúmina sérica y el LTI son los parámetros que se relacionan con el riesgo de muerte de forma independiente y son menores en los pacientes con mayor Kt/V y menor V.
ConclusiónEl Kt/V no es útil para determinar la dosis de diálisis en pacientes con un agua corporal pequeña o disminuida. Se propone el Kt o el Ktsc como alternativa.
The calculation of Kt/V is the most used method to determine the required dose of hemodialysis (HD). It is an index based on the amount of urea removed in one session (Kt) and in the volume of distribution of urea in the specific patient (V), which coincides with body water (BW). It is an index because it is expressed as the volume of blood depurated from urea, in liters, divided by the BW, in liters. The Kt/V can be estimated using formulas developed from the kinetic model of urea, using the measurement of the urea concentration before and after dialysis.1,2
The possibility of estimating the clearance of urea, K, by ionic dialysance (ID) or ultraviolet capture and multiplying this value by the duration of the session, t, and dividing it by the volume of BW calculated by anthropometric formulas or bioimpedance, has simplified the methodology,3–6 avoiding mistakes in the extraction of post-HD blood sample and allowing control of all sessions instead of one per month. The HD monitor display the value in real time without the need for analysis, with consequent saving of personnel time and cost. The correlation of values of Kt/V measured by urea and by ID is excellent (r=0.9) and the coefficients of variation are only in the range of 5–6%.4,5 The drawbacks are that it does not allow to calculate the protein catabolic rate (nPCR) and that depending on the type of HD monitor there may be variations of up to 10%.7,8
The Kt/V has been used as the dose of HD.9–11 Observational studies published the relationship between Kt/V and mortality and morbidity. The survival of the patients improved with a Kt/V>110–12; this objective was subsequently raised to 1.213 and 1.3.10 However in the HEMO study,14,15 a significant relationship between Kt/V and mortality was not detected. In this study,11 the benefit of a greater target of Kt/V was shown in women but not in men, which suggested that the idea of correcting or normalizing Kt by V was not adequate for all types of patients. There would be patients with certain characteristics in whom the Kt/V does not adequately determine the dose of dialysis needed.11
The relationship between Kt/V and mortality is often depicted as “J” curve; patients with a low Kt/V or low urea reduction ratio (URR) have an increased risk of death, but at the same time, patients with a Kt/V above the recommended level the risk of death is not decreased but increased.16–18 But the kidneys produce a continuous Kt and at a much higher amount, which contrasts with this result. These types of curves are usually explained by some confusion factor that is not corrected. In the case of Kt/V, the confounding factor could be V. A patient may have a high Kt/V due to a high Kt or a low V. Small patients and women have a low V and in them we already know that we have to provide a higher Kt/V. There are patients who have a low V because their water content is low, that is the case of, elderly people, malnourished, low muscle mass, reduced number of cells, all these patients usually have a poor prognosis. Is V the confusion factor? The studies that relate the Kt with the risk of death do not present a “J” curve; the risk of death continues to decrease as the Kt increases, above what is “recommended”.18–20
The objective of this study is to look for the relationship of Kt/V with Kt and V (total and corrected for weight) and the relationship of these parameters these with the total content of intra and extracellular water, and lean mass (bioimpedance). This study also investigates the relationship of these variables with mortality. The hypothesis is that Kt/V does not correlate directly with survival in patients with a small or diminished BW.
Material and methodsDesign and patientsCross-sectional, retrospective and unicentric study, which assesses the Kt/V, Kt, Kt adjusted to body surface (Ktsc), V and anthropometric parameters assessed by bioimpedance in a cohort of patients prevalent in HD in 2013 and 2014. Subsequently, patients were prospectively followed until the end of 2016. Mortality during follow-up has been studied in relation to the mentioned HD parameters. During the years 2013 and 2014 the data of all the HD sessions have been collected, data transferred from the HD monitors to the computer system.
Inclusion criteria: patients included are those prevalent in HD unit of the Infanta Leonor University Hospital during the years 2013 and 2014. These were all patients in chronic HD, older than 18 years and with consent for the use of their data. Exclusion criteria: patients with follow-up of less than 3 months or with less than 3 HD sessions per week due to significant residual renal function.
Hemodialysis techniqueMachines utilized were AK200us® and Artis® (Baxter) and ST5008 (Fresenius, FMC, Bad Homburg, Germany). All machines have ID (Diascan®u OCM®). The machines are connected to the TSS® computer application which allows automatic downloading of data in each session. The dialysis fluid is ultrapure, defined by levels of colony forming units ml of less than 0.1 and endotoxin levels of less than 0.03EU/ml (Guide from the Spanish Society of Nephrology). Patients are dialyzed 3 days a week and usually a minimum of 12h weekly, except for those with significant residual renal function (RRF). The dialyzers are of high permeability with synthetic membranes, with a surface area from 1.8 to 2.1m2. Patients with adverse reactions to these membranes are dialyzed with cellulose triacetate. The maximum blood flow that allows vascular access is used without allowing the arterial line pressure falling below −220mm Hg. Patients were on online hemodiafiltration or high flow HD.
Bioimpedance (BCM®)BCM® multifrequency bioimpedance21–23 was been used in the present study.
Parameters collected and evaluatedThe age and sex were collected. Vascular access for HD; pre and post-HD weight, and the body surface area (m2) was calculated.
At the initiation of the study, a pre-HD multifrequency bioimpedance (BCM®) was performed. The following parameters were collected: lean mass index (LTI) (kg/m2), fat mass index (FTI) (kg/m2), BW (liters), extracellular water (ECW, liters), intracellular water (ICW, liters)) and normohydrated weight (kg). The BCM® data is related to the data of corresponding HD session.
With respect to the HD, we recorded: dialysis technique, dialyzer, blood flow (Qb), total volume of purified blood (TVPB), effective time of dialysis (t), total conductivity in the dialysis fluid (Ct). The clearance of urea (K) was estimated by ID in each type of monitor. It was used as Vel BW by BCM® to determine the Kt/V. Natremia (Na) was calculated by ID in the first sensor measurement. The target Ktsc was calculated according to the formulas: Kt in liters=1/[0.0069+(0.0237/BSA)], with the BSA (body surface area) in m2=weight 0.425×height 0.725×0.007184 (post-HD weight in kg, height in centimeters).18,24
During the years 2013 and 2014 the data of Kt and Kt/V of all sessions were collected, with valid data, of all patients included in the study. The mean of Kt, Ktsc and Kt/V in each patient during that period was used for calculations.
EvolutionThe patients were followed until the end of 2016, assessing whether they were still active, had been transplanted, lost in follow-up or died.
StatisticsNormal continuous variables are expressed as mean and standard deviation. The variable Kt/V has been divided into quartiles. To compare the differences of the variables according to the quartiles of Kt/V, one-step analysis of variance was used after performing the Levene test. Pearson type bivariate correlations, have been applied, after checking that the variables had normal distribution.
The Kaplan–Meier survival curves were calculated and the factors were compared using the log rank test (Mantel–Cox). Cox regression was been used to elucidate the interaction between the factors and determine those that independently influence mortality.
A p<0.05 was considered significant. SPSS 15.0 (Chicago, Illinois, USA) has been used as a statistical package.
ResultsOf the 135 patients prevalent in the years 2013 and 2014 in the Hemodialysis Unit of the Infanta Leonor University Hospital, 127 met the inclusion criteria and were studied, and of them 18,998 sessions were registered.
The average age was 70.4 (15.3) years, ranging from 22 and 93 years. A 60.6% were men and 39.4% women. The patients were dialyzed through a tunneled catheter (n=51); by an autogenous arteriovenous fistula (n=68) and by a prosthetic fistula (n=8). Seventy-two patients were dialyzed with an AK 200us® or Artis® monitor and 55 with an ST 5008®. Sixty-five of the 127 patients were on online hemodiafiltration. The dialyzers used were: polyether sulfonade 2.1m2 in 74 patients; Fx800® in 24; polyamide 2.1m2 in 22, and Fx80® in 7.
The mean Kt of the 127 patients was 56.1 (7)l and the Ktsc was 52.8 (10.4)l. The average target Ktsc was 49.7 (4.5)l. The mean Ktsc−Ktsc target was+6.39 (7.00)l, range: −18.76 to 26.38l. Six patients, 5%, did not reach the recommended Ktsc. The average duration of HD sessions, t, was 248.9(21) [180–300]min. In this series women do not have an achieved Ktsc−target Ktsc lower than men, p=0.785. Patients with higher Ktsc had a lower proportion of catheters, p<0.033. The distribution of catheters was similar between the quartiles of Kt/V, p=0.468.
The mean of the maximal K was 243 (24)ml/min. The mean blood flow was 374 (43)ml/min; the total depurated blood volume was 83.4 (11.4) I; in pre-HD the SBP was 146 (24)mmHg and the DBP 69 (15)mmHg.
Anthropometric and bioimpedance data: weight, 70.6 (16.8)kg; body surface, 1.8 (0.25)m2; BW, 32.2 (7.4)l; extracellular volume, 17 (9.5)l; intracellular volume, 15.9 (4)l; relative lean mass, 42.6 (12.1)%; relative fat mass, 39.6 (9.6)%, LTI, 11.1 (2.7)kg/m2.
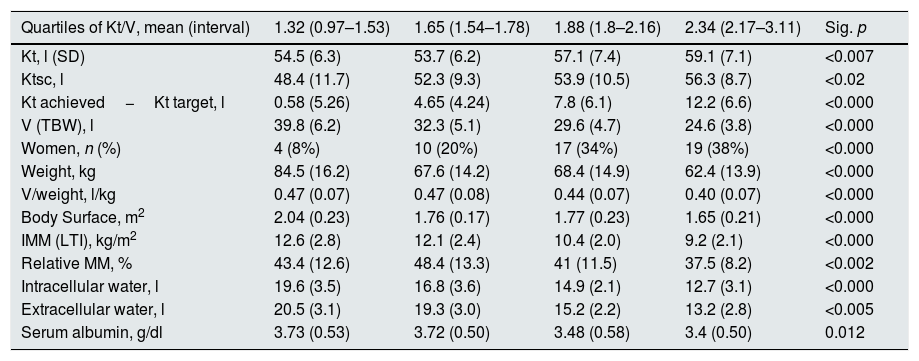
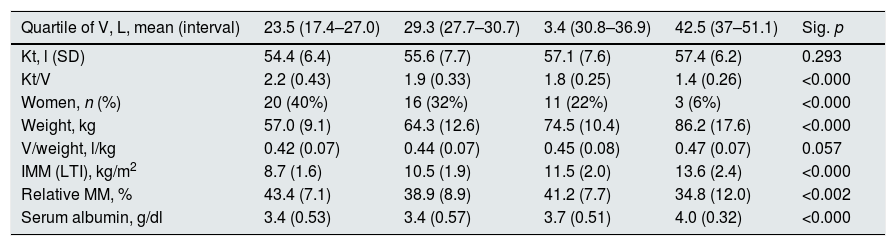
The mean Kt/V was 1.84 (0.44). Table 1 shows the data of Kt, Ktsc, Kt reached−target Kt, bioimpedance and dialysis according to the quartiles of Kt/V. The Kt/V of the upper quartiles are due to both a greater Kt and a lower V. Quartile 1, lower Kt/V, compared to the fourth quartile, implies 61% more of BW and 9% less of Kt. The factors that are inversely associated with the Kt/V are: lean mass index, % lean mass; BW; extracellular volume, and intracellular volume. Age at the start of follow-up inversely correlated with BW (p<0.05) and LTI (p<0.01). The serum albumin correlated with the LTI (n=127, r=0.64, p<0.001) and with the ACT (n=127, r=0.048, p<0.01). Table 2 describes the distribution of albumin and other bioimpedance values based on the BW quartiles (V).
Distribution of study variables in relation to quartiles of Kt/V.
| Quartiles of Kt/V, mean (interval) | 1.32 (0.97–1.53) | 1.65 (1.54–1.78) | 1.88 (1.8–2.16) | 2.34 (2.17–3.11) | Sig. p |
|---|---|---|---|---|---|
| Kt, l (SD) | 54.5 (6.3) | 53.7 (6.2) | 57.1 (7.4) | 59.1 (7.1) | <0.007 |
| Ktsc, l | 48.4 (11.7) | 52.3 (9.3) | 53.9 (10.5) | 56.3 (8.7) | <0.02 |
| Kt achieved−Kt target, l | 0.58 (5.26) | 4.65 (4.24) | 7.8 (6.1) | 12.2 (6.6) | <0.000 |
| V (TBW), l | 39.8 (6.2) | 32.3 (5.1) | 29.6 (4.7) | 24.6 (3.8) | <0.000 |
| Women, n (%) | 4 (8%) | 10 (20%) | 17 (34%) | 19 (38%) | <0.000 |
| Weight, kg | 84.5 (16.2) | 67.6 (14.2) | 68.4 (14.9) | 62.4 (13.9) | <0.000 |
| V/weight, l/kg | 0.47 (0.07) | 0.47 (0.08) | 0.44 (0.07) | 0.40 (0.07) | <0.000 |
| Body Surface, m2 | 2.04 (0.23) | 1.76 (0.17) | 1.77 (0.23) | 1.65 (0.21) | <0.000 |
| IMM (LTI), kg/m2 | 12.6 (2.8) | 12.1 (2.4) | 10.4 (2.0) | 9.2 (2.1) | <0.000 |
| Relative MM, % | 43.4 (12.6) | 48.4 (13.3) | 41 (11.5) | 37.5 (8.2) | <0.002 |
| Intracellular water, l | 19.6 (3.5) | 16.8 (3.6) | 14.9 (2.1) | 12.7 (3.1) | <0.000 |
| Extracellular water, l | 20.5 (3.1) | 19.3 (3.0) | 15.2 (2.2) | 13.2 (2.8) | <0.005 |
| Serum albumin, g/dl | 3.73 (0.53) | 3.72 (0.50) | 3.48 (0.58) | 3.4 (0.50) | 0.012 |
TBW: total body water; SD: standard deviation; IMM (LTI): lean mass index; Ktsc: Kt adjusted for body surface; MM: relative lean mass.
Distribution of study variables in relation to quartiles of total body water, V.
| Quartile of V, L, mean (interval) | 23.5 (17.4–27.0) | 29.3 (27.7–30.7) | 3.4 (30.8–36.9) | 42.5 (37–51.1) | Sig. p |
|---|---|---|---|---|---|
| Kt, l (SD) | 54.4 (6.4) | 55.6 (7.7) | 57.1 (7.6) | 57.4 (6.2) | 0.293 |
| Kt/V | 2.2 (0.43) | 1.9 (0.33) | 1.8 (0.25) | 1.4 (0.26) | <0.000 |
| Women, n (%) | 20 (40%) | 16 (32%) | 11 (22%) | 3 (6%) | <0.000 |
| Weight, kg | 57.0 (9.1) | 64.3 (12.6) | 74.5 (10.4) | 86.2 (17.6) | <0.000 |
| V/weight, l/kg | 0.42 (0.07) | 0.44 (0.07) | 0.45 (0.08) | 0.47 (0.07) | 0.057 |
| IMM (LTI), kg/m2 | 8.7 (1.6) | 10.5 (1.9) | 11.5 (2.0) | 13.6 (2.4) | <0.000 |
| Relative MM, % | 43.4 (7.1) | 38.9 (8.9) | 41.2 (7.7) | 34.8 (12.0) | <0.002 |
| Serum albumin, g/dl | 3.4 (0.53) | 3.4 (0.57) | 3.7 (0.51) | 4.0 (0.32) | <0.000 |
SD: standard deviation; IMM (LTI): lean mass index; MM: relative lean mass.
An average of 155 sessions per patient were evaluated, between 36 and 308. The mean and standard deviation of the coefficient of variation of the Kt in the sessions of each patient was 11.6 (4.6)% in the 18,998 sessions of the 127 patients. The mean Kt/V and Kt do not differ significantly from those corresponding to the dialysis in which the bioimpedance was performed.
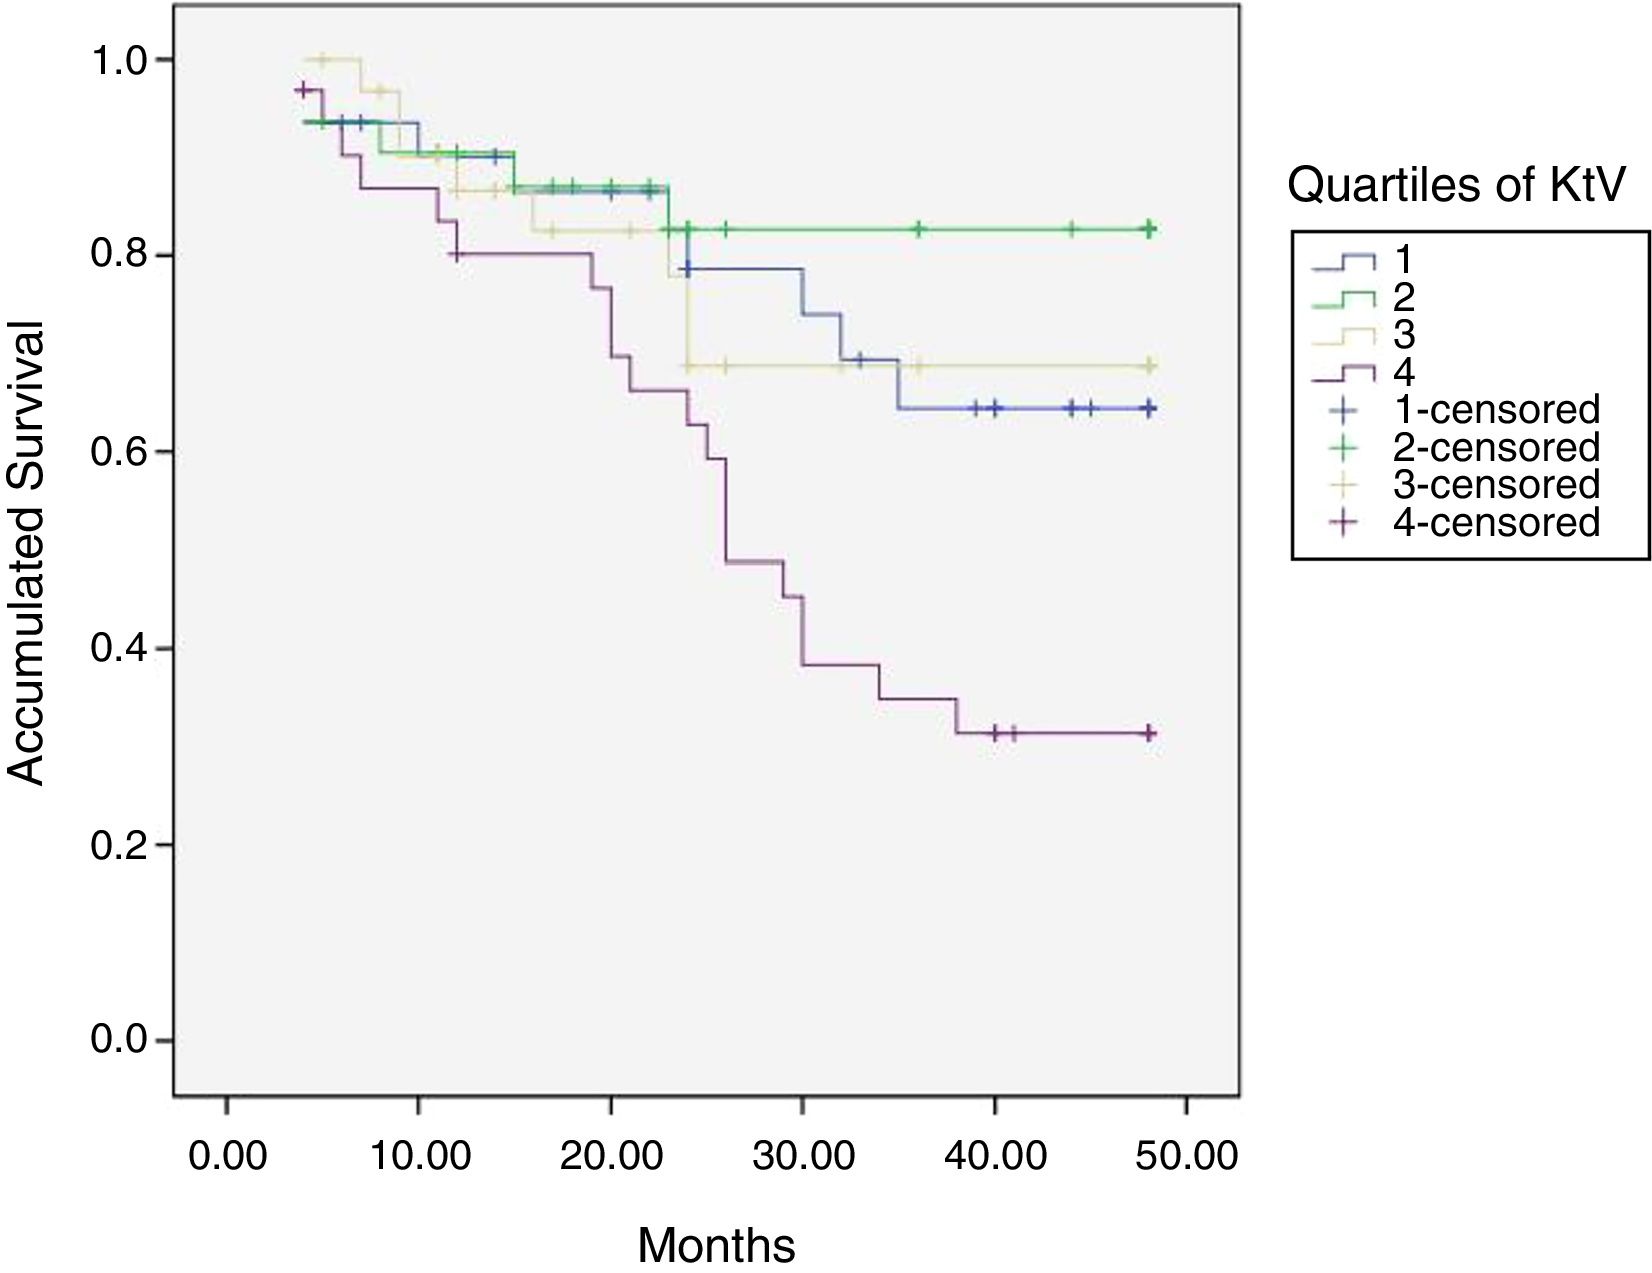
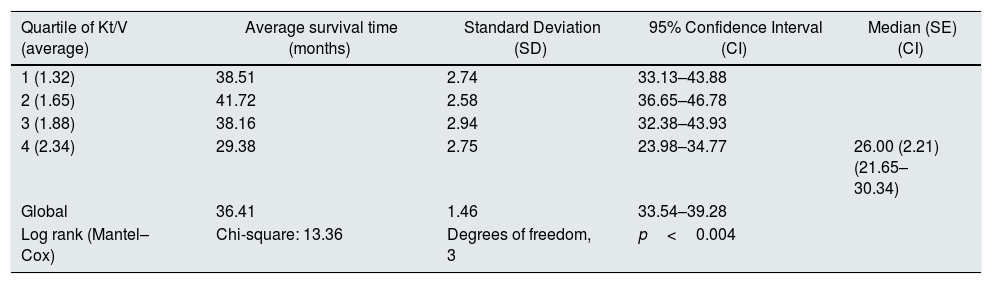
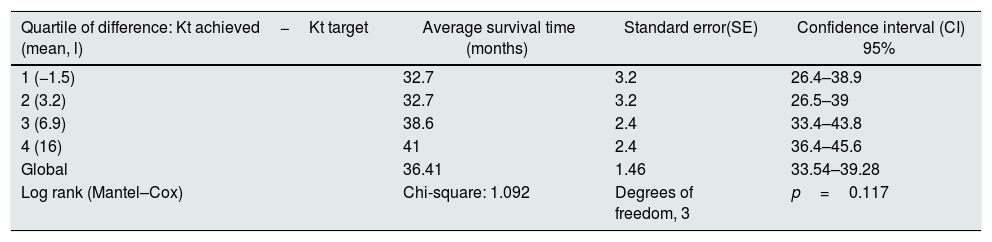
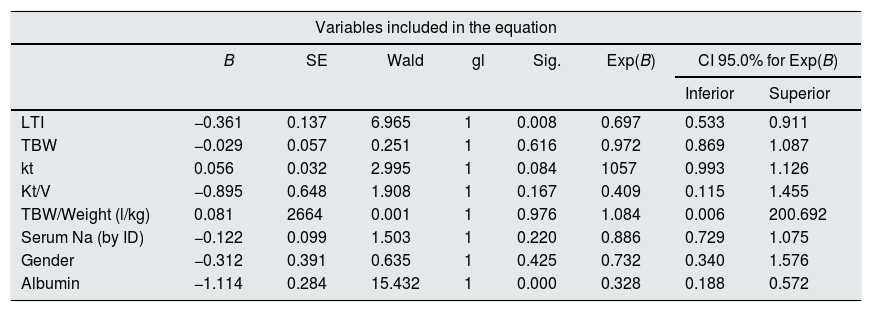
At the end of the mean follow-up of 36 months, between 24 and 48 months, 50 patients were still active, 42 had died, 23 had been transplanted and 12 had moved to another center. The estimated survival time of the cohort is 36.4 months, standar error of 1.47 and 95% confidence limits (33.5–39.3). Table 3 and Fig. 1 show the survival estimates for quartiles of Kt/V, being the estimate of 4th quartile lower as compared to the others (p<0.004). The quartiles of the difference Ktsc reached−target Ktsc (Table 4) were not significantly associated to mortality, although the upper quartile clearly had better survival. Other variables that were associated with mortality were: age; serum albumin; the LTI and the ACT. When a COX regression is applied with these variables, only albumin and LTI remain independent predcitors (Table 5).
Mean survival time during the follow-up of 127 patients. Comparison of survival time according to the quartiles of Kt/V, LR p<0.004 (with respect to the 4th quartile 9 months of difference).
| Quartile of Kt/V (average) | Average survival time (months) | Standard Deviation (SD) | 95% Confidence Interval (CI) | Median (SE) (CI) |
|---|---|---|---|---|
| 1 (1.32) | 38.51 | 2.74 | 33.13–43.88 | |
| 2 (1.65) | 41.72 | 2.58 | 36.65–46.78 | |
| 3 (1.88) | 38.16 | 2.94 | 32.38–43.93 | |
| 4 (2.34) | 29.38 | 2.75 | 23.98–34.77 | 26.00 (2.21) (21.65–30.34) |
| Global | 36.41 | 1.46 | 33.54–39.28 | |
| Log rank (Mantel–Cox) | Chi-square: 13.36 | Degrees of freedom, 3 | p<0.004 |
The estimation is limited to the longer survival time if it has been censored.
Proof of equal distributions of survival for the different quartiles of Kt/V.

Mean survival time during follow-up of the 127 patients. Comparison of survival time according to the quartiles of the difference: Kt achieved−Kt target, LR p=0.117 (the 1st and 2nd quartiles have 8 months difference from the 4th).
| Quartile of difference: Kt achieved−Kt target (mean, l) | Average survival time (months) | Standard error(SE) | Confidence interval (CI) 95% |
|---|---|---|---|
| 1 (−1.5) | 32.7 | 3.2 | 26.4–38.9 |
| 2 (3.2) | 32.7 | 3.2 | 26.5–39 |
| 3 (6.9) | 38.6 | 2.4 | 33.4–43.8 |
| 4 (16) | 41 | 2.4 | 36.4–45.6 |
| Global | 36.41 | 1.46 | 33.54–39.28 |
| Log rank (Mantel–Cox) | Chi-square: 1.092 | Degrees of freedom, 3 | p=0.117 |
The estimation is limited to the longer survival time if it has been censored.
Proof of equal distributions of survival for the different quartiles of Kt.
COX regression analysis in the cohort of 127 patients on HD. Serum albumin and IMM (LTI) maintain an independent significant prediction of mortality.
| Variables included in the equation | ||||||||
|---|---|---|---|---|---|---|---|---|
| B | SE | Wald | gl | Sig. | Exp(B) | CI 95.0% for Exp(B) | ||
| Inferior | Superior | |||||||
| LTI | −0.361 | 0.137 | 6.965 | 1 | 0.008 | 0.697 | 0.533 | 0.911 |
| TBW | −0.029 | 0.057 | 0.251 | 1 | 0.616 | 0.972 | 0.869 | 1.087 |
| kt | 0.056 | 0.032 | 2.995 | 1 | 0.084 | 1057 | 0.993 | 1.126 |
| Kt/V | −0.895 | 0.648 | 1.908 | 1 | 0.167 | 0.409 | 0.115 | 1.455 |
| TBW/Weight (l/kg) | 0.081 | 2664 | 0.001 | 1 | 0.976 | 1.084 | 0.006 | 200.692 |
| Serum Na (by ID) | −0.122 | 0.099 | 1.503 | 1 | 0.220 | 0.886 | 0.729 | 1.075 |
| Gender | −0.312 | 0.391 | 0.635 | 1 | 0.425 | 0.732 | 0.340 | 1.576 |
| Albumin | −1.114 | 0.284 | 15.432 | 1 | 0.000 | 0.328 | 0.188 | 0.572 |
| Omnibus tests for coefficients of modela,b | |||||||||
|---|---|---|---|---|---|---|---|---|---|
| −2 log of the credibility | Global (score) | Change from the previous step | Change from the previous block | ||||||
| Chi squared | gl | Sig. | Chi-square | gl | Sig. | Chi-square | gl | Sig. | Chi-square |
| 311.348 | 8 | 0.000 | 70.695 | 8 | 0.000 | 60.864 | 8 | 0.000 | 60.864 |
TBW: total body water; SE: standard error; CI: confidence interval; LTI: lean mass index; Serum Na (by ID): serum sodium calculated by ionic dialysis; Sig.: significance (p).
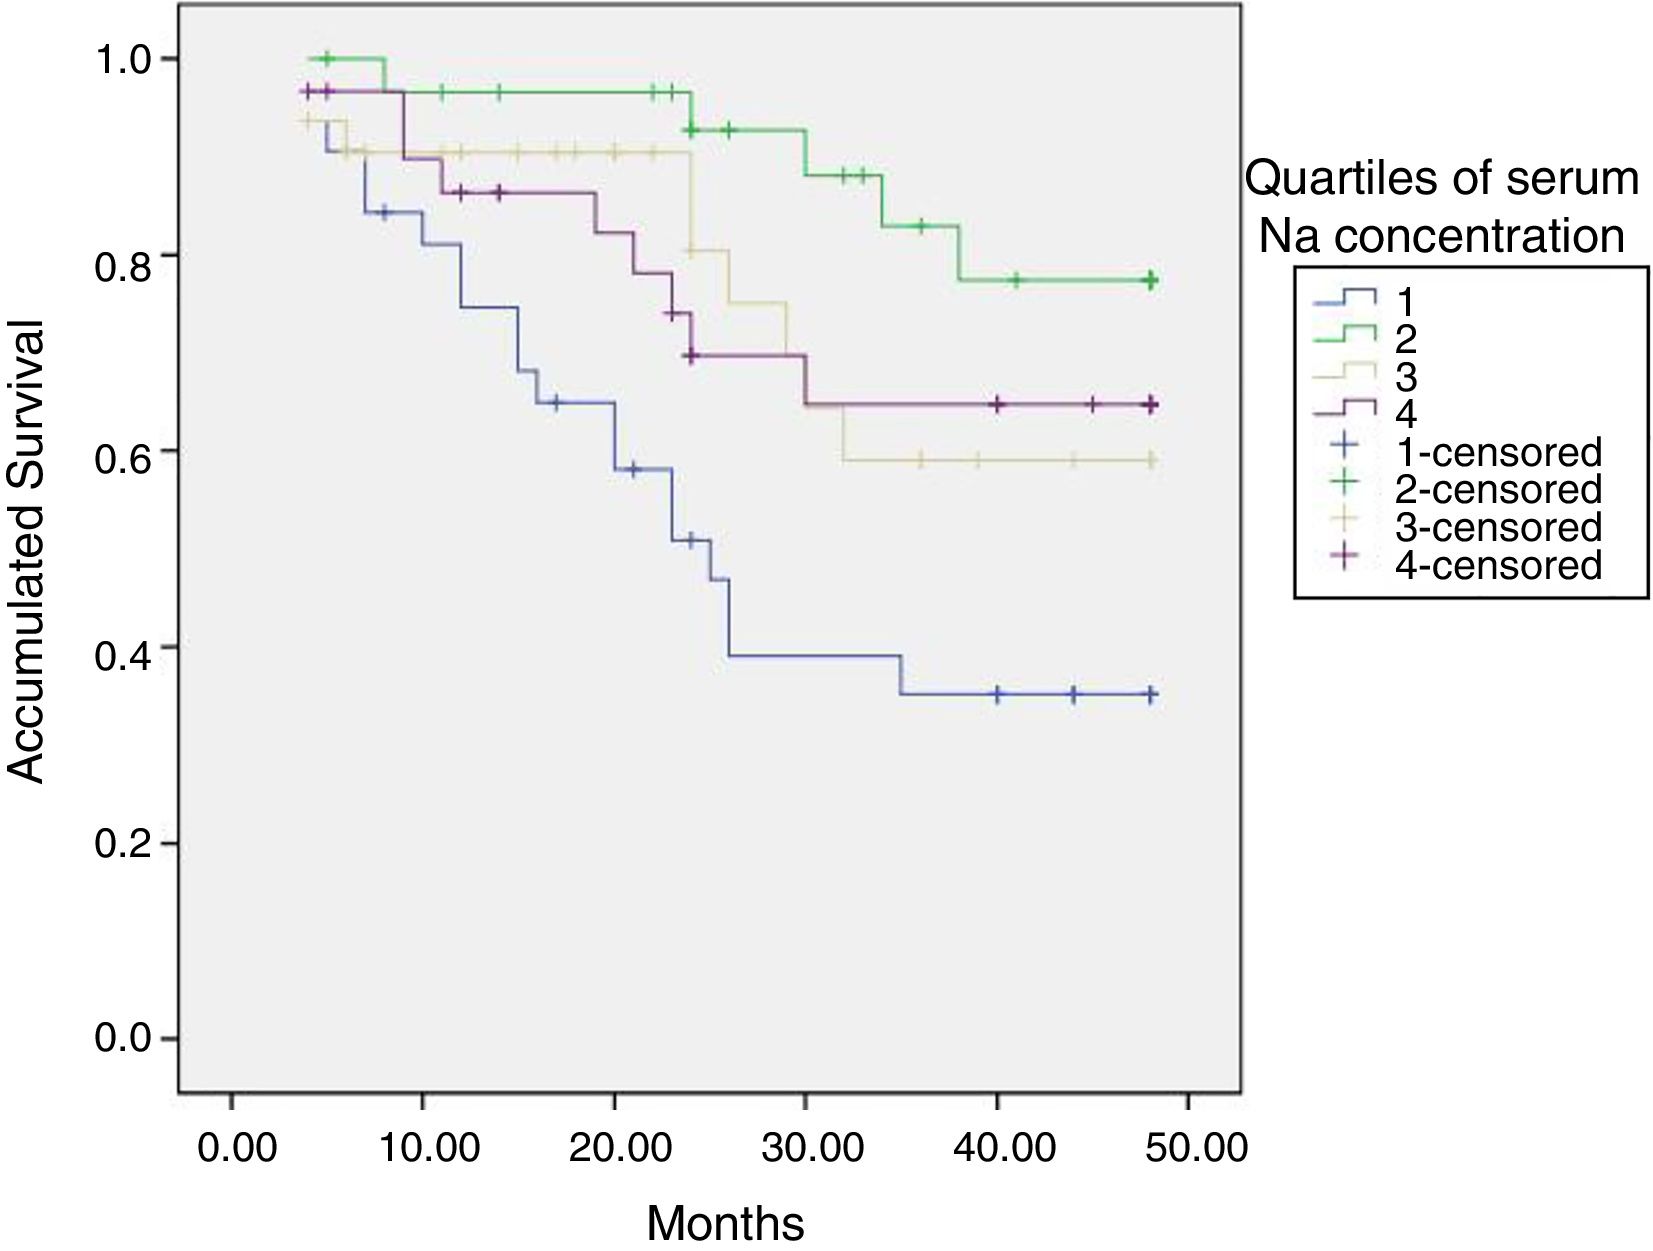
The calculated natremia (ID) at the start of HD was 138.4 (1.75)mmol/l.
The initial natremia was related to mortality; hyponatremic patients, the lowest quartile, had a worse prognosis (Fig. 2).
Discussion. ID: ionic dialysance.")
In this cohort of HD patients, patients with a higher Kt/V have higher mortality. The highest Kt improves survival, but not significantly. The BW, V, is inversely related to mortality. In this series, the Kt/V depends more on V than on Kt. The V, BW measured by bioimpedance, is related to nutritional parameters such as LTI, relative lean mass and intracellular water. Of the variables studied, LTI and serum albumin are the best independent predictors of mortality. Therefore the usefulness of Kt/V as a measure of the “amount of dialysis” is limited in patients with low V and may lead to erroneous conclusions in patients with a low V due to malnutrition and low muscle mass. The Kt/V can be replaced by the Kt, corrected or not by the body surface, which does not have the bias presented by V.
The Kt/V has been considered as the parameter to be used to define the “amount of dialysis”. The Kt was divided by the V to correct for body size and to be able to apply formulas of urea kinetics. According to the KDOQI guidelines, the target Kt/V has been considered to be >1.2 or a percentage of urea reduction >65%.23 Given the evidence that women and people with low weight could benefit from a higher Kt/V, the recommended Kt/V has been >1.310. The Kt/V has been useful as a reference to control and improve the amount of dialysis. In Spain, the percentage of centers that reached the standards defined by the Quality Group of the Spanish Society of Nephrology increased from 65 to 90.9%, following the objective of the Kt/V standard (Daugirdas II, >1.3 in more than 80% of patients).25
The question being addressed is whether the usual correction of the Kt by the BW is adequate. This approach presents difficulties when interpreting the results of observational studies due to the bias of the dose indication.26 Alternative methods have been proposed to correct Kt: by gender,27 by the body surface,24 by metabolic parameters, such as the protein catabolic rate (PCR)28,29 or by the visceral mass as a possible source of uremic toxins.30
In 1999, Lowrie et al.31 proposed Kt as marker of dialysis dose and mortality, and recommended a minimum Kt of 40–45l in women and 45–50l in males. In a subsequent study,24 the same authors correlated different requirements of Kt as a function of body surface, taking into account the anthropometric differences of subjects of the same gender, and validating this in a later study.18 This same method of correction of Kt by body surface has been validated in the Spanish population.19,20 In the Hospital Universitario Infanta Leonor we control the dose of HD with the Kt. In this work, the mean Kt and the mean Ktsc are quite superior to those considered as a the minimum recommended, in +6.4l of average. This value is similar to +6.5l obtained in a study in a large population of Spanish patients,19 and higher than in other previous studies: +0.3 in a study in the United States population in 200618 and +3.3l in the Spanish population in 2013.20 Due to the limited number of patients in the present study, it is not possible to observe if higher Kt can improve survival, as it has been shown in other studies.18–20 In these previous studies, the percentage of patients who reached the Ktsc goal was 53, 67, and 81%.18–20 In this study only 5% of patients can be considered under-dialyzed, Ktsc target>Ktsc achieved.
The target of Ktsc18 is more demanding than that of Kt/V.8,19,20,32,33 The monitoring of the dialysis dose with the Kt allows a better discrimination of the adequacy of the dialysis, identifying between 30 and 40% of patients who may not reach an adequate dose given their gender or their body surface.31 The patients who have more difficulty to reach the target Kt are: patients with catheters, elderly patients, with less time on regular HD, shorter dialysis sessions, low blood flow, greater body weight and women with respect to men.20 In the resent study we have observed a smaller proportion of patients with catheters with high Kt. The presence of catheters with a lower K is compensated with a higher t value. In 1999 Chertowet al.17 advanced the idea that the problem of using Kt/V as a predictor of mortality in HD could be in the value of V. In such work, the BW of 3009 patients is determined in HD using bioimpedance of monofrequency, and the BW was calculated using 3 different anthropometric formulas, including that of Watson.34 In that population, the risk of mortality adjusted according to the quintiles of PRU depict a “J” curve. The Patients in the higher quintile, have a greater risk of death than those in the 3rd and they had 5.9l (15%) less of BW. In the same population the quintiles of Kt do not present a curve in J in relation to the risk of death. The same results are obtained calculating the BW by anthropometric formulas. The Kt is calculated from the urea kinetic model. His conclusion is that a Kt/V alto may be due to a high Kt or a low V. This last possibility implies an important bias of the Kt/V in its relation with mortality. A low V may be due to a low body weight and/or a water ratio to low weight, as it happens in women. In other cases, a low V is related to a low lean mass index, a marker of malnutrition, and that has a strong relationship with the risk of death.
Protein malnutrition or protein-energy wasting is significantly related to the degree of hydration, intracellular water and the ratio intracellular/extracellular water.35,36 Patients with protein malnutrition have a poor prognosis and maintain a high Kt/V based on a low V in relation to their weight. Serum albumin, a marker of nutrition and predictor of mortality, is also directly related to V in this study. A population with a low V relative to their weight are the elderly patients. In our environment, half of the patients in HD are over 70 years. In the Registry of Renal Patients of the Community of Madrid (REMER)37 this type of patients have increased the most among the incident patients in the last years. In the 807 incident patients who underwent renal replacement therapy in 2015 in the Community of Madrid, a 35.3% were older than 74 years. These elderly patients have a low V and therefore the Kt/V can give us an appearance of adequate dialysis that does not correspond to the target Kt. Hyponatremia is a marker of poor prognosis in HD patients, as in the general population.38,39 Our patients show that a serum sodium of <136mEq/l have a higher risk of death. Patients with hyponatremia coincide with those with low LTI; in fact, in the multivariate analysis, by including the two factors, hyponatremia loses its significance. The relationship of malnutrition with hyponatremia has already been proven.38 Among the limitations of this study is the low number of patients, although being from a single center avoids other types of biases. However, the Kt and Kt/V have not been included throughout the follow-up, nor has been used in a time-dependent regression analysis.
In the work by Chertow et al.17 the data is collected during an average of 3 months and the use bioimpedance; in the present study we have used the average of 155 dialysis, which corresponds to 12 months. The variation of Kt administered in the different sessions of the same patient is not negligible, with a coefficient of variation of 0.116 (11.6%). McIntyre et al.40 found an individual coefficient of variation of 0.13 (0.1). For this reason in this type of study it is important to analyze the mean Kt from a significant number of sessions, which here has been the average of the sessions during a 12 month period.
Modern HD machines with ID are able to provide the final Kt of the session and calculate the Kt/V with a V that we provide/annotate; in the future it would also be possible that HD machines will inform about the Ktsc based on the body surface. Each patient should achieve a target Kt in most sessions. It has been proposed to correct the Kt/V by the body surface to avoid the mentioned problems, although it remains to be evaluate if this is useful and of course it is more cumbersome than the Ktsc.41
Conclusion: the Kt is a direct measurement made by the modern HD monitors through of the ID. To estimate the minimum “amount of HD” for each patient, it is not necessary to use V, which may mask a low Kt in malnourished patients with a poor prognosis. Kt/V is not valid to determine the dose of dialysis in patients with a small or diminished BW. The Kt or the Ktsc could be a substitute for the Kt/V.
Conflict of interestsThe first author declares that he has no conflicts of interest in relation to this work.
To all the staff of the Dialysis Unit of the H.U. Infanta Leonor, without them this work would have not been possible.
Please cite this article as: Pérez-García R, Jaldo M, Alcázar R, de Sequera R, Albalate M, Puerta M, et al. El Kt/V alto, a diferencia del Kt, se asocia a mayor mortalidad: importancia de la V baja. Nefrologia. 2019;39:58–66.


