Bone and mineral abnormalities, and cardiovascular calcification are associated with increased cardiovascular mortality in patients with chronic kidney disease (CKD). Recent studies have implicated Wnt signaling pathway in the pathogenesis of bone metabolism and vascular calcification. Sclerostin is a soluble inhibitor of Wnt signaling pathway and has been shown to be associated with decreased bone turnover and vascular calcification in CKD patients.
ObjectivesThe aim was to investigate whether the circulating levels of sclerostin are associated with all-cause mortality in prevalent hemodialysis patients.
MethodsData are prospectively collected for 24 months for survival analysis in 350 prevalent hemodialysis patients. At baseline, serum sclerostin levels were measured and arteriovenous fistula calcification was detected by using a 64-detector computerized tomographic scanner.
ResultsDuring the follow-up, 84 (24%) patients died. Patients who died had higher serum sclerostin levels. Kaplan–Meier curve revealed that patients with increasing tertiles of serum sclerostin levels at baseline, had a worse survival. In the multivariate Cox regression analysis age, albumin, and presence of arteriovenous fistula calcification, but not sclerostin levels, were found to be independent predictors of survival in maintenance hemodialysis patients.
ConclusionFurther clinical studies with longer follow-up are needed to clarify the impact of serum sclerostin levels on morbidity and mortality of maintenance hemodialysis patients.
Clinical trial registration numberThe study was performed as a post hoc survival analysis of the patients involved in a single-center prospective trial investigating the association between serum sclerostin levels and arteriovenous fistula calcification and patency [Balcı M, et al. Herz 2015;40:289–97] with a Clinicaltrials.gov number: NCT01382966.
Algunas anomalías minerales óseas y la calcificación cardiovascular están asociadas con un aumento en la mortalidad cardiovascular en pacientes con enfermedad renal crónica (ERC). Estudios recientes han implicado a la vía de señalización Wnt en la patogenia del metabolismo óseo y la calcificación vascular. La esclerostina es un inhibidor soluble de la vía de señalización Wnt y se ha demostrado que está relacionada con una reducción del recambio óseo y de la calcificación vascular en pacientes con ERC.
ObjetivoEl objetivo fue investigar si los niveles circulantes de esclerostina están asociados con la mortalidad por todas las causas en pacientes en hemodiálisis prevalente.
MétodosSe recogieron datos de manera prospectiva durante 24 meses para el análisis de supervivencia en 350 pacientes en hemodiálisis prevalente. Al inicio del estudio se midieron los niveles de esclerostina sérica y se detectó calcificación de la fístula arteriovenosa mediante el uso de un escáner tomográfico computarizado de 64 detectores.
ResultadosDurante el período de seguimiento, murieron 84 pacientes (24%). Los pacientes que murieron presentaban elevados niveles de esclerostina sérica. La curva de Kaplan–Meier reveló que los pacientes con terciles en aumento de esclerostina sérica al inicio del estudio tenían peores tasas de supervivencia. En el análisis de regresión de Cox multivariado, la edad, los valores de albúmina y la existencia de calcificación de la fístula arteriovenosa, pero no los niveles de esclerostina, demostraron ser los indicadores independientes de supervivencia en pacientes en hemodiálisis de mantenimiento.
ConclusiónSe necesitan más estudios clínicos con un seguimiento más extenso para aclarar el impacto de los niveles de esclerostina sérica en la morbimortalidad de los pacientes en hemodiálisis de mantenimiento.
Número de registro del ensayo clínicoEl estudio se llevó a cabo como un análisis post hoc de supervivencia de los pacientes involucrados en un ensayo prospectivo de un único centro, que investigaba la asociación entre niveles de esclerostina sérica y la calcificación y permeabilidad de la fístula arteriovenosa [Balcı M, et al. Herz 2015;40:289–97], con el número NCT01382966 en Clinicaltrials.gov.
A growing body of evidence indicates that abnormalities of bone and mineral metabolism in chronic kidney disease (CKD) may contribute to the development of cardiovascular disease and increased cardiovascular mortality, with the most likely link being the development of vascular calcification.1,2 The signaling pathways involved in these processes remain incompletely understood.3,4
Sclerostin is a soluble inhibitor of Wnt/b-catenin (canonical) signaling pathway.5 The main action of sclerostin is a decrease in bone formation via inhibiting osteoblast proliferation and differentiation, and promoting osteoblast apoptosis.6 Recently, increased levels of sclerostin were shown to be associated with decreased bone turnover and osteoblast number in dialysis patients.7 On the other hand, sclerostin has been demonstrated to be upregulated during vascular smooth muscle cell calcification in vitro.8 It needs to be further explored that whether the effects of sclerostin on bone turnover and vascular tissue also translate into clinically significant changes.
The aim of the present prospective study was to investigate the association of circulating concentrations of sclerostin and all-cause mortality in maintenance hemodialysis patients, due to limited data in this area.
MethodsPatientsThe study protocol was performed according to the Declaration of Helsinki and was approved by the local ethics committee of Yuksek Ihtisas Training and Research Hospital, Ankara, Turkey and all the patients provided written informed consent before entering the study.
A post hoc survival analysis of the patients involved in a single-center prospective trial investigating the association between serum sclerostin levels and arteriovenous fistula calcification and patency, was performed [Balcı M, et al. Herz 2015;40:289–97]. The study was done at the RFM Dialysis Center, Ankara, Turkey between August 2011 and July 2013. The exclusion criteria in that work were vascular access other than mature native forearm arteriovenous fistula, a previous history of intervention like percutaneous angioplasty and/or stenting, a mature forearm arteriovenous fistula unable to provide spKt/V>1.2 in a 4-h dialysis session, active infection, active malignancy, active autoimmune disease, recent hospitalization or unstable hemodynamic status in the preceding 3 months, and patient refusal.
At August 1st 2011, 350 patients (155 women and 195 men, mean age 55±10 years, mean hemodialysis vintage: 56±23 months, on hemodialysis thrice a week for at least 6 months) had all work-up finished for the eligibility and allocation. The patients suffered from end stage renal disease due to diabetic nephropathy (n=124), hypertensive nephrosclerosis (n=102), chronic glomerulonephritis (n=77), chronic pyelonephritis (n=12) and polycystic disease (n=15). The renal diagnosis was unknown in 20 patients. Presence of residual renal function (RRF) was defined as residual glomerular filtration rate ≥1mL/min. Mean residual renal function was 0.7±1.1mL/min/1.73m2.
All patients were ≥18 years of age and were receiving conventional 4-h hemodialysis with synthetic polysulphone dialysers F6HPS and F7HPS (Fresenius AG, Bad Homburg, Germany) thrice a week, with bicarbonate dialysate, and low-molecular-weight heparin for standard anticoagulation. Mean blood flow rate was 300mL/min during the HD session (range 250–340mL/min). Dialysate fluid composition was sodium 140mEq/L, potassium 2–3mEq/L, calcium 3mEq/L and bicarbonate 33mEq/L. Targeted dialysis efficiency was based on single pool Kt/V urea nitrogen (spKt/V) values according to the National Kidney Foundation-Kidney Disease Outcomes Quality Initiative Guidelines.
Angiotensin-converting enzyme inhibitors (n=44), angiotensin receptor blockers (n=66), beta-blockers (n=82) and calcium channel blockers (n=76) were given for hypertension management. Patients were prescribed treatments including CaCO3 (32%), sevelamer-HCl (19%), Ca acetate (41%), calcitriol (69%), anti-platelet agents (70%), warfarin (5%) and erythropoietin (68%). The mean erythropoietin dose was 145U/kg/week achieving a mean hemoglobin (Hb) serum level of 11.2g/dL; <10% of patients had serum Hb <10g/dL. None of the patients received calcimimetic, glucocorticoid, statin, bisphosphonates or denosumab.
Clinical parameters and biochemical assaysInformation regarding baseline demographic characteristics, etiology of end stage renal disease, presence of diabetes mellitus were collected by reviewing medical records. Cardiovascular history was defined as history of myocardial infarction, percutaneous coronary artery intervention, cardiac by-pass or valvular surgery, peripheral artery disease or stroke.
Venous blood samples were drawn after an overnight fast. The blood sample was obtained directly through an arteriovenous fistula on a mid-week non-dialysis day. Biochemical serum parameters (creatinine, blood urea nitrogen, glucose, electrolytes, albumin and complete blood count calcium, phosphate, lipids, protein, cholesterol, and triglycerides) were performed by standard laboratory procedure using an automated analyzer. Serum C-reactive protein (CRP) level was detected by rate nephelometry (IMAGE). spKt/V value was calculated according to the Daugirdas second-generation formula.9 Normalized protein catabolic rate (nPCR) was calculated as a measure of daily protein intake of patients.10
Outcome, exposures and covariatesThe primary outcome was 24-months, all-cause mortality. The primary exposure variable was the baseline serum sclerostin level, measured at the initiation of outpatient hemodialysis. Serum sclerostin level was measured by a commercially available enzyme-linked immunosorbent assay (ELISA) (R&D Systems, Minneapolis, MN) according to the manufacturer's instructions and as used in previous studies by Cejka et al.7,11 The intra-assay and inter-assay coefficients of variation were 7.5% and 6.3%, respectively. Patients were classified in 3 groups according to value of baseline circulating sclerostin levels, corresponding to Group 1 (36–586pg/ml), Group 2 (587–1903pg/ml) and Group 3 (1904–8822pg/ml). Serum intact parathormone and alkaline phosphatase levels were studied by means of a computerized autoanalyser (Hitachi 717; Boehringer-Mannheim). Serum was available for radioimmunoassay of 25-dihydroxy vitamin D3 levels (DiaSorin Corporation, Stillwater, MN) in all patients.
Multi-detector spiral computerized tomographyA non-enhanced computed tomography (CT) was performed to measure to arteriovenous fistula calcium score on a 64-detector CT scanner (Aquilion; Toshiba Medical Systems, Tokyo, Japan) as a deputy marker of vascular calcification. Foci of arteriovenous fistula calcification was detected by an experienced radiologist and scored using semi-automatic commercial software (Vitrea 2, Vital images) by detection of at least 3 contiguous pixels (voxel size: 1.03mm3) of peak density ≥130Hounsfiels Units (HU). The lesion score was calculated with the area density method, by multiplying the lesion area by a density factor derived from the maximal HU within the area as described by Agatston.12 The density factor was assigned in the following manner: 1 for lesions whose maximal density was 130–199HU, 2 for lesions 200–299HU, 3 for lesions 300–399HU, and 4 for lesions >400HU. Based on these calculations, patients were divided into 2 groups as having non-calcified and calcified arteriovenous fistulas.
Statistical analysisNormally distributed continuous variables are presented as mean±standard deviation, and non-normally distributed continuous variables are presented as median with 25th and 75th percentiles. Categorical data are presented as percentages. To test for associations between serum sclerostin levels and demographic, clinical and laboratory parameters, we examined serum sclerostin levels in quartiles according to the distribution of values in HD patients. Differences in clinical and biochemical parameters were compared using analysis of variance for continuous variables and chi-square test for categorical variables, whereas non-parametric Kruskal–Wallis test was used for non-normally distributed continuous variables. Spearman correlation coefficients were obtained for all potential predictor variables to look for confounding. Multivariate statistical analysis (logistic regression, enter method) was used to account for possible confounders for arteriovenous fistula calcification. Kaplan–Meier survival analysis was used to calculate cumulative incidence of the all-cause mortality. Variables that affected all-cause mortality (p<0.2) in univariate analysis were then included in multivariate Cox proportional hazards models to determine risk factors associated with all-cause mortality. Test results were presented as hazard ratios with 95% confidence intervals, and a p-value of <0.05 was considered to be statistically significant. Data analysis was performed by using SPSS for Windows, version 15.0 (SPSS Inc., Chicago, IL, USA).
ResultsAssociation of baseline characteristics and sclerostinMean serum sclerostin level in hemodialysis patients was higher when compared to age- and gender-matched healthy controls (1519±1378 vs 128±49pg/ml, p<0.0001). Sclerostin levels were not significantly different in patients with a positive history of hypertension (1520±1479 vs 1506±1480pg/ml, p=0.870), dyslipidemia (1486±1432 vs 1541±1477, p=0.576) and smoking (1599±1356 vs 1534±1410, p=0.690) compared with those without. However, male patients had significantly higher serum sclerostin levels than female patients (1736±1109 vs 1212±975pg/ml, p=0.025). Moreover, patients with a positive cardiovascular history had higher serum levels than patients with not (2008±1635 vs 1431±1307pg/ml, p=0.018). Furthermore, patients with type 2 diabetes mellitus (DM) tended to have higher sclerostin levels than patients with not (1678±1476 vs 1404±1290pg/ml, p=0.071). No interaction between the use of calcitriol and serum sclerostin levels was found.
No significant correlations were observed between serum sclerostin levels and age, hemodialysis vintage, systolic and diastolic blood pressure, LDL- and HDL-cholesterol, triglycerides, hemoglobin, serum albumin, calcium, phosphate, alkaline phosphatase, uric acid and CRP levels. However, sclerostin levels were negatively correlated with log serum intact parathormone levels (r=−0.222, p=0.005).
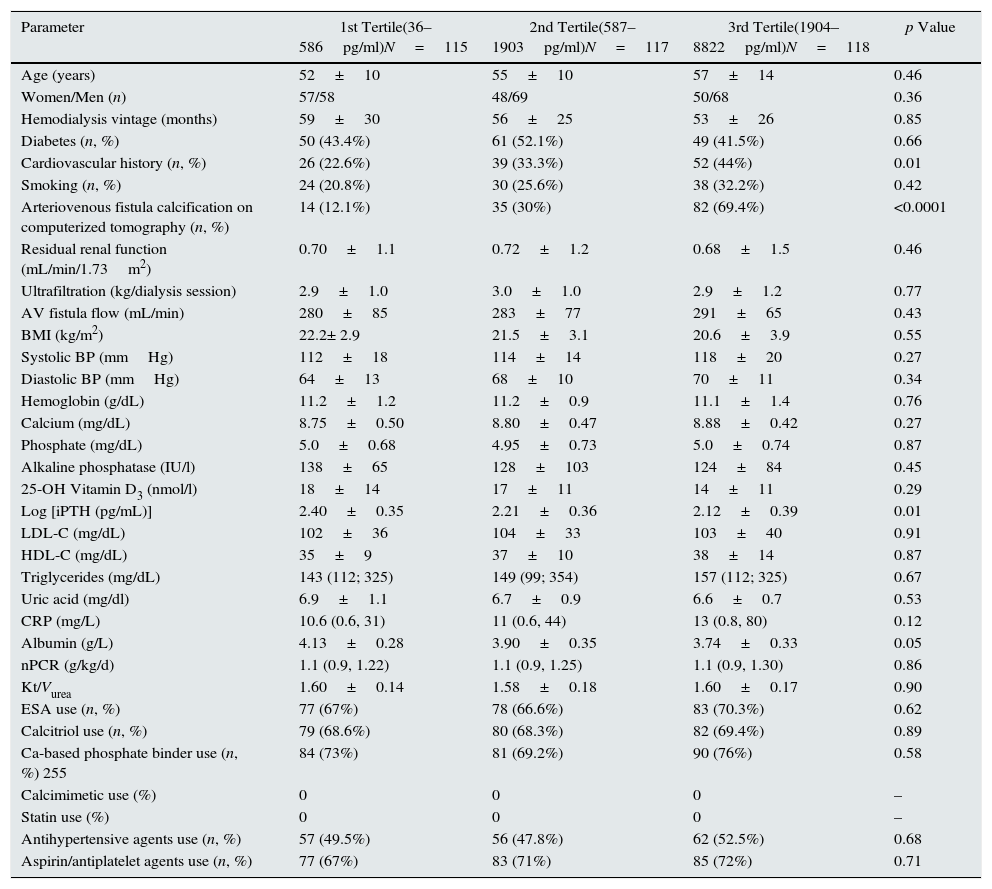
The demographic and clinical characteristics of the study patients according to the sclerostin tertiles are depicted in Table 1. Patients in the highest quartile had lower albumin levels and log intact parathormone (Table 1), and higher frequency of arteriovenous fistula calcification on computerized tomography and cardiovascular history (Table 1). No significant difference was noted for any other demographic, clinical and laboratory variables (Table 1).
Baseline demographic and clinical characteristics of patients according to serum sclerostin tertiles.
| Parameter | 1st Tertile(36–586pg/ml)N=115 | 2nd Tertile(587–1903pg/ml)N=117 | 3rd Tertile(1904–8822pg/ml)N=118 | p Value |
|---|---|---|---|---|
| Age (years) | 52±10 | 55±10 | 57±14 | 0.46 |
| Women/Men (n) | 57/58 | 48/69 | 50/68 | 0.36 |
| Hemodialysis vintage (months) | 59±30 | 56±25 | 53±26 | 0.85 |
| Diabetes (n, %) | 50 (43.4%) | 61 (52.1%) | 49 (41.5%) | 0.66 |
| Cardiovascular history (n, %) | 26 (22.6%) | 39 (33.3%) | 52 (44%) | 0.01 |
| Smoking (n, %) | 24 (20.8%) | 30 (25.6%) | 38 (32.2%) | 0.42 |
| Arteriovenous fistula calcification on computerized tomography (n, %) | 14 (12.1%) | 35 (30%) | 82 (69.4%) | <0.0001 |
| Residual renal function (mL/min/1.73m2) | 0.70±1.1 | 0.72±1.2 | 0.68±1.5 | 0.46 |
| Ultrafiltration (kg/dialysis session) | 2.9±1.0 | 3.0±1.0 | 2.9±1.2 | 0.77 |
| AV fistula flow (mL/min) | 280±85 | 283±77 | 291±65 | 0.43 |
| BMI (kg/m2) | 22.2± 2.9 | 21.5±3.1 | 20.6±3.9 | 0.55 |
| Systolic BP (mmHg) | 112±18 | 114±14 | 118±20 | 0.27 |
| Diastolic BP (mmHg) | 64±13 | 68±10 | 70±11 | 0.34 |
| Hemoglobin (g/dL) | 11.2±1.2 | 11.2±0.9 | 11.1±1.4 | 0.76 |
| Calcium (mg/dL) | 8.75±0.50 | 8.80±0.47 | 8.88±0.42 | 0.27 |
| Phosphate (mg/dL) | 5.0±0.68 | 4.95±0.73 | 5.0±0.74 | 0.87 |
| Alkaline phosphatase (IU/l) | 138±65 | 128±103 | 124±84 | 0.45 |
| 25-OH Vitamin D3 (nmol/l) | 18±14 | 17±11 | 14±11 | 0.29 |
| Log [iPTH (pg/mL)] | 2.40±0.35 | 2.21±0.36 | 2.12±0.39 | 0.01 |
| LDL-C (mg/dL) | 102±36 | 104±33 | 103±40 | 0.91 |
| HDL-C (mg/dL) | 35±9 | 37±10 | 38±14 | 0.87 |
| Triglycerides (mg/dL) | 143 (112; 325) | 149 (99; 354) | 157 (112; 325) | 0.67 |
| Uric acid (mg/dl) | 6.9±1.1 | 6.7±0.9 | 6.6±0.7 | 0.53 |
| CRP (mg/L) | 10.6 (0.6, 31) | 11 (0.6, 44) | 13 (0.8, 80) | 0.12 |
| Albumin (g/L) | 4.13±0.28 | 3.90±0.35 | 3.74±0.33 | 0.05 |
| nPCR (g/kg/d) | 1.1 (0.9, 1.22) | 1.1 (0.9, 1.25) | 1.1 (0.9, 1.30) | 0.86 |
| Kt/Vurea | 1.60±0.14 | 1.58±0.18 | 1.60±0.17 | 0.90 |
| ESA use (n, %) | 77 (67%) | 78 (66.6%) | 83 (70.3%) | 0.62 |
| Calcitriol use (n, %) | 79 (68.6%) | 80 (68.3%) | 82 (69.4%) | 0.89 |
| Ca-based phosphate binder use (n, %) 255 | 84 (73%) | 81 (69.2%) | 90 (76%) | 0.58 |
| Calcimimetic use (%) | 0 | 0 | 0 | – |
| Statin use (%) | 0 | 0 | 0 | – |
| Antihypertensive agents use (n, %) | 57 (49.5%) | 56 (47.8%) | 62 (52.5%) | 0.68 |
| Aspirin/antiplatelet agents use (n, %) | 77 (67%) | 83 (71%) | 85 (72%) | 0.71 |
Abbreviations and definitions: AV, arteriovenous; PAD; peripheral arterial disease; BP, blood pressure; BMI, body mass index; ESA, erythropoiesis-stimulating agent; hs-CRP, high-sensitivity C-reactive protein; Log iPTH, logarithm of serum intact parathyroid hormone; LDL-C, low-density lipoprotein cholesterol; nPCR, normalized protein catabolic rate; statins, HMG-CoA (3-hydroxy-3-methylglutaryl coenzyme A) reductase inhibitors.
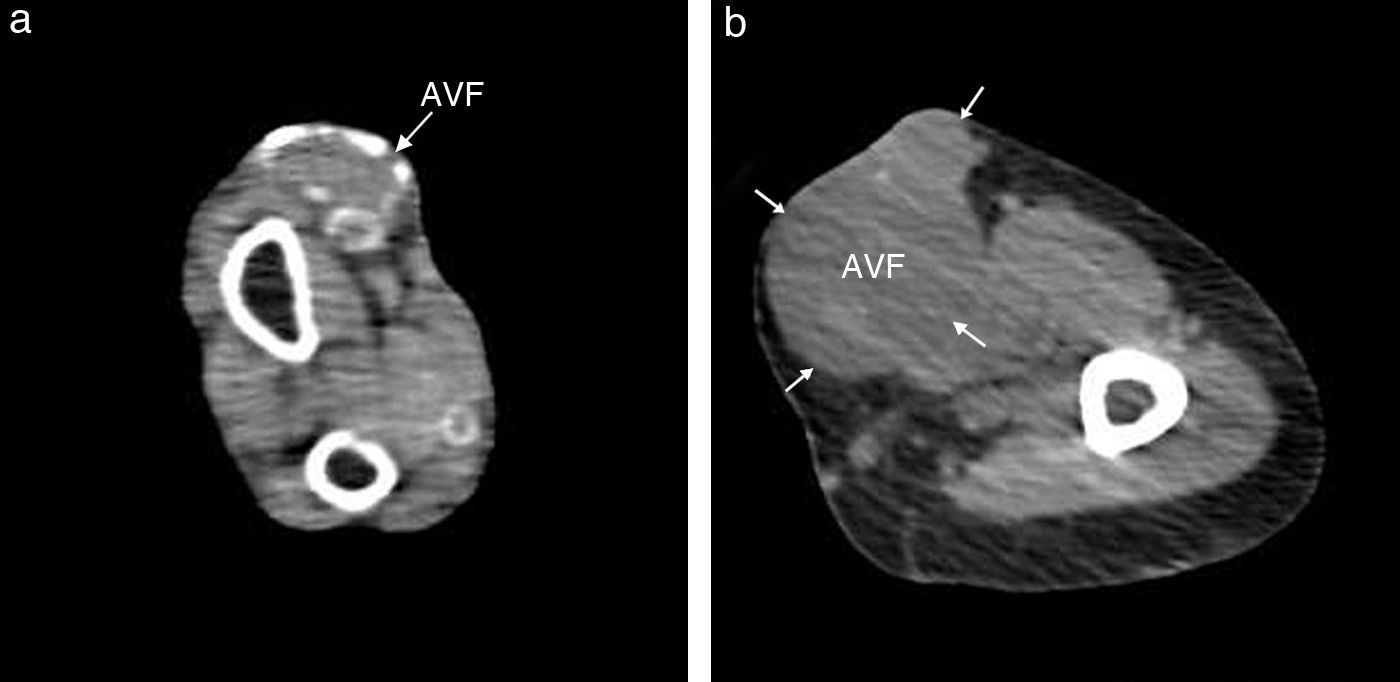
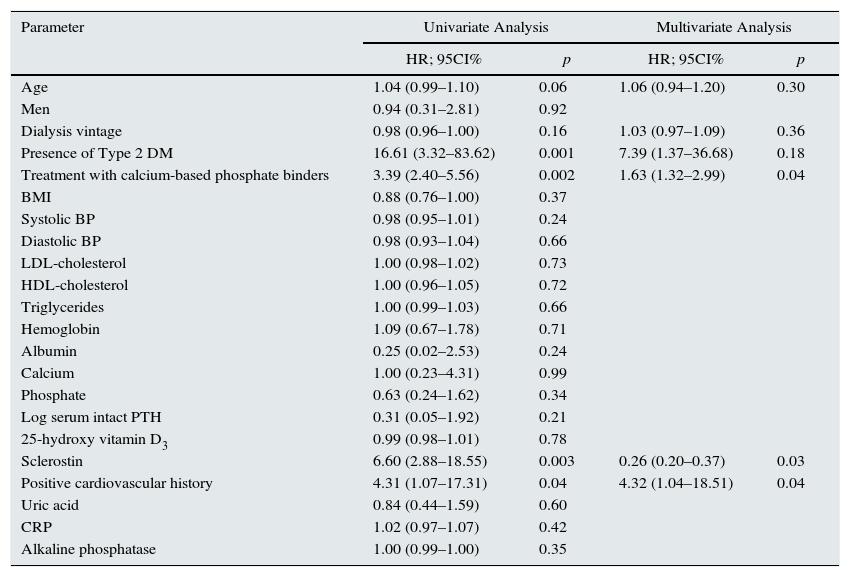
Patients with arteriovenous fistula calcification (Fig. 1) had higher sclerostin levels than patients without (2564±1841 vs 1063±706pg/ml, p<0.0001). According to univariate logistic regression analysis, diabetes mellitus, cardiovascular history, treatment with calcium-based phosphate binders and sclerostin levels were significant predictors for arteriovenous fistula calcification (Table 2). Increased age tended to influence arteriovenous fistula calcification among study patients. The multivariate logistic regression analysis corrected for calcitriol use revealed that presence of positive cardiovascular history, treatment with calcium-based phosphate binders and lower but not higher serum sclerostin levels predicted arteriovenous fistula calcification independently (Table 2).
 (a) and a non-calcified AVF (b).")
Univariate and multivariate logistic regression analysis for arteriovenous fistula calcification.
| Parameter | Univariate Analysis | Multivariate Analysis | ||
|---|---|---|---|---|
| HR; 95CI% | p | HR; 95CI% | p | |
| Age | 1.04 (0.99–1.10) | 0.06 | 1.06 (0.94–1.20) | 0.30 |
| Men | 0.94 (0.31–2.81) | 0.92 | ||
| Dialysis vintage | 0.98 (0.96–1.00) | 0.16 | 1.03 (0.97–1.09) | 0.36 |
| Presence of Type 2 DM | 16.61 (3.32–83.62) | 0.001 | 7.39 (1.37–36.68) | 0.18 |
| Treatment with calcium-based phosphate binders | 3.39 (2.40–5.56) | 0.002 | 1.63 (1.32–2.99) | 0.04 |
| BMI | 0.88 (0.76–1.00) | 0.37 | ||
| Systolic BP | 0.98 (0.95–1.01) | 0.24 | ||
| Diastolic BP | 0.98 (0.93–1.04) | 0.66 | ||
| LDL-cholesterol | 1.00 (0.98–1.02) | 0.73 | ||
| HDL-cholesterol | 1.00 (0.96–1.05) | 0.72 | ||
| Triglycerides | 1.00 (0.99–1.03) | 0.66 | ||
| Hemoglobin | 1.09 (0.67–1.78) | 0.71 | ||
| Albumin | 0.25 (0.02–2.53) | 0.24 | ||
| Calcium | 1.00 (0.23–4.31) | 0.99 | ||
| Phosphate | 0.63 (0.24–1.62) | 0.34 | ||
| Log serum intact PTH | 0.31 (0.05–1.92) | 0.21 | ||
| 25-hydroxy vitamin D3 | 0.99 (0.98–1.01) | 0.78 | ||
| Sclerostin | 6.60 (2.88–18.55) | 0.003 | 0.26 (0.20–0.37) | 0.03 |
| Positive cardiovascular history | 4.31 (1.07–17.31) | 0.04 | 4.32 (1.04–18.51) | 0.04 |
| Uric acid | 0.84 (0.44–1.59) | 0.60 | ||
| CRP | 1.02 (0.97–1.07) | 0.42 | ||
| Alkaline phosphatase | 1.00 (0.99–1.00) | 0.35 | ||
Abbreviations and definitions: DM, diabetes mellitus; BMI, body mass index; BP, blood pressure; Log iPTH, logarythm of serum intact parathyroid hormone; CRP, C-reactive protein.
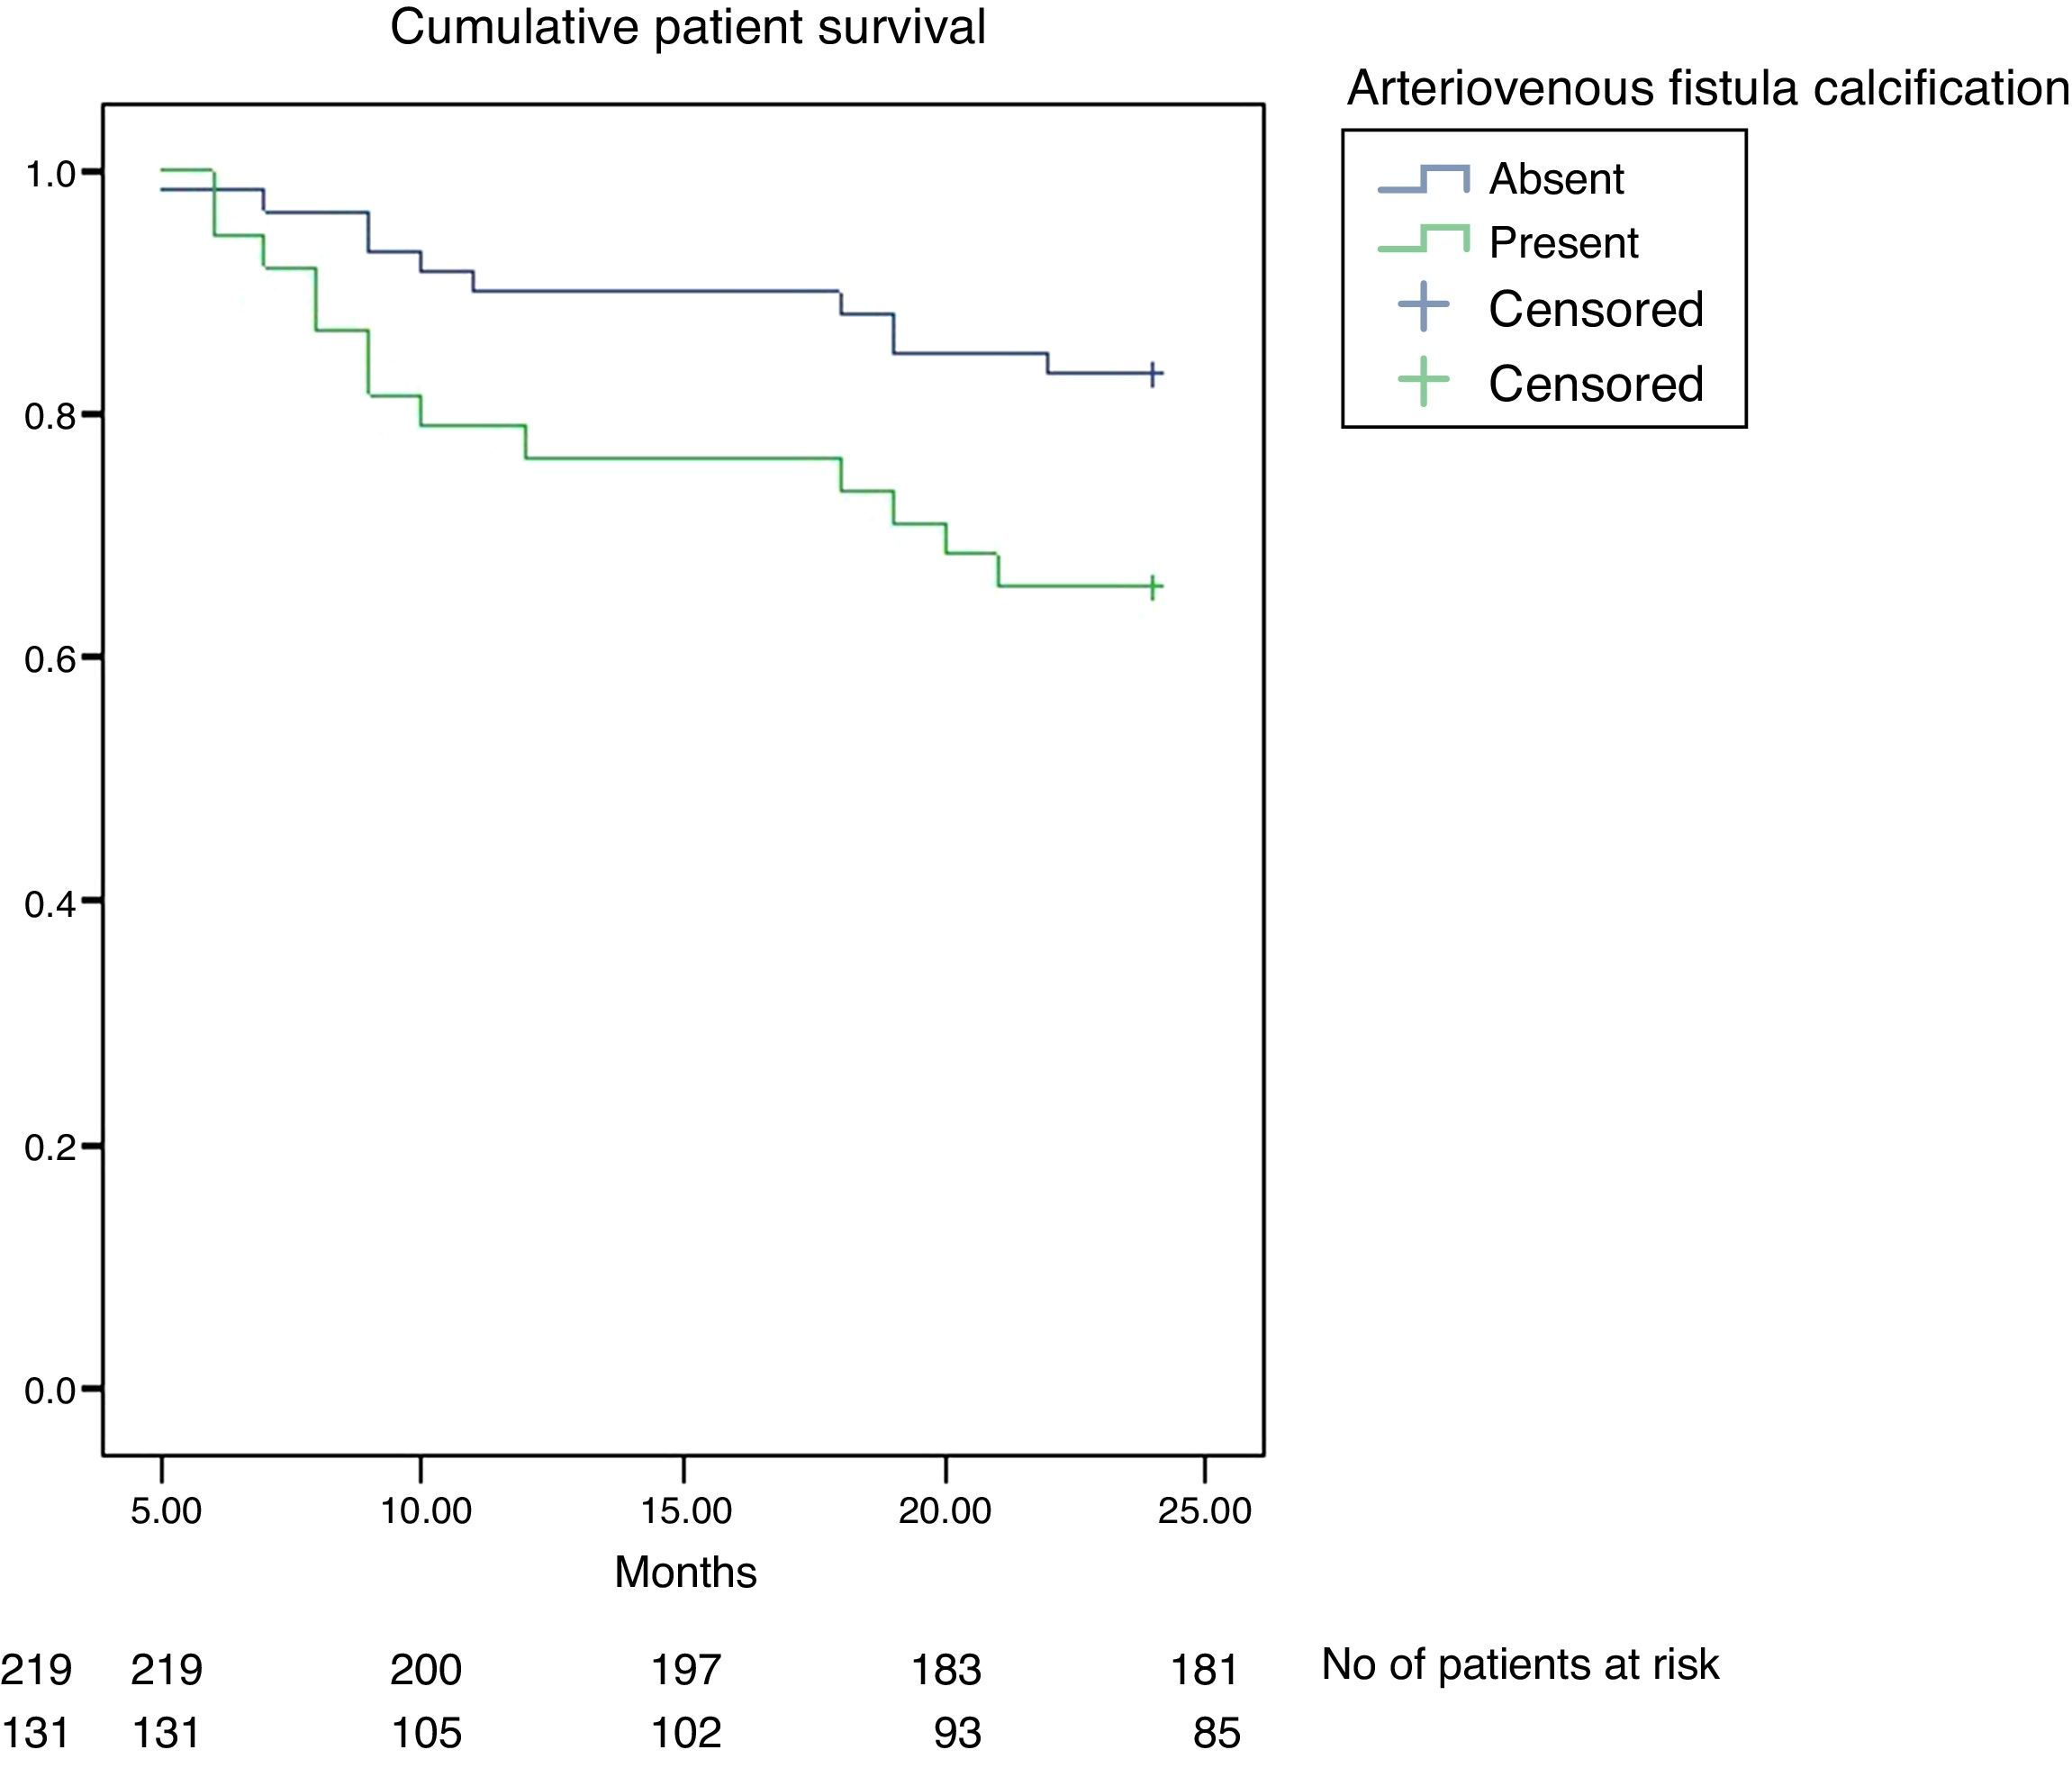
Overall, 84 of 350 patients (24%) died during the 24-months follow-up. When compared, patients who died were older (55.9±13 vs 55.9±13 years, p=0.022), had lower serum albumin (3.71±0.11 vs 3.9±0.34g/L, p=0.030) and 25-hydroxy vitamin D3 (11.2±5 vs 15.8±6ng/mL, p=0.010) and had higher serum alkaline phosphatase levels (132±28 vs 84±34U/L, p=0.03). Patients who died also had a tendency to have lower hemoglobin (11.20±1.20 vs 10.90±0.96g/dL, p=0.069) and log serum intact parathormone (2.01±0.11 vs 2.27±0.38, p=0.080). Gender, hemodialysis vintage, systolic and diastolic blood pressure, spKt/V, serum levels of calcium, phosphate, C-reactive protein, uric acid, LDL-cholesterol, HDL-cholesterol, triglycerides, cardiovascular history, presence of diabetes mellitus and treatment with calcium-based phosphate binders were not statistically different. However, patients who had arteriovenous fistula calcification did have worse survival than patients without (χ2=7.15; p=0.007, log-rank test, Fig. 2).
Serum sclerostin level and all-cause mortality
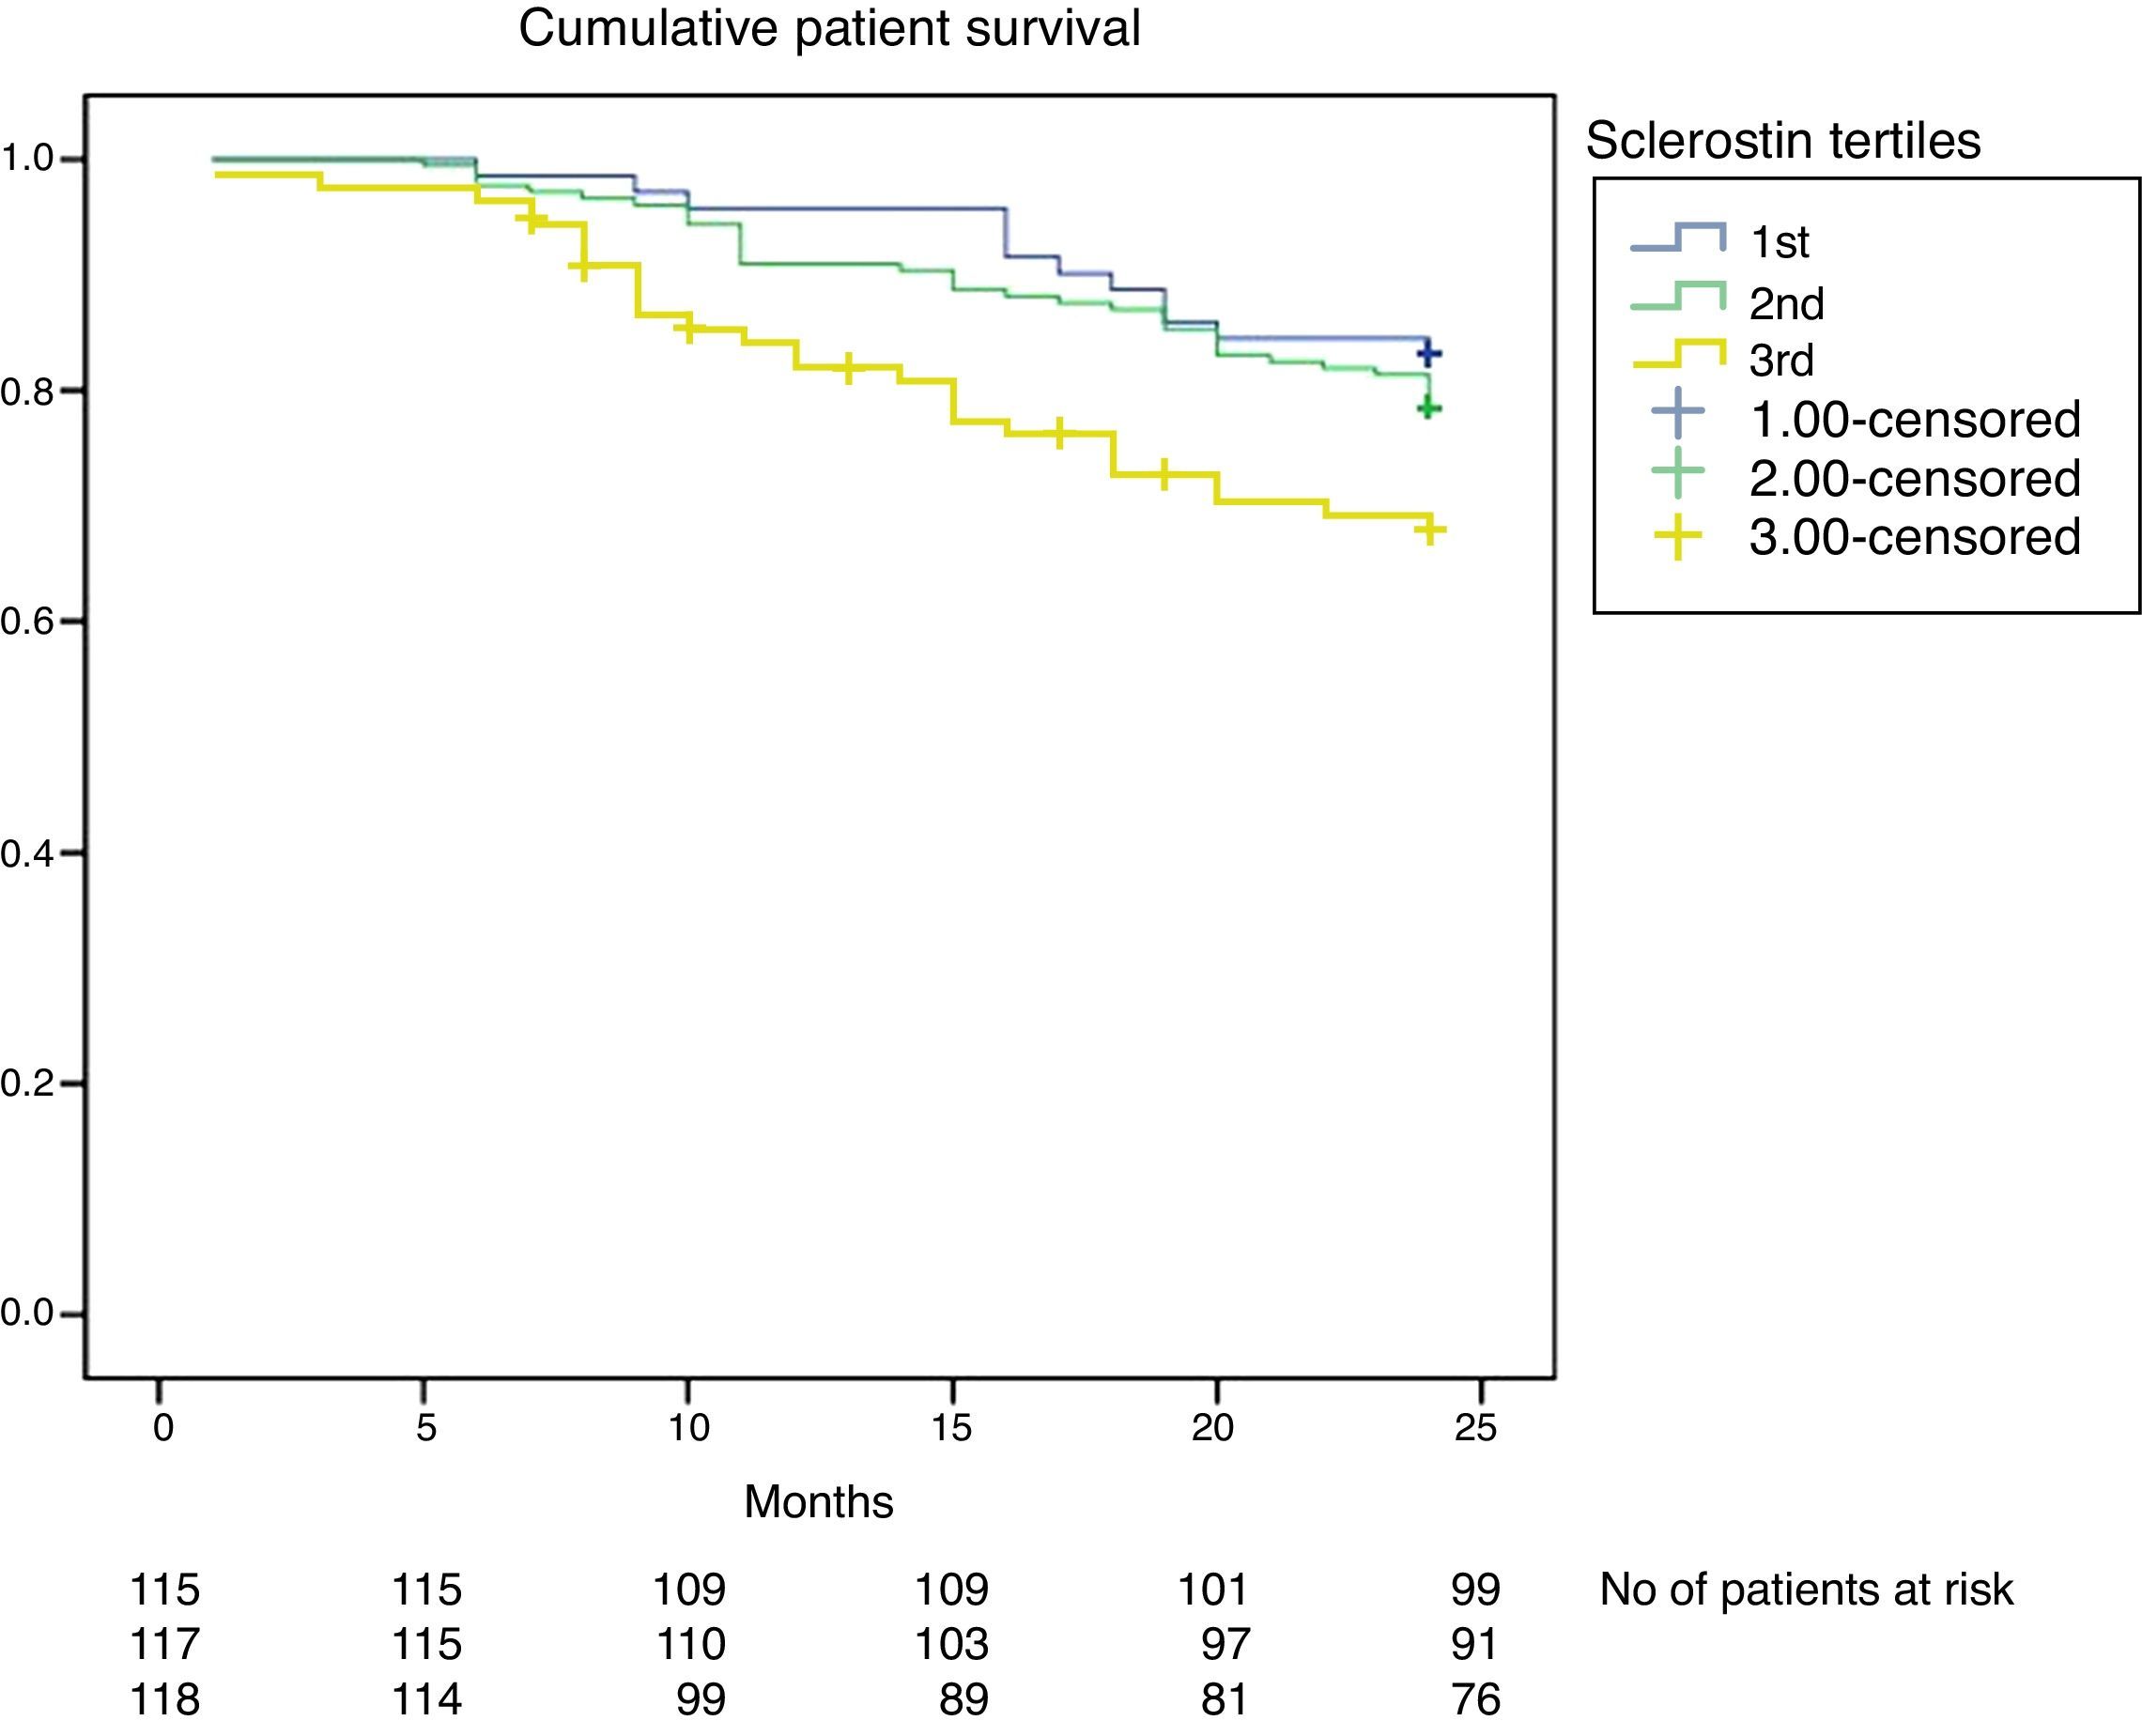
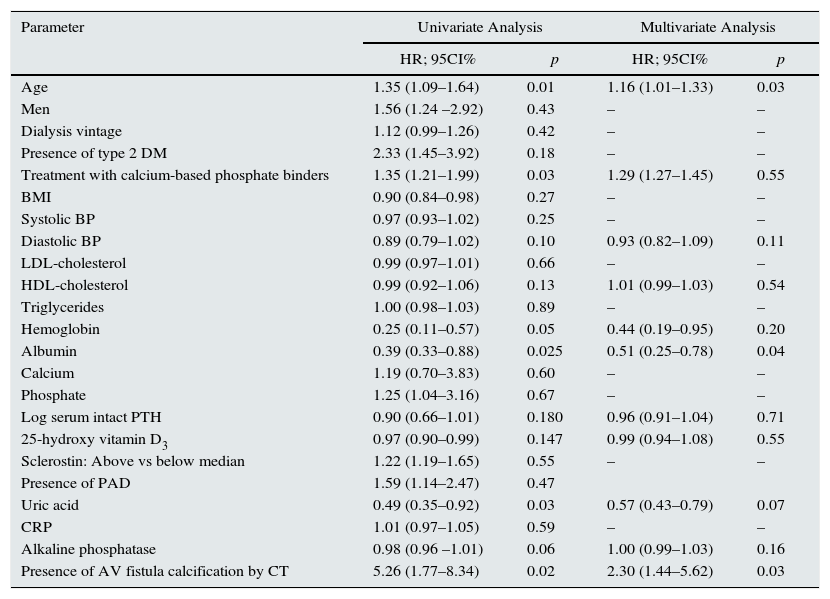
Patients who died had elevated serum sclerostin levels at baseline compared to patients who survived at the end of the 24-months follow-up (2143±1327 vs 1469±1373pg/ml; p=0.017). Kaplan–Meier curve shows that study patients with increasing serum sclerostin levels at baseline, had a worse survival (χ2=6.668; p=0.036, log-rank test, Fig. 3). Using the Cox proportional hazard model with multicovariate adjustments, age, albumin, and presence of arteriovenous fistula calcification were found to be associated with survival in maintenance hemodialysis patients (Table 3). Results were already corrected for calcitriol use and were unaffected when serum sclerostin level was considered as a continuous variable.

Univariate and multivariate logistic regression analysis for patient outcome.
| Parameter | Univariate Analysis | Multivariate Analysis | ||
|---|---|---|---|---|
| HR; 95CI% | p | HR; 95CI% | p | |
| Age | 1.35 (1.09–1.64) | 0.01 | 1.16 (1.01–1.33) | 0.03 |
| Men | 1.56 (1.24 –2.92) | 0.43 | – | – |
| Dialysis vintage | 1.12 (0.99–1.26) | 0.42 | – | – |
| Presence of type 2 DM | 2.33 (1.45–3.92) | 0.18 | – | – |
| Treatment with calcium-based phosphate binders | 1.35 (1.21–1.99) | 0.03 | 1.29 (1.27–1.45) | 0.55 |
| BMI | 0.90 (0.84–0.98) | 0.27 | – | – |
| Systolic BP | 0.97 (0.93–1.02) | 0.25 | – | – |
| Diastolic BP | 0.89 (0.79–1.02) | 0.10 | 0.93 (0.82–1.09) | 0.11 |
| LDL-cholesterol | 0.99 (0.97–1.01) | 0.66 | – | – |
| HDL-cholesterol | 0.99 (0.92–1.06) | 0.13 | 1.01 (0.99–1.03) | 0.54 |
| Triglycerides | 1.00 (0.98–1.03) | 0.89 | – | – |
| Hemoglobin | 0.25 (0.11–0.57) | 0.05 | 0.44 (0.19–0.95) | 0.20 |
| Albumin | 0.39 (0.33–0.88) | 0.025 | 0.51 (0.25–0.78) | 0.04 |
| Calcium | 1.19 (0.70–3.83) | 0.60 | – | – |
| Phosphate | 1.25 (1.04–3.16) | 0.67 | – | – |
| Log serum intact PTH | 0.90 (0.66–1.01) | 0.180 | 0.96 (0.91–1.04) | 0.71 |
| 25-hydroxy vitamin D3 | 0.97 (0.90–0.99) | 0.147 | 0.99 (0.94–1.08) | 0.55 |
| Sclerostin: Above vs below median | 1.22 (1.19–1.65) | 0.55 | – | – |
| Presence of PAD | 1.59 (1.14–2.47) | 0.47 | ||
| Uric acid | 0.49 (0.35–0.92) | 0.03 | 0.57 (0.43–0.79) | 0.07 |
| CRP | 1.01 (0.97–1.05) | 0.59 | – | – |
| Alkaline phosphatase | 0.98 (0.96 –1.01) | 0.06 | 1.00 (0.99–1.03) | 0.16 |
| Presence of AV fistula calcification by CT | 5.26 (1.77–8.34) | 0.02 | 2.30 (1.44–5.62) | 0.03 |
Abbreviations and definitions: DM: diabetes mellitus; BMI: body mass index; BP: blood pressure; Log iPTH: logarythm of serum intact parathyroid hormone; PAD: peripheral arterial disease; CRP: C-reactive protein; CT: computerized tomography.
Despite lower circulating sclerostin levels in patients who survived, serum sclerostin levels were not an independent predictor of survival in prevalent hemodialysis patients in this work. Furthermore age, albumin and presence of arteriovenous fistula calcification were found to be associated with survival in maintenance hemodialysis patients.
What could be the reason that sclerostin was chosen and studied as a candidate risk factor for mortality in prevalent hemodialysis patients? The osteocyte product sclerostin is emerging as an important paracrine regulator of bone metabolism. Sclerostin has been shown to play a key inhibitor role in bone formation and consequently protects against the deleterious effects of uncontrolled bone growth.13 Recently, serum sclerostin levels were shown to be associated with decreased bone turnover, osteoblast number, bone mineral density and microarchitecture in dialysis patients.7,11 Moreover, sclerostin has been demonstrated to be upregulated during vascular smooth muscle cell calcification in vitro.8 This in vitro data were confirmed by an in vivo mouse model of vascular calcification.14 Moreover, sclerostin has been demonstrated in human aortic extracts by a comprehensive analysis of extracellular space components comprising the vascular proteome.15 Additionally, recent evidence indicates that Wnt signaling is also involved in aortic valve calcification.16 More recent studies demonstrate association of serum sclerostin levels and different types of cardiovascular calcification17,18 and arterial stiffness.19
In the present work, patients who died in 24-months follow-up had significantly higher sclerostin levels at baseline and patients with increasing serum sclerostin levels had worse survival. These results were somewhat in contrast to recent publications. Firstly, Viaene et al. demonstrated a tendency to have a better survival with these sclerostin levels.20 In addition, NECOSAD trial revealed that patients in the highest sclerostin tertile had a significantly lower risk of cardiovascular death and for all-cause mortality within 18 months compared with patients of the lowest tertile.21 However, the authors stated that the association of sclerostin levels with outcome was less pronounced for long-term cardiovascular mortality and absent for noncardiovascular mortality.21 The present work and Viaene's study are comparable in a way that significances were lost in fully adjusted models including bone-specific alkaline phosphatase in Viaene's work20 and arteriovenous fistula calcification in the present work. In contrast, NECOSAD trial results showed an independent association with sclerostin and cardiovascular outcomes even after adjustments for alkaline phosphatase.21 However, more recently, Gonçalves et al. published their work regarding a hemodialysis patients’ cohort, which was followed during a ten-year period.22 They reported that high serum sclerostin levels were associated with cardiovascular mortality in prevalent dialysis patients, independent of diabetes and age, in a competing analysis approach, supporting the results of the present work.22 The reasons for the discrepancies between the three cohorts – including the present work, remain speculative. Use of different assays to measure serum sclerostin levels and statistical issues involving power might have significant contribution.21
Some potential mechanisms could be proposed to explain this variability. First, it might be speculated that, like in the bone, osteocyte-like cells in the vascular wall may produce sclerostin after they become embedded in mineralized matrix and might exhibit a negative feedback signal on osteoblasts.13 The final result might be a defensive response to block the Wnt pathway in order to reduce ossification and avoid further progression in whom vascular calcification is well established and severe,14,19 suggesting accompanying higher sclerostin levels in patients with more cardiovascular calcification burden17,18 that might contribute to overall mortality. In the present work, the finding of sclerostin levels as an independent determinant of arteriovenous fistula calcification supports this hypothesis (Table 2) and might explain the survival disadvantage in patients with high serum sclerostin levels, representing increased demands to mitigate further progression of vascular calcification. Significant correlation of peripheral serum and bone marrow plasma sclerostin levels23 suggests that sclerostin of bone or vascular tissue origin, may circulate in the blood and might play an important role in the cross talk between bone and the vessels.23 Second, study patients with sclerostin levels above median value had increased age, lower albumin levels, and more cardiovascular history which are described as strong mortality-predicting markers previously in patients with chronic kidney disease.24,25 Third, these patients also had increased frequency of arteriovenous fistula calcification that was one of the independent factors predicting survival in this work (Table 2). Similarly, a recent work reported association of vascular access calcification with increased mortality risk, and Cox regression analysis confirmed that vascular access calcification was an independent mortality predictor.26 This finding was well in agreement with previous studies reporting vascular calcification as a risk factor for mortality in patients with end stage renal disease.27–29 The increased levels of sclerostin concentrations in patients with arteriovenous fistula calcification than patients without, also suggests sclerostin as a part of a feedback loop targeting to impede advanced mineralization of calcifying vascular tissue.3,8
Calcification of the arteriovenous fistula does not always imply a poor function. The prevalence of arteriovenous fistula calcification detected by spiral CT was 40% in a Spanish study.30 The presence of calcifications in the arteriovenous fistula is related to the length of time the patient has been on hemodialysis and the duration of the arteriovenous fistula.30 The function of a well-developed arteriovenous fistula with no stenosis and suitable for chronic hemodialysis is not affected by the presence of calcifications that are diagnosed by spiral CT.30
Limitations of the present work include relatively small sample size and short term follow-up. Furthermore, serum sclerostin level may change over time in dialysis patients, and sclerostin concentration was used at only a single time in the outcome analysis. This factor decreases the potential predictive power of individual serum level. Our data confirm the previous study by Viaene et al.20 that serum sclerostin level was not an independent predictor of mortality in maintenance hemodialysis patients. However, study data need confirmation with further clinical studies with longer follow-up and more participants. Additionally, data regarding bone histomorphometry was unfortunately unavailable and we were not able to establish the link among sclerostin, histologic bone parameters and vascular calcification (arteriovenous fistula in this case).
In conclusion, growing evidence implicate that sclerostin might be an important element in the vascular calcification and bone metabolism in patients with chronic kidney disease. Additional investigations are needed to elucidate whether changes in sclerostin levels also translate into clinical parameters affecting morbidity and mortality in patients on maintenance hemodialysis.
Conflict of interestsThe authors declare that they have no relevant financial interests.
We would like to thank to Fahri Mandiroglu, MD, both the owner and responsible practitioner of RFM Renal Treatment Services.


