
Introducción: Los niveles en sangre de 25-hidroxi-vitamina D (25-OH-vitD) se relacionan con múltiples patologías. Acordes al riesgo cardiovascular, se han definido los valores considerados «normales» y con ese dintel los pacientes con enfermedad renal crónica tienen muy frecuentemente déficit de dicha vitamina. Su reposición en hemodiálisis (HD), con dosis todavía no claramente establecidas, comienza a ser una constante en la práctica habitual. Objetivo: Valorar si la técnica de diálisis influye en la concentración basal de 25-OH-vitD y en la respuesta a su suplementación. Métodos: Estudio observacional prospectivo de dos cohortes de pacientes tratados y no tratados con calcifediol. Se determinaron Ca, P, hormona paratiroidea (PTH) y 25-OH-vitD en 59 pacientes prevalentes en HD (35 eran varones; edad media: 65,2 [15,7] años) en noviembre de 2010. De ellos, 36 pacientes (con 25-OH-vitD < 10 ng/ml) se trataron con calcifediol semanal (Hidroferol®, 1 ampolla: 266 µg) administrado pos-HD por una enfermera a partir de enero de 2011. Recibieron 6 dosis y se determinaron de nuevo los niveles en marzo. Se comparó la respuesta en función de la técnica de HD. Los 22 restantes no fueron tratados y se consideran como un grupo control. Resultados: Medias basales (n = 59): 25-OH-vitD: 9,8 (7,0) ng/ml; Ca: 9,3 (0,5) mg/dl; P: 4,5 (1,4) mg/dl, y PTH intacta: 299 (224) pg/ml. No existían diferencias por edad, sexo, ni técnica (HD vs. hemodiafiltración en línea [HDF-OL]). Tratados (n = 36): Los niveles de 25-OH-vitD pasaron de 6,2 (3,4) a 51 (22,9) ng/ml, p < 0,0001, sin cambios significativos en el Ca. La fosfatemia se incrementó como media en 0,6 (1,4) mg/dl, de 4,4 a 5 mg/dl, (p = 0,015). La PTH disminuyó como media en 85 (208) pg/ml, p = 0,023. En estos pacientes la indicación de captores del P se incrementó en una dosis media equivalente de 0,47 (0,82), p < 0,001. Los 13 pacientes en tratamiento con HDF-OL alcanzaron unos niveles de 25-OH-vitD significativamente mayores que los 23 tratados con HD: 63 (21) vs. 43 (21) ng/ml, p = 0,011. El tratamiento doble con vitamina D nativa y activa se asoció de forma significativa al aumento de los niveles de P, p = 0,043. No tratados (n = 23): Los niveles de 25-OH-vitD bajaron de 15,3 (7,5) en noviembre a 11,1 (6,8) ng/ml en marzo, p < 0,01, sin cambios significativos en el P ni la PTH y sin que encontráramos diferencias según la edad. La disminución se produjo en los pacientes en HD, n = 15, y no en los que estaban en HDF-OL, n = 8. Comentario: Los niveles séricos basales de 25-OH-vitD en pacientes en HD son bajos o muy bajos. La respuesta al tratamiento con calcifediol es buena, más marcada en los pacientes en HDF-OL; mientras, en los pacientes no tratados los niveles bajan probablemente en relación con el período invernal. Algunos pacientes incrementan la fosfatemia a pesar de aumentar la cantidad de captores de P, fundamentalmente aquellos que estaban en tratamiento con vitamina D activa.
Introduction: 25-hydroxy vitamin D (25-OH-vit D) levels in the blood are associated with multiple pathologies. "Normal" values have been defined based on cardiovascular risk, and under this framework, patients with chronic kidney disease often have a deficit. 25-OH-vit D replacement in patients on haemodialysis (HD), in which dosage has not yet been clearly established, is becoming a constant in our daily practice. Objective: To assess whether dialysis technique influences the baseline concentration of 25-OH-vitamin D and the response to supplements. Method: Prospective observational study of two cohorts of patients, those patients treated with calcifediol and those untreated (controls). Blood levels of Ca, P, PTH, and 25-OH-vit D were measured in 59 prevalent patients on HD (35 male; mean age: 65.2 (15.7) years) in November 2010. Thirty-six patients with 25-OH-vit D<10ng/ml were treated with weekly calcifediol (Hidroferol®, 1 ampoule: 266µg) since January 2011, which was administered after HD by a nurse. They received 6 doses, and blood levels were measured again in March 2011. We compared the response based on the technique of HD (online haemodiafiltration [OL-HDF] vs HD). Results: Mean baseline values (n=59): 25-OH-vit D: 9.8 (7.0)ng/ml, Ca: 9.3 (0.5)mg/dl, P: 4.5 (1.4)mg/dl, and iPTH: 299 (224)pg/ml. There were no differences by age, sex, or dialysis technique (HD vs OL-HDF). Treated patients (n=36): 25-OH-vit D levels rose from 6.2 (3.4)ng/ml to 51 (22.9)ng/ml (P<.0001), without significant changes in Ca. Serum phosphate increased an average of 0.6 (1.4)mg/dl, from 4.4mg/dl to 5mg/dl, (P=.015). PTH decreased an average of 85 (208)pg/ml (P=.023). In these patients, the indication for phosphate binders increased by an average dose equivalent of 0.47 (0.82)mg/dl (P<.001). The 13 patients under treatment with OL-HDF reached 25-OH-vit D levels significantly higher than the 23 treated on HD: 63 (21)ng/ml vs 43 (21)ng/ml (P=.011). Dual treatment with native and active Vit D was associated with significantly increased levels of P (P=.043). Untreated patients (n=23): 25-OH-vit D levels decreased from 15.3 (7.5)ng/ml in November to 11.1 (6.8)ng/ml in March (P<.01), without significant changes in P or PTH and without differences according to age. 25-OH-vit D levels declined in patients on HD (15) but not in patients on OL-HDF. Conclusion: The patients on haemodialysis have low or very low baseline values for 25-OH-vit D. The response to treatment with calcifediol is good, with the most marked improvement occurring in patients on OL-HDF. Furthermore, 25-OH-vit D levels decreased in untreated patients, which was probably correlated with the lower sun exposure in winter. Some patients experienced an increase in phosphataemia despite increasing the dosage of phosphate binders, mainly in those receiving treatment with active vitamin D.
INTRODUCTION
Vitamin D deficit affects several different biological functions in the body, in addition to the classically described effects, all of which are associated with cardiovascular mortality and morbidity in patients with chronic kidney disease (CKD).1-3 Vitamin D deficiency is associated with albuminuria, hypertension, insulin resistance, diabetes, and dyslipidaemia, while vitamin D supplements (ergocalciferol and cholecalciferol) reduce mortality in institutionalised elderly patients. Vitamin D is believed to have beneficial effects due to its anti-inflammatory and anti-proliferative activity, as well as its regulatory action on endothelial dysfunction.
These effects have raised much interest in the use of different types of vitamin D, mainly 25-hydroxy vitamin D (25-OH-vit D), although there is confusion regarding the definition of normal levels, criteria for use, dosage, and secondary side effects. We must keep in mind that, despite the fact that serum concentrations of 25-OH-vit D are considered to be the best method for assessing vitamin D deposits in the body, there is no consensus in the medical community regarding the range of normal values. In fact, reference ranges are usually based on population studies, and so normal levels can vary according to the intake of vitamin D in the region and exposure to sunlight according to latitude. Another alternative for defining normal values is to use vitamin D levels at concentrations below which adverse effects on calcium-phosphorus metabolism appear. For example, during the last century, osteomalacia-rickets was shown to develop at concentrations <10ng/ml.4 According to the latest S.E.N. guidelines,5 vitamin D deficiency or insufficiency should be treated following the strategies recommended for the general population, vitamin D “insufficiency” is defined as serum calcidiol levels <30ng/ml, and vitamin D “deficiency” is defined as serum calcidiol levels <15ng/ml. No studies have shown in the general population that values >40ng/ml provide any benefit.1 Thus, we could conclude that, although it is not explicitly defined as such, the desired values range between 30ng/ml and 50ng/ml.
Despite these limitations for the definition of normality, according to the parameters we use more than 70% of the general population has a 25-OH-vit D deficiency,4 which is even higher in patients with CKD.6-8
Using these parameters and considering the beneficial effects it may have, treatment with native vitamin D, usually in the form of calcifediol, has become common practice in all CKD patients. All nephrologists have experience in treating patients with high and low doses of active vitamin D, mainly in the form of calcitriol, in an attempt to control secondary hyperparathyroidism. The experience with this type of treatment has not been completely positive due to a high frequency of hypercalcaemia and hyperphosphataemia and associated vascular calcification, since these conditions are all associated with increased mortality in CKD patients. Meta-analyses of the relationship between treatment with vitamin D and cardiovascular events9-11 have shown negative and at times doubtful results, which is in large part due to the low quality of many studies carried out. The available results conclude that calcifediol supplements improve 25-OH-vit D and 1-25-OH-vit D levels and reduce parathyroid hormone (PTH) levels, without significantly increasing the risk of hypercalcaemia or hyperphosphataemia. However, this type of treatment does not improve cardiovascular or skeletal prognoses.9
Currently, nephrologists are starting to treat haemodialysis (HD) patients with calcifediol in a completely empirical manner, attempting to define appropriate doses, the secondary side effects that may be encountered, and the effects of the type of dialysis provided, since one study showed that differences can exist between on-line haemodiafiltration (OL-HDF) and post-dilution on-line haemodiafiltration (OL-P-HDF).12
With this in mind, we provided treatment with calcifediol to patients on HD with severe 25-OH-vit D deficiency (<10ng/ml).
OBJECTIVES
1. To evaluate response to treatment with calcifediol in patients on HD with a severe 25-OH-vit D deficiency by measuring blood levels of 25-OH-vit D, PTH, total Ca (tCa), and P.
2. To assess whether the type of dialysis influenced baseline concentrations of 25-OH-vit D and the response to supplements.
3. To evaluate 25-OH-vit D levels with another treatment regimen using calcifediol.
METHOD
Study design: Ours was a prospective observational study involving two different cohorts of patients. We compared the results/variables at three different cut-off points in the evolution of these patients.
All prevalent patients in the haemodialysis unit of our hospital were considered valid for measuring baseline 25-OH-vit D levels.
Of the 65 patients recruited for the study, we excluded 6 that had incomplete medical follow-up records between November 2010 and March 2011 or had a concurrent disease that impeded completing the treatment protocol. Of the 59 patients included, 36 required calcifediol treatment because of a severe 25-OH-vit D deficiency (<10ng/ml). The remaining 23 patients were not treated, and this was the second cohort, which was used as the control group. In the second phase of the study (March-June 2011), all 59 patients were treated with a second dosage of calcifediol.
Patient characteristics: Our study sample included 35 males and 24 females with a mean age of 65.2 (15.7) years. Fifteen patients were diabetic, and mean body mass index (BMI) was 26.8 (5.3)kg/m2 (range: 17.8-43.4kg/m2). All patients were Caucasians. The mean duration of renal replacement therapy prior to the start of the study in the overall group of 59 patients was 5.5 (6.3) years.
Characteristics of the haemodialysis treatment: All patients received treatment with high-flux dialysers and synthetic membranes. Dialysis sessions lasted 4 hours or more, except for patients that had a residual renal function >5ml/min of creatinine clearance. Twenty-one patients received post-dilution OL-HDF, with more than 20 litres infused per session. The mean eKt/V for all dialysis sessions was 1.85 (0.46) (range: 0.97-2.98). All haemodialysis devices used ultrapure dialysate fluid. In general, the calcium concentration in the dialysate was 1.5mmol/l.
Concomitant treatment for mineral metabolism: In the haemodialysis unit, patient status was maintained within the bone mineral metabolism levels established by the bone mineral metabolism guidelines of the S.E.N.5 Patients received phosphate binders in order to maintain serum phosphorus levels below 5mg/dl. Cinacalcet was also used to control secondary hyperparathyroidism in cases of difficulty managing Ca and P.
Baseline values: Ca, P, intact PTH (iPTH) and 25-OH-vit D levels were measured in 59 prevalent HD patients in November 2010.
Treated patients: Calcifediol (Hidroferol®, 1 ampoule: 266µg) was administered by a nurse following HD sessions in 36 patients with severe 25-OH-vit D deficiency since January 2011. Patients received a total of 6 doses, and levels were measured again in March. We compared the response to treatment based on the type of dialysis administered: HD vs OL-HDF.
Untreated patients: The 23 patients that did not receive calcifediol treatment constituted the control group.
Follow-up of second treatment: Patients were evaluated again in June 2011, when the 59 patients were started on a new treatment protocol with calcifediol. We analysed the results from the 54 patients with complete medical histories between November 2010 and March and June 2011.
Starting in March 2011, the following treatment protocol was applied to all patients.
25-OH-Vit D supplement protocol on dialysis patients
Objective: To maintain blood concentrations of 25-OH-vit D between 20ng/ml and 50ng/ml in all patients.
Control examinations: 25-OH-vit D measurements:
- In all patients when starting HD.
- Standard three-monthly visits.
Corrective doses: (all with ampoules of Hidroferol®, 266μg), evaluation every 3 months.
- If levels <10ng/ml: 1 ampoule/2 weeks (6 doses in 3 months).
- If levels =10-30ng/ml: 1 ampoule/month (3 doses in 3 months).
- If levels =30-50ng/ml: 1 ampoule/6 weeks (2 doses in 3 months).
- If levels >50ng/ml: suspend supplements and re-evaluate at next visit.
Red flags
1. In all patients treated with Hidroferol®, Ca and P were evaluated every month.
2. If the patient had hypercalcaemia (Ca>9.5mg/dl) or hyperphosphataemia (P>6mg/dl), Hidroferol® was suspended temporarily.
3. The above was especially taken into account in patients being treated with active vitamin D (calcitriol or paricalcitol).
4. Currently, the usefulness of concomitant treatment with calcitriol is debatable.
5. When interpreting the results, seasonal variation in sunlight was taken into account.
Laboratory analyses
We measured 25-OH-vit D by immuno-chemiluminescence assay (DiaSorin LIAISON®), using a reference value of 8.6-54.8ng/ml. Inter-assay and intra-assay variation were 8% and 5%, respectively.
iPTH was measured using chemiluminometric technology (Advia Centaur PTH, Bayer); reference values were 10-65pg/ml.
Informed consent
We obtained informed consent for data analysis from each patient registered in the Therapy Manager Extended® CE (TME) program. TME is a nephrological database management system specialised for the integrated clinical management of CKD and related pathologies.
Statistical analysis
We evaluated normality of each variable using the Kolmogorov-Smirnov test. These variables are expressed as mean and standard deviation in parentheses. We also present ranges when appropriate. Variables that did not follow a normal distribution are expressed as median and interquartile range.
We compared independent samples means using Student’s t-tests or Mann-Whitney U tests, as appropriate. We used Friedman’s test to compare continuous or repeated variables. Categorical variables were compared using chi-square tests. We considered a P-value <.05 to be statistically significant.
All statistical analyses were performed using SPSS statistical software version 15 (SPSS Inc., Chicago, IL), with Spanish settings and the approved methods for data protection.
RESULTS
For the 59 patients included in the first phase of treatment (November 2010/ March 2011), the results were the following:
Baseline (mean and standard deviation) (n=59)
Baseline blood values were: 25-OH-vit D, 9.8 (7.0)ng/ml; Ca, 9.3 (0.5)mg/dl; P, 4.5 (1.4)mg/dl; and iPTH, 299 (224)pg/ml.
Although 25-OH-vit D levels decreased with age, this relationship was not significant (P=.07). There were no differences in terms of 25-OH-vit D according to sex or type of dialysis treatment (HD vs OL-HDF).
Of the 59 patients, 13 were on treatment with cinacalcet, 18 with active vitamin D, 11 with calcitriol, and 7 with paricalcitol.
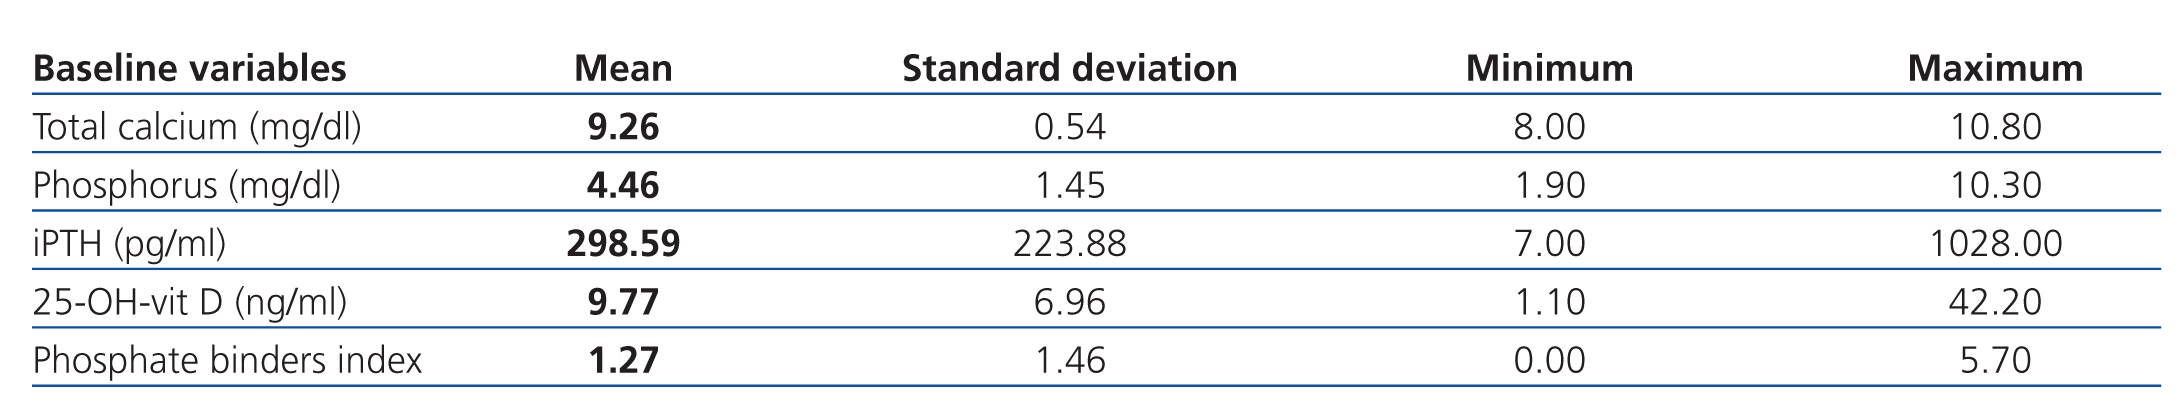
In addition, 39 of the 59 patients received phosphate binders, at times more than one (calcium carbonate, calcium acetate, aluminium hydroxide, sevelamer, lanthanum carbonate, and magnesium carbonate). The equivalent dosage to 1g of calcium carbonate13 in terms of phosphate binding capacity was 1.23 (1.46) (Table 1).
Treated patients (n=36)
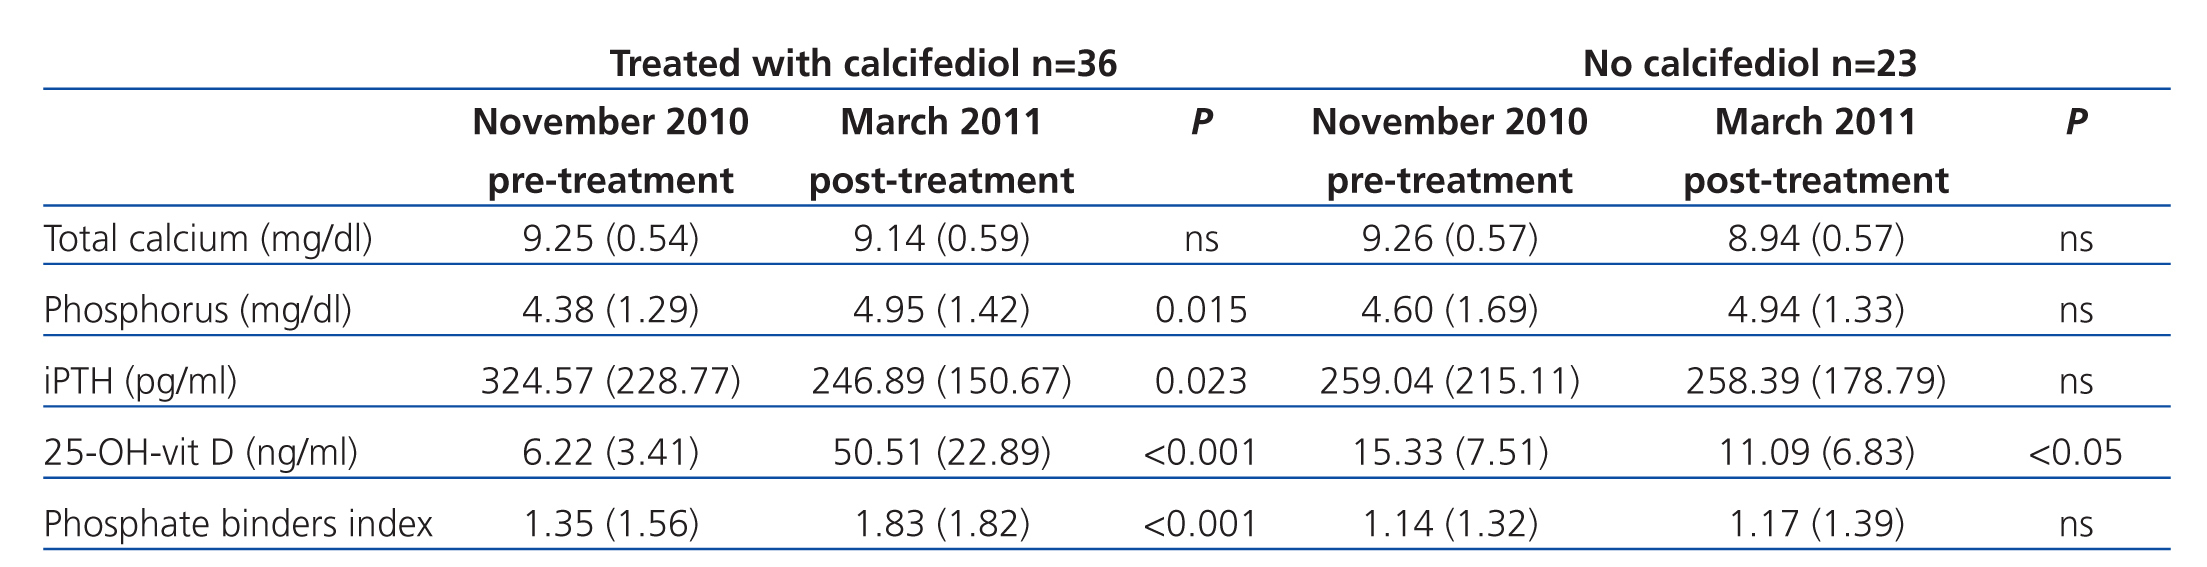
Mean 25-OH-vit D levels increased from 6.2 (3.4)ng/ml to 51 (22.9)ng/ml (P<.0001), with no significant changes observed in Ca concentrations. Phosphataemia increased by a mean 0.6 (1.4)mg/dl, from 4.4m/dl to 5.0mg/dl (P=.015). PTH decreased by a mean of 85 (208)pg/ml (P=.023) (Table 2).
In this group, the indications for phosphate binders increased by a mean equivalent dose of 0.47 (0.82) (P<.001).13
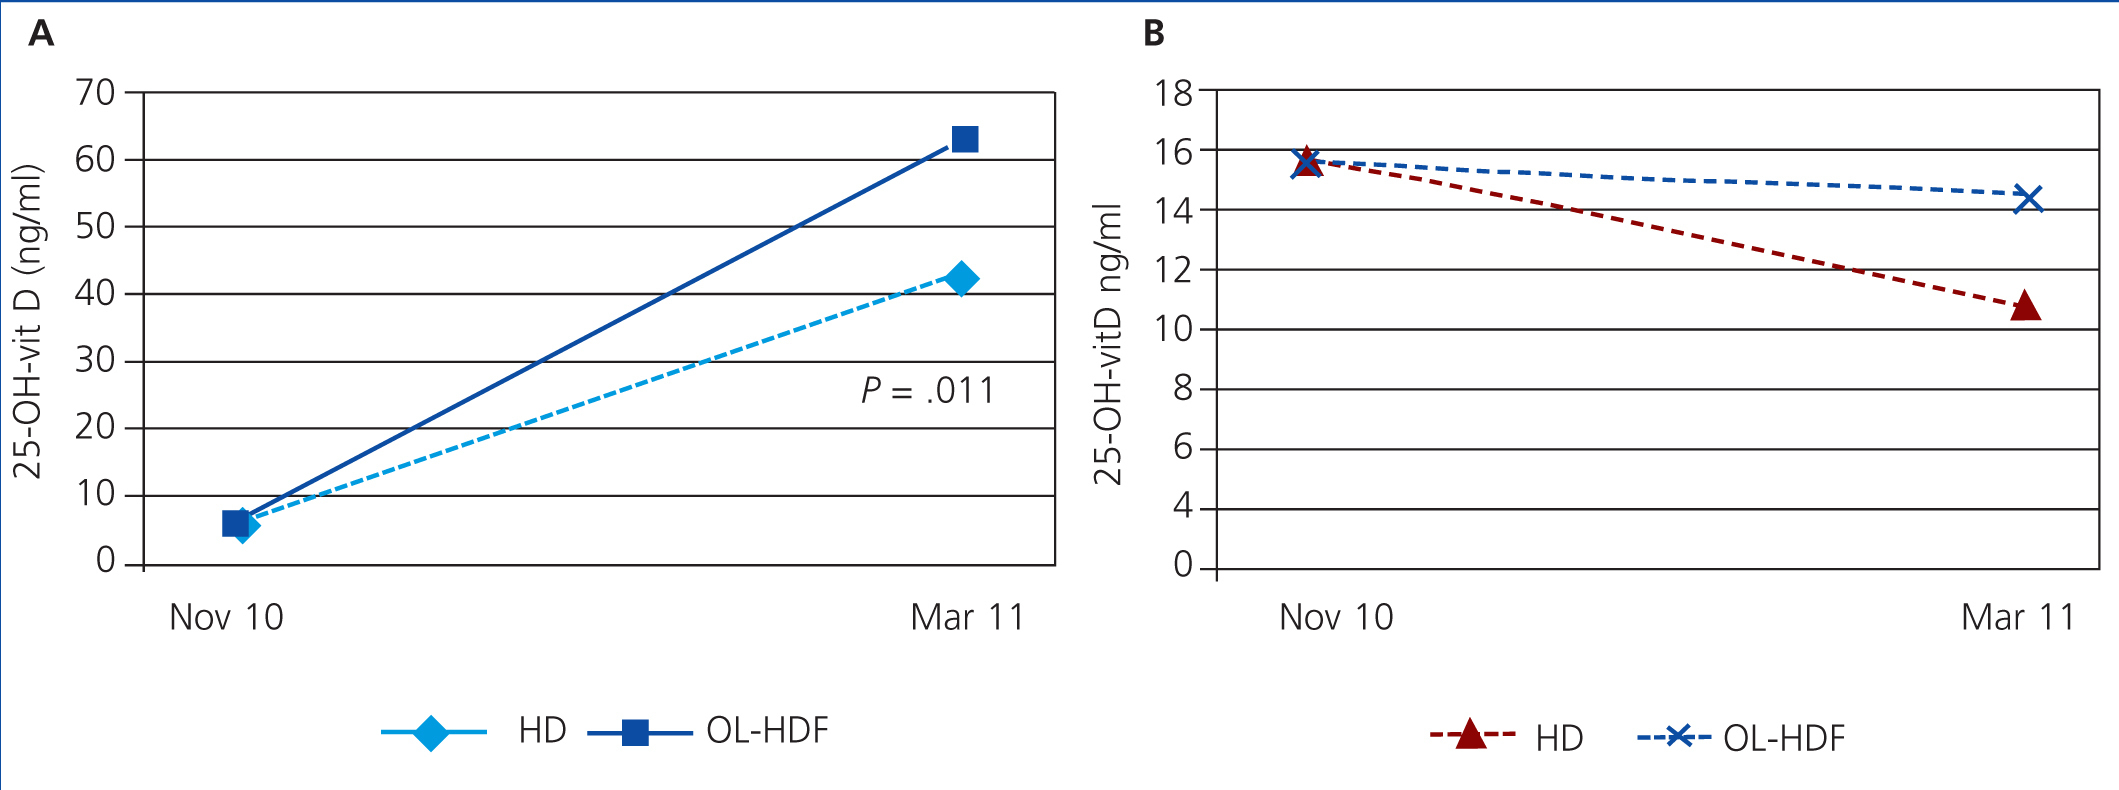
The 13 patients on OL-HDF reached significantly higher 25-OH-vit D levels than the 23 patients treated with HD: 63 (21)ng/ml vs 43 (21)ng/ml; P=.011. In OL-HDF patients, the mean increase in 25-OH-vit D levels was 33.9 (7.4)ng/ml, whereas the mean increase in patients on HD was 19.7 (26.7)ng/ml (Figure 1A and Figure 1B). The time on dialysis treatment prior to inclusion in the study was not significantly different between HD (5.2 years) and OL-HDF (6 years) patients. Patients on HD were on average older than those on OL-HDF by a mean of 6 years (P=.103).
Of the 36 patients receiving treatment, 9 received cinacalcet in November, and this number increased to 11 in March. Eleven patients received active vitamin D treatment both in November and March.
Dual treatment with native and active vitamin D was significantly correlated with increased P levels in March, but not in June (P=.043).
Untreated patients (n=23)
Mean levels of 25-OH-vit D decreased from 15.3 (7.5)ng/ml in November to 11.1 (6.8)ng/ml in March (P<.01), with no significant changes in P or PTH, and with no differences observed based on age. In the 15 patients on HD, 25-OH-vit D levels decreased from 15.4 (9.1)ng/ml to 9.7 (7.3)ng/ml (P=.001). In the 8 patients on OL-HDF, the decrease was milder, from 15.2 (3.2)ng/ml to 13.7 (5.2)ng/ml, and not significant (P=.529).
In March, 25-OH-vit D levels differed between treated and untreated patients, but Ca, P, and PTH levels did not (Figure 1A and Figure 1B).
Evolution after implementation of the new treatment protocol (n=54)
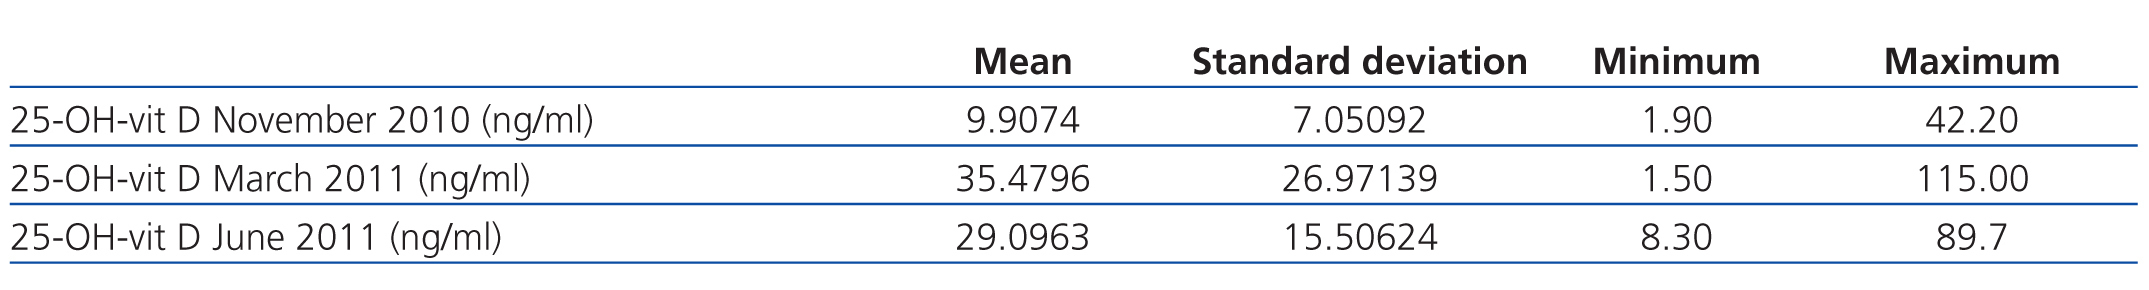
Between November 2010 and June 2011, we monitored the progression of 54 patients. Table 3 summarises the results. With the change of treatment, we observed a decrease in mean levels from March to June, but there continued to be patients with both high and low levels.
DISCUSSION
Baseline 25-OH-vit D levels in our study were low or very low, which often occurs in CKD patients and even in the general population. Only one patient had more than 30ng/ml. Which factors contribute to 25-OH-vit D levels and vitamin D balance? The roles of sun exposure and provitamin D intake through diet and supplements have been well established.14 Other cofactors, such as obesity and skin colour, also influence 25-OH-vit D levels. Variations in genes near those involved in cholesterol synthesis (DHCR7), hydroxylation (CYP2R1, CYP24A1), and vitamin D transport also play important roles.15 Some variants of these loci identify individuals at a high risk of vitamin D deficiency. CKD patients have low levels due to P retention and increased FGF23 and PTH. In addition to reducing the synthesis of 1-25-OH-vit D, one or more of these processes probably increases the metabolism of 25-OH-vit D and 1-25-OH-vit D through 24 hydroxylase.
Although 25-OH-vit D values are low compared to normal levels, we have yet to properly establish target values in patients with CKD on HD, as the use of reference values from other populations probably would not work. We still do not fully understand the relationship between 25-OH-vit D and the appearance of different pathologies in the general population. In Europeans, 25-OH-vit D levels are higher in Nordic countries and the Mediterranean ones.16 However, in these same countries we can find a greater level of solar exposure and a lower incidence of cardiovascular events and risk. In order to determine target 25-OH-vit D levels, we need to perform more studies in the CKD patients on dialysis that establish the ranges associated with potential benefits and prevent complications.
With regard to the general population, there is still a dilemma whether or not to systematically treat patients with vitamin D and whether measuring 25-OH-vit D levels is useful or not.17 Vitamin D intoxication is a well established phenomenon, causing renal colic, vascular complications, and even renal failure due to nephrocalcinosis. These situations generally arise when intensive treatments, with 25-OH-vit D levels >200µg/l.
Calcifediol treatment significantly increased blood levels of 25-OH-vit D in patients on HD. Furthermore, levels decrease in untreated patients, which was probably correlated with the lower sun exposure in winter. We need to find doses and methods of administration that maintain levels within desired ranges. In June 2011, despite reducing the dosage, we continued to observe patients with 25-OH-vit D levels outside the target range; treatment should probably be set on an individual basis, taking into account the time of year.
Increased availability of 25-OH-vit D has been shown to increase 1-25-OH-vit D levels. This increase inhibits PTH and intestinal absorption of Ca and P, which in our case mean a significant increase in phosphataemia despite the increased use of phosphate binders. In our study, hyperphosphataemia was more frequent in patients treated with calcifediol than in those treated with active forms of vitamin D, calcitriol or paricalcitol. This demonstrates a need to control phosphataemia when using these drugs, especially when using active vitamin D metabolites. The use of calcitriol should probably be reduced in these patients. The presumed benefits of normalising/increasing 25-OH-vit D levels could be counteracted by increased phosphataemia or risk of vascular calcification. Patients with CKD cannot eliminate increased Ca and P intake as a person without renal failure can do. This issue determines a non-selective treatment with vitamin D of CKD patients. On the other hand, we must take into account the economic impact of vitamin D treatment in CKD patients, which is much higher with active vitamin D forms than native ones.18 This should provide the motivation for a comparison between these drugs in this type of patients.
In our experience, baseline levels were not different between patients on HD and those on OL-HDF, as has been observed in another study.12 In our case, the population on OL-HDF was not comparable to that on HD; among other differences, the former were younger. However, we did observe a better response to treatment in patients on OL-HDF. This cannot be explained by sun exposure, race, obesity, or diet. One possible hypothesis is that OL-HDF eliminates the molecules involved in the stimulation of 24 hydroxylase (CYP24A1).19 We also observed a lower decrease of vitamin D levels in winter in OL-HDF patients that went untreated as compared to those on HD.
In conclusion, OL-HDF patients had a better response to treatment with calcidiol, and concentrations varied by season, necessitating a personalised treatment regimen that we have yet to define.
Conflicts of interest
The authors affirm that they have no conflicts of interest related to the content of this article.

Table 1. Baseline phosphate binder values and laboratory results for all 59 patients in November 2010

Table 2. Blood level values in November 2010 (pre-treatment) and in March 2011 (post-treatment) for 36 patients that received 25-OH-vit D and 23 untreated controls

Table 3. Evolution of 25-OH-vit D levels in measurements taken in November, March, and June. Change in levels according to two different treatment regimens

Figure 1A. Response to calcifediol according to dialysis technique administered

Figure 1B. Response to calcifediol according to dialysis technique administered


