Parathormone plays a key role in controlling mineral metabolism. PTH is considered a uremic toxin causing cardiovascular damage and cardiovascular mortality in dialysis patients. There are two different assays to measure PTH called 2nd generation or intact PTH (iPTH) and 3rd generation or bioPTH (PTHbio).
ObjectiveTo evaluate the differences in mortality of dialysis patients between both assays to measure PTH, as well as the possible prognostic role of the PTHbio/iPTH ratio.
Methods145 haemodialysis patients were included with 2-year monitoring including baseline laboratory test and annually thereafter.
Results21 patients died in the first year and 28 in the second. No correlation was found between PTH, PTHbio and PTHbio/iPTH ratio with mortality. Both PTH have a perfect correlation between them and correlate similarly with other molecules of the mineral metabolism. The extreme baseline values of PTH are those of higher mortality. In survival by iPTH intervals (according to guidelines and COSMOS study), a J curve is observed. When iPTH increases, the ratio decreases, possibly when increasing fragments no. 1–84. There is no greater prognostic approximation on mortality with PTHbio than PTHi. There was also no difference in mortality when progression ratio PTHbio/PTHi was analysed.
ConclusionsWe didn’t find any advantages to using bioPTH vs. PTHi as a marker of mortality. BioPTH limits of normality must be reevaluated because its relationship with iPTH is not consistent. Not knowing these limits affects its prognostic value.
La paratohormona tiene un papel fundamental en el control del metabolismo mineral. Además es considerada como una toxina urémica al originar daño cardiovascular e influir en la mortalidad cardiovascular del paciente en diálisis. Existen dos métodos de medición denominados de 2.ª generación o PTH intacta (PTHi) y de 3.ª generación o bioPTH (PTHbio).
ObjetivoEvaluar las diferencias en la mortalidad del paciente en diálisis entre ambas formas de medición de PTH, así como el posible papel pronóstico de su cociente.
MétodosSe incluyeron 145 pacientes en hemodiálisis con un seguimiento de 2 años con determinación analítica basal y posteriormente de forma anual.
ResultadosVeintiún pacientes fallecieron el primer año y 28 el segundo. No se encontró correlación entre PTHi, PTHbio y cociente PTHbio/PTHi con la mortalidad. Ambas PTH tienen una buena correlación entre ellas y correlacionan de manera similar con otras moléculas del metabolismo mineral. Los valores basales de PTH extremos son los de mayor mortalidad. En la supervivencia por tramos de PTHi (según guías y estudio COSMOS) se observa una curva en J. A mayor aumento de PTHi el cociente desciende, posiblemente al aumentar los fragmentos no 1-84. No existe una mayor aproximación pronóstica sobre mortalidad con PTHbio que con PTHi. No se observan diferencias en el valor predictivo del cociente sobre la mortalidad. Tampoco hubo diferencias en mortalidad cuando se analiza la progresión del cociente PTHbio/PTHi.
ConclusionesNo encontramos ventajas en la utilización de PTHbio sobre la PTHi como marcador de mortalidad. Se deben reevaluar los límites de la PTHbio pues su relación con la PTHi no es constante. El no conocer esos límites condiciona su utilidad pronóstica.
The Parathyroid Hormone (PTH) is a 84 amino acids protein with a established role in the regulation of mineral metabolism; main target organs are the bone and kidneys among others. In spite of being a hormone, in the case of the renal patient, it is classified as a true uremic toxin because it increases progressively with the progression chronic kidney disease (CKD), and it responsible for multiple systemic effects.1,2 It is included as one of the uremic toxins that cause cardiovascular damage.3,4
The control of PTH is important for the adequate treatment of the abnormalities of mineral metabolism in CKD. Therefore much of the therapeutic efforts aimed at controlling these alterations are dedicated to an adequate control of PTH. Nevertheless, in hemodialysis patients PTH is a poor marker of mortality. Only large studies have revealed that high PTH values that are related to higher mortality. And in these studies the results are variable.4–8 However, other molecules such as calcium and phosphorus have shown a better prognostic significance on mortality, along with vitamin D, although with the later the results have been less conclusive.9,10
Circulating PTH includes a mixture of peptides such as the whole molecule 1–84 and smaller fragments resulting from the catabolism of PTH, these are called non-1–84 or carboxyterminal fragments. Only PTH 1–84 (whole protein) exert biological activity. Some of the carboxyterminal fragments have a PTH antagonistic action. PTH is cleared by the kidney and the proportion of these PTH peptides varies according to the CKD stage. The methods currently used to measure PTH in clinical practice are of two categories. The so-called 2nd generation that measures the intact 1–84 PTH (PTHi) and multitude of fragments no 1–84. The 3rd generation method, also called PTHbio, recently marketed, quantify the PTH 1–84 only, although its use is not generalized yet.11,12
In an attempt to integrate the information provided bay the measurement of both molecules, some authors have advocated the utility of the proportion (ratio) of these molecules by the ratio PTHbio/PTHi as a marker of the bone remodeling13,14 and mortality.15
In clinical practice, there are currently two criteria to define the normal values of PTH. The first, and most classic, is based on histomorphometry as defined by the Guides KDOQI16 and the Guidelines SEN.17 At that time, based on bone biopsies, bone abnormalities were present if PTHi was lower than150pg/ml or above 300pg/ml. The range of normality were established according to relationship of iPTH with the lesions observed in the bone biopsy.18 These values still exist in most of the recommendations. The other criterion is mortality. There are several studies that find increased mortality with high iPTH values; much higher than 300pg/ml. Thus, the more recent KDIGO Guidelines19 defined adequate iPTH as 2–9 times above the normal values. However, not all nephrologists were completely convinced with this recommendation. The recent COSMOS study has found that in a large cohort of patients followed for 5 years, the PTH values associated with less mortality are fin the range of 168–674pg/ml,20 very similar to the KDIGO recommendations. The authors of the COSMOS study recommend modifying the reference values of PTHi based on bone histomorphometric studies, by PTH values based on survival. Although there are contradictory results, it seems that the mortality associated with serum PTH describes a J shape curve, with higher mortality in patients with lower and higher PTH values. But there is also significant variability between the different PTH 2nd generation commercial kits21 which makes it difficult to interpret the results.
The variability in PTH measurements poses several problems when interpreting their values, and deciding the target values to be achieved when treating a renal patient. What would be the normal values?, those based on histomorphometric studies?, the ones based on mortality?, both?; which method use to measure the PTH, 2nd or 3rd generation?
The present study evaluated the differences in mortality prediction using PTH values obtained with measurement of 2nd and 3rd generation in a group of hemodialysis patients followed for 2 years. In addition, we have evaluated the PTHbio/PTHi ratio as a possible marker of mortality, in case the ratio of the circulating molecules could be a marker. In addition, we have analyzed the association between mortality and serum iPTH levels recommended by KDOQI (150–300pg/ml) and the range obtained by COSMOS (168–674pg/ml). So the values of PTH that best predict mortality were determined.
Material and methodsThis is a two-year prospective study performed under daily clinical practice conditions. The main objective of this study was to determine the association of serum PTH with hemodialysis patient survival. It included 145 hemodialysis patients from a single center, who underwent a baseline analytical determination, followed by a follow-up of two years. We determined clinical parameters and baseline analysis in which PTH was determined by 2 different methods, 2nd and 3rd generation, as well as calcium, phosphorus, alkaline phosphatase and bone alkaline phosphatase, FGF23, 25 (OH)-vitamin D, and bone remodeling markers. The values of PTH-intact (PTHi) or PTH of 2nd generation were determined by an electrochemiluminescence method using the Elecsys autoanalyzer (Roche); this method uses an antibody directed against amino acids 26–32 of the molecule and another against the aminoacids 55–64. Therefore it does not detect short carboxyterminal fragments, but this method measures PTH 1–84 and long PTH fragments 7–84 and amino-PTH11 (intra- and inter-assay coefficients of variation are <2.5 and <3% respectively and sensitivity of 1.2pg/ml method). The PTHi values were normalized to the Allegro PTHi using the formulas given by the Spanish Society of Nephrology (SEN). The values of PTH of 3rd generation or PTH-bio were determined by an electrochemiluminescence method also using the Elecsys autoanalyzer (Roche), which uses an antibody directed against amino acids 1–4 of the molecule and another against aminoacids 55–64, thus measuring the molecule 1–84 and the amino-PTH11 (coefficients of intra- and inter-assay variation are <3 and <6% respectively and the sensitivity of the method is 5.50pg/ml). Normal values of PTHb were defined as 50% of the value of PTH.15
The ratio of PTHbio/PTHi molecules was also calculated in order to determine the proportion of PTH fragments 7–84.
A registry of deceased patients (of any cause) was recorded at year 1 and 2, and general analytical parameters of mineral metabolism, inflammation and nutrition were determined. In both the annual and the two-year follow-up, the PTH was measured using the 2nd generation method.
The ADVIA CENTAUR 2400 autoanalyzer was used for the measurements of serum albumin (bromocresol green dye binding technique; intra- and inter-assay coefficients of variation were <1.3 and <2% and the sensitivity of the method was 1g/dl). Serum calcium (arsenazo III technique, coefficients of intra- and inter-assay variation are <1.2 and <2%, and the sensitivity of the method is 0.5mg/dl), serum creatinine (alkaline picrate technique, intra- and inter-assay variation are <3.1 and <4%, and the sensitivity of the method is 0.2mg/dl), serum phosphate (UV phosphomolybdate technique; intra- and interassay coefficients of variation are <2, 2 and <3%, and the sensitivity of the method is 0.3mg/dl), total serum proteins (biuret technique, intra- and inter-assay coefficients of variation are <1.3 and <2%, and sensitivity of the method is 2g/dl), PCR (turbidimetric technique enhanced with latex, coefficients of intra- and interassay variation are <4.9 and <6%, and the sensitivity of the method is 0.003mg/dl), and serum alkaline phosphatase (hydrolysis p-nitrophenyl phosphate; Coefficients of intra- and interassay variation are <1.9 and <2.4%, and the sensitivity of the method is 5U/l).
Serum prealbumin values were determined by turbidimetry in a SPA plus autoanalyzer, with intra- and interassay coefficients of variation being <4.4 and <6% respectively and a sensitivity of 0.006g/l.
The values of total vitamin D (25 [OH] vitamin D2 and D3) were determined by an electrochemiluminescence method performed on the Elecsys autoanalyzer (Roche) with coefficients of intra- and inter-assay variation respectively <7.5% and <8% and sensitivity of 3ng/ml.
Plasma (C-terminal) fibroblast growth factor 23 (FGF-23) was determined by an ELISA method (Immutopics, USA) using 2 polyclonal antibodies directed to the C-terminal fraction of FGF-23 (coefficients Of intra- and inter-assay variation are <1.7 and <3.5% respectively and the sensitivity of the method is 1.5RU/ml).
The bone isoenzyme of alkaline phosphatase was determined in serum by ELISA (OSTASE BAP, IDS, UK) (coefficients of intra- and inter-assay variation are <4.5 and <6.4% respectively and the sensitivity of the method is 0.7Mg/l).
The determination of the C-terminal propeptide of procollagen type I (PINP) and the β-Cross Laps (β-CTX) in serum was performed by electrochemiluminescence in the Elecsys autoanalyzer (Roche) (for PINP coefficients of intra- and interassay variation are <2.9 and <3.7% respectively and the sensitivity of the method is 5μg/l; for β-CTX, coefficients of intra- and interassay variation are <4.6 and <4.7% respectively and sensitivity of the method is 0.07ng/ml).
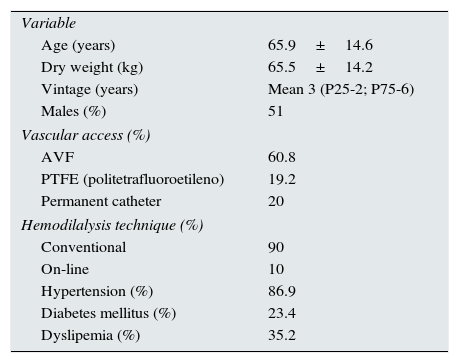
ResultsA prospective study including 145 hemodialysis patients was conducted for two year period; 49% were women. Table 1 shows baseline clinical and biochemistry data of the patients studied. 85.1% of the patients was on some type vitamin D receptor activator, and 17.9% received cinacalcet.
Demographic and clinical characteristics; and, baseline biochemistry of the study population.
| Variable | |
| Age (years) | 65.9±14.6 |
| Dry weight (kg) | 65.5±14.2 |
| Vintage (years) | Mean 3 (P25-2; P75-6) |
| Males (%) | 51 |
| Vascular access (%) | |
| AVF | 60.8 |
| PTFE (politetrafluoroetileno) | 19.2 |
| Permanent catheter | 20 |
| Hemodilalysis technique (%) | |
| Conventional | 90 |
| On-line | 10 |
| Hypertension (%) | 86.9 |
| Diabetes mellitus (%) | 23.4 |
| Dyslipemia (%) | 35.2 |
| M±SD | |
|---|---|
| Hemoglobin (g/dl) | 11.8±1.6 |
| Hematocrit (%) | 35.5±4.6 |
| Urea (mg/dl) | 117.7±36.5 |
| Proteins (g/dl) | 6.5±0.6 |
| Albumin (g/dl) | 3.6±0.4 |
| Iron (μg/dl) | 65.4±28 |
| Fe saturation index (%) | 31.7±14.3 |
| Calcium (mg/dl) | 9.2±0.7 |
| Phosphate (mg/dl) | 4.7±1.6 |
| CO2 | 21.4±3.5 |
| Total cholesterol (mg/dl) | 158±35 |
| Prealbumin (mg/dl) | 33±10 |
| Ferritin (ng/dl) | 406±242 |
| Mean (P25;P75) | |
|---|---|
| Bone alkaline phosphatase (μg/l) | 29.6 (20.7;41.9) |
| PINP (μg/l) | 255.3 (161.2;486.6) |
| β-CTX (ng/ml) | 1.8 (1.3;2.5) |
| PTH 2.ª gen (iPTH) (pg/ml) | 205 (116.5;386.1) |
| PTH 3.ª gen (bioPTH) (pg/ml) | 119.5 (76.2; 240 |
| Ratio bioPTH/iPTH | 0.61 (0.56;0.68) |
| 25OH- D (ng/dl) | 22.9 (12.7;34.2) |
| Creatinine (mg/dl) | 7.6 (5.6;9.1) |
| Alkaline phosphatase (UI/l) | 111 (89;145) |
| Triglycerides (mg/dl) | 146 (102;193) |
| C reactive protein (mg/dl) | 0.6 (0.25;1.97) |
| ProBNP (pg/ml) | 8325 (3422;17450) |
| FGF-23 (RU/ml) | 788 (384;3258) |
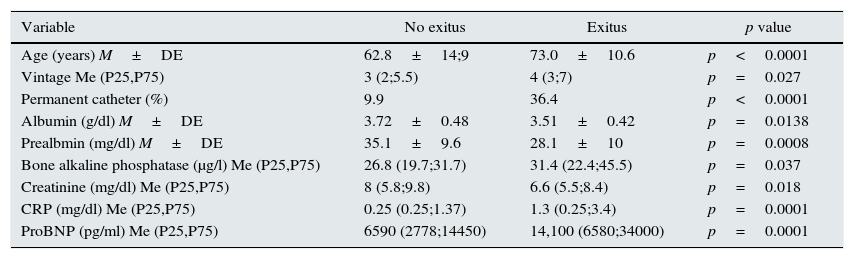
Twenty one patients died during the first year follow-up, and 28 in the second year. Potential Clinical and biochemical variables analytical that correlate with mortality are shown in Table 2. The parameters related to mortality were albumin, prealbumin, C-reactive protein, ProBNP, creatinine, age, vascular access type, and bone alkaline phosphatase. However, the PTH values of both the 2nd (PTHi) and the 3rd generation (PTHbio) and the ration PTHi/PTHbio of the patients who died were not different than in patients that remained alive.
Variables significantly related with mortality.
| Variable | No exitus | Exitus | p value |
|---|---|---|---|
| Age (years) M±DE | 62.8±14;9 | 73.0±10.6 | p<0.0001 |
| Vintage Me (P25,P75) | 3 (2;5.5) | 4 (3;7) | p=0.027 |
| Permanent catheter (%) | 9.9 | 36.4 | p<0.0001 |
| Albumin (g/dl) M±DE | 3.72±0.48 | 3.51±0.42 | p=0.0138 |
| Prealbmin (mg/dl) M±DE | 35.1±9.6 | 28.1±10 | p=0.0008 |
| Bone alkaline phosphatase (μg/l) Me (P25,P75) | 26.8 (19.7;31.7) | 31.4 (22.4;45.5) | p=0.037 |
| Creatinine (mg/dl) Me (P25,P75) | 8 (5.8;9.8) | 6.6 (5.5;8.4) | p=0.018 |
| CRP (mg/dl) Me (P25,P75) | 0.25 (0.25;1.37) | 1.3 (0.25;3.4) | p=0.0001 |
| ProBNP (pg/ml) Me (P25,P75) | 6590 (2778;14450) | 14,100 (6580;34000) | p=0.0001 |
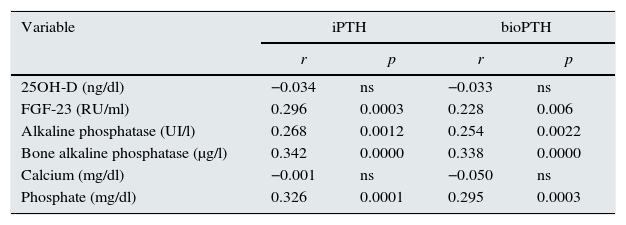
The main objective of this study is to define the effect on the mortality of PTH values of both 2nd and 3rd generation, as the ratio between both. Second generation PTH (PTHi) and third generation PTH (PTHbio) have a good correlation within each other. The correlations of PTH from 2nd and the 3rd generation, with other molecules of the mineral metabolism are similar (Table 3).
Correlation of PTH 2.ª y 3.ª generation with other molecules of mineral metabolism.
| Variable | iPTH | bioPTH | ||
|---|---|---|---|---|
| r | p | r | p | |
| 25OH-D (ng/dl) | −0.034 | ns | −0.033 | ns |
| FGF-23 (RU/ml) | 0.296 | 0.0003 | 0.228 | 0.006 |
| Alkaline phosphatase (UI/l) | 0.268 | 0.0012 | 0.254 | 0.0022 |
| Bone alkaline phosphatase (μg/l) | 0.342 | 0.0000 | 0.338 | 0.0000 |
| Calcium (mg/dl) | −0.001 | ns | −0.050 | ns |
| Phosphate (mg/dl) | 0.326 | 0.0001 | 0.295 | 0.0003 |
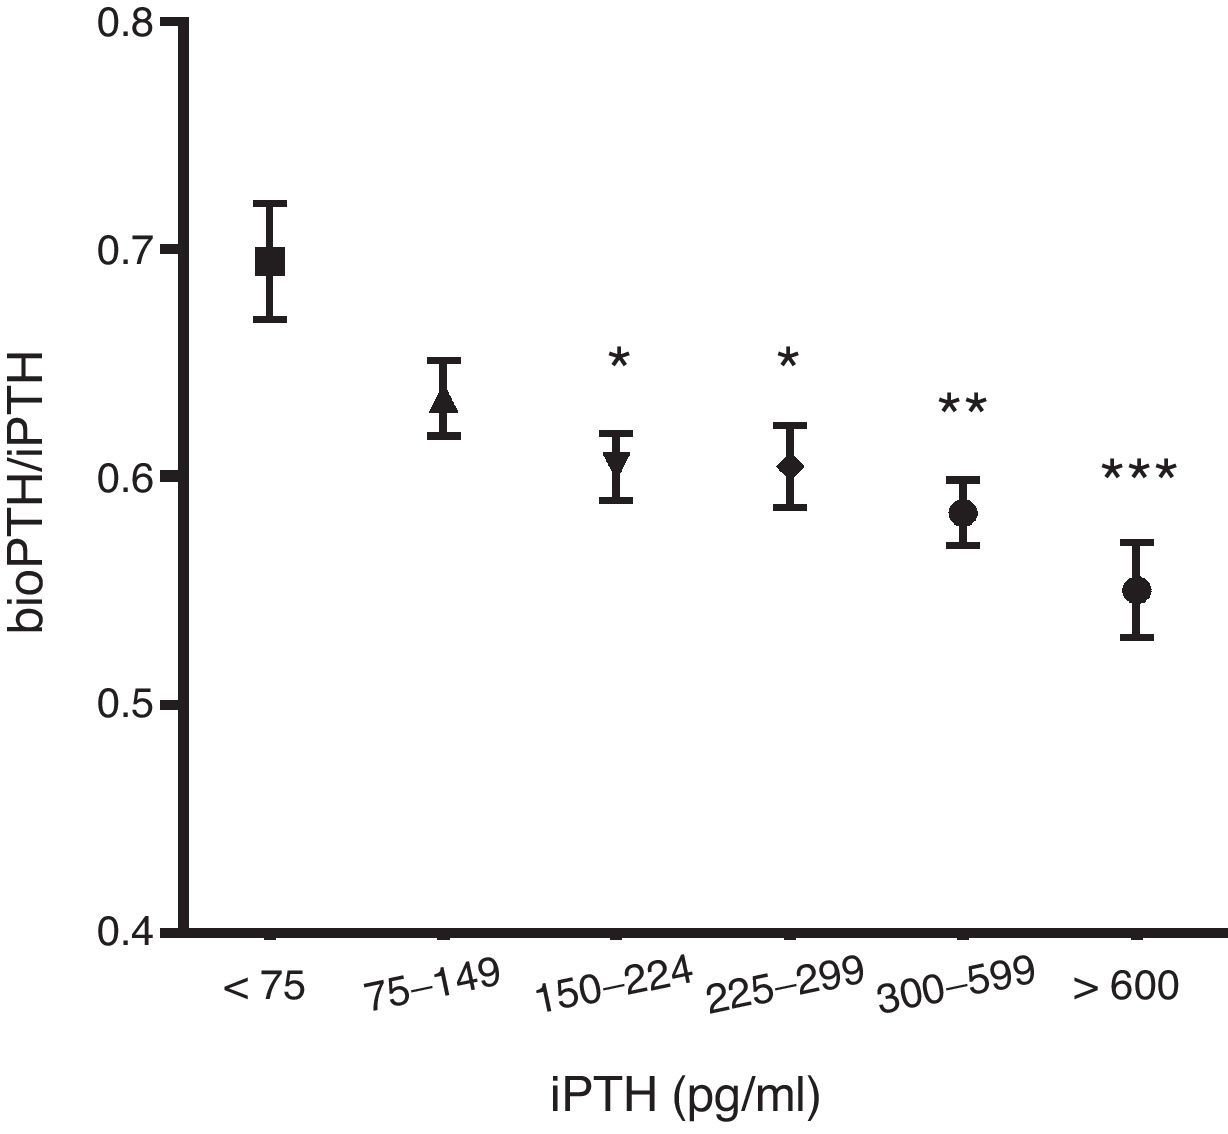
The ratio PTHbio/PTHi decreases as la PTHi values increases suggesting that non 1–84 fragments increase secondary to a degradation of the PTH 1–84 (Fig. 1).
 (pg/ml). (*): p<0.05; (**): p<0.01; (***): p<0.001. Y axis bioPTH/iPTH. X axis iPTH (pg/ml).")
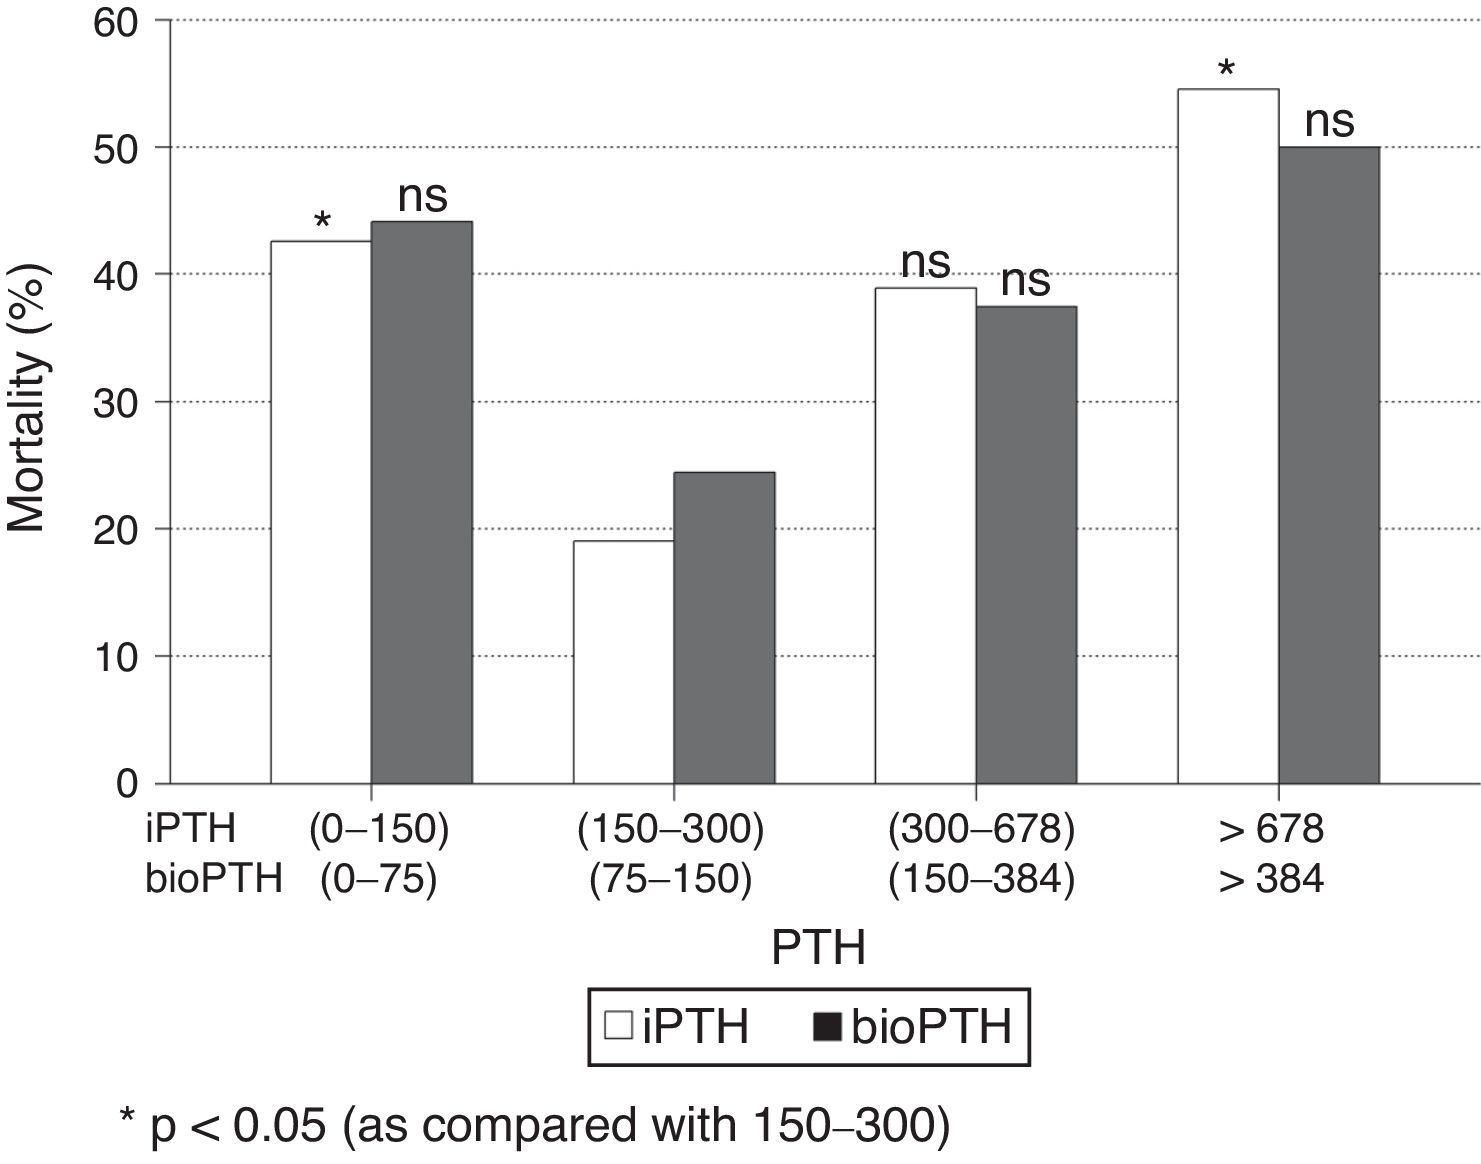
When patients were stratified by PTH intervals, a significant increase in mortality was observed in patients with extreme PTHi values: greater than 678pg/ml and less than 150pg/ml, compared to the group of patients with PTH between 150 and 300pg/ml (Fig. 2); although the mortality is higher among patients with PTHi between 300 and 678pg/ml than in those whose PTHi is 150–300pg/ml (Fig. 2), this difference did not reach statistical significance. With the PTHbio calculated as 50% of the PTHi the differences are not significant in the same intervals.

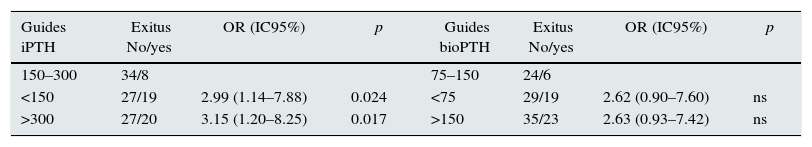
Comparison of mortality in the PTH range recommended by the current SEN and KDOQI PTHi guidelines (150–300pg/ml) and the values established by the COSMOS study (164–678pg/ml) (Table 4), the relative risk of mortality is only significant with PTH greater than 300pg/ml and less than 150pg/ml. This implies that patients with PTHi greater than 300 have higher mortality only when patients with PTHi greater than 678pg/ml are included. In our study, iPTH showed a better predictive value of mortality than bioPTH, taking 150–300 (75–150)pg/ml as a reference, but it is due to the patients with highest PTH values (Table 4).
Mortality in patients with PTH within reference values established by Guides SEN and KDOQI (150–300pg/ml) and COSMOS (168–674pg/ml) using iPTH and bio PTH methods.
| Guides iPTH | Exitus No/yes | OR (IC95%) | p | Guides bioPTH | Exitus No/yes | OR (IC95%) | p |
|---|---|---|---|---|---|---|---|
| 150–300 | 34/8 | 75–150 | 24/6 | ||||
| <150 | 27/19 | 2.99 (1.14–7.88) | 0.024 | <75 | 29/19 | 2.62 (0.90–7.60) | ns |
| >300 | 27/20 | 3.15 (1.20–8.25) | 0.017 | >150 | 35/23 | 2.63 (0.93–7.42) | ns |
| Cosmos iPTH | Exitus No/yes | OR (IC95%) | p | Cosmos BioPTH | Exitus No/yes | OR (IC95%) | p |
|---|---|---|---|---|---|---|---|
| 168–674 | 47/22 | 84–337 | 56/27 | ||||
| <168 | 36/20 | 1.19 (0.56–2.50) | ns | <84 | 25/15 | 1.24 (0.57–2.74) | ns |
| >674 | 5/6 | 2.56 (0.71–9.32) | ns | >337 | 7/7 | 2.07 (0.66–6.51) | ns |
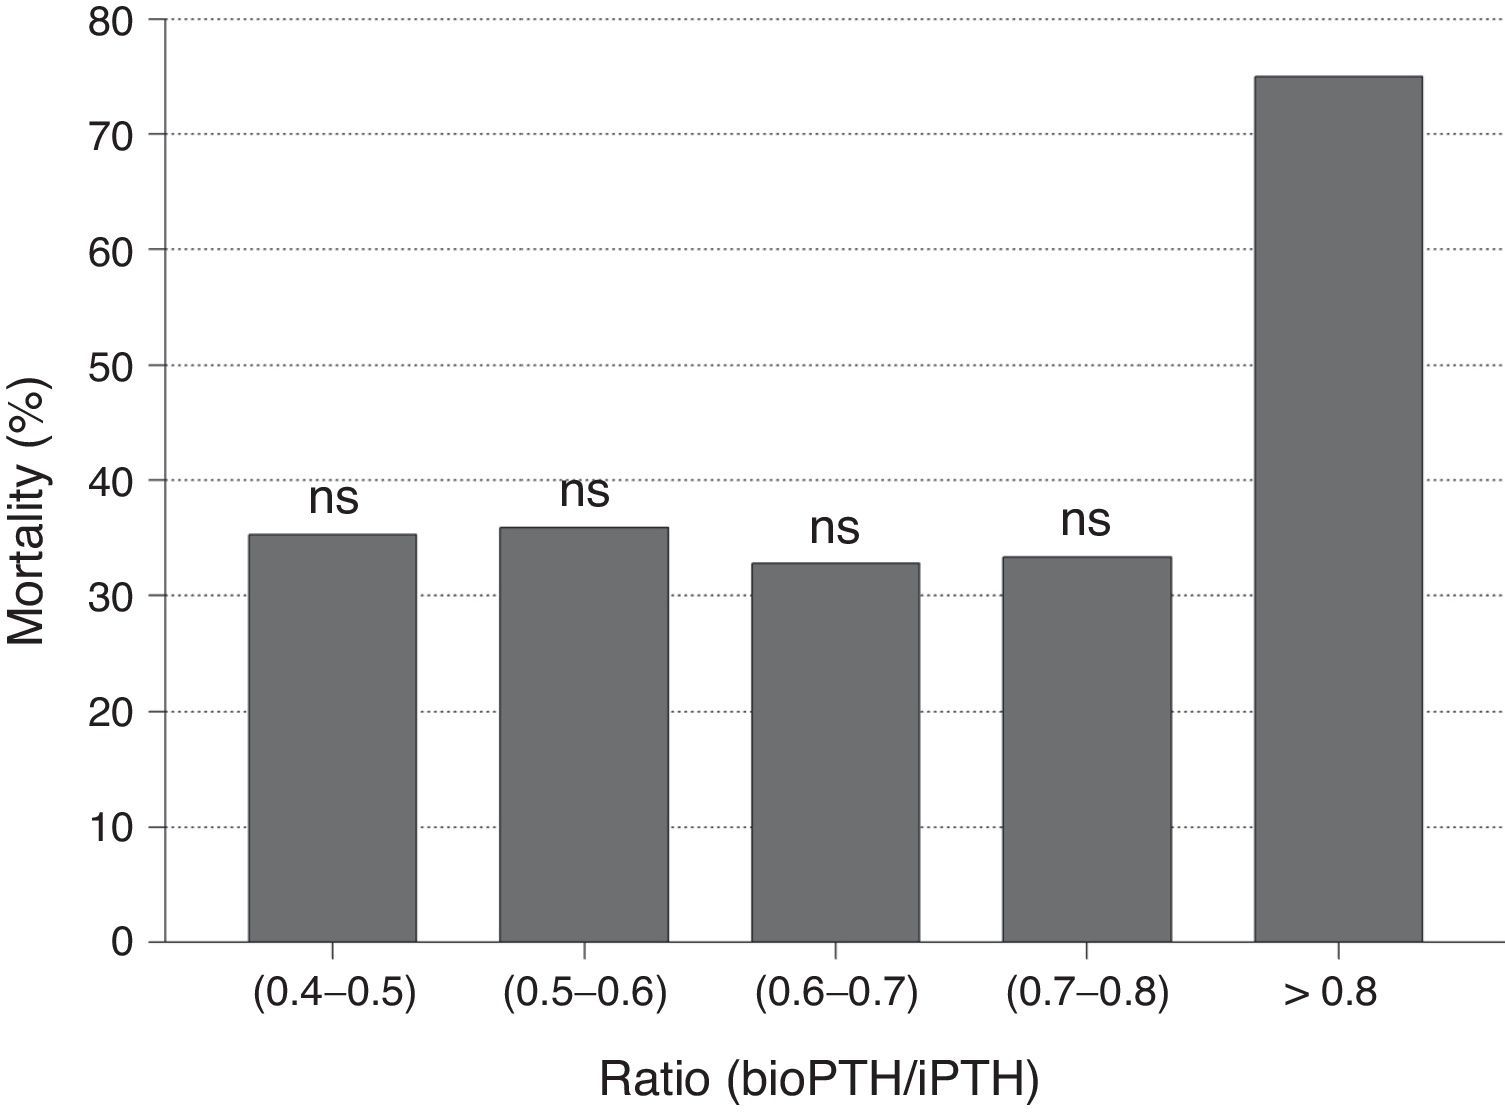
No differences were observed in bioPTH/iPTH ratio between patients who died and those who did not. Likewise, no differences in mortality were observed when the PTHbio/PTHi ratio was analyzed by quintiles, so bioPTH/iPTH ratio does not appear to be a marker of mortality (Fig. 3). The bioPTH/iPTH value higher than 0.8 has a higher mortality, but given the small group of patients this difference is not significant.
Discussion; X axis (0.4–0.5)(0.5–0.6)(0.6–0.7)(0.7–0.8)(0.8–0.9); ratio(bioPTH/iPTH).")
In renal patients, abnormalities of mineral metabolism are a risk for cardiovascular disease.22 However, among the parameters of mineral metabolism PTH has a relatively low weight as a marker of morbidity and mortality in the renal patient. In our study we observed that PTH is not a marker of mortality when analyzed in conjunction with other factors of greater influence such as age, years on dialysis, albumin or vascular access. However, it is an important modulator of all alterations of mineral metabolism, so its control should not be neglected. As we observed, PTHb and PTHi correlate very well with other parameters such as phosphorus, FGF23, bone alkaline phosphatase and years of dialysis. All these parameters are associated with morbimortality. In fact, many research groups find a greater interest in combining several parameters of mineral metabolism as a marker of mortality.9
The main objective of this work has been to define PTH as a marker of mortality and the reference values that should used in daily practice.
The relationship between iPTH and mortality is controversial. Although most studies find that PTHi is a marker of mortality some authors did not.9 The established range of 150–300pg/ml were based on histomorphometric criteria, but these values are also the inflection points in mortality. The meta-analysis of Natoli et al.8 described PTH related mortality as a J curve. We also a J-shaped mortality curve where values with lower mortality are within the PTHi range of 150–300pg/ml.
Like other authors,23 we found a correlation between iPTH and bioPTH. Thus once adjusted, the values of normality could be used interchangeably. In addition, both determinations correlate with the same clinical and analytical parameters, so it appears that one method does not have an advantage over the other. It is known that as the glomerular filtration rate decreases there is an increase in non-1–84 fragments.24 It is remarkable to see that as the 1–84 PTH increases, the fragments are also increased even to a greater extent than the 1–84 PTH molecule itself. As non-1–84 fragments are antagonists of 1–84 PTH it could be assumed that at a higher iPTH, the systemic effects, especially bone, would be reduced by these molecules. This aspect deserves to be investigated in order to know its relevance. The changes in the proportion of these fragments are important when defining the normal values of bioPTH.
However, in our study we did not observe that patients with a low PTHb/PTHI ratio had a lower mortality due to an increase in the 7–84 fragments, suggesting that the PTH 1–84 molecule has a relevant role in the mortality of these patients.
The normal values of bioPTH are defined as 54% of iPTHi.15 However, in our study, it was observed that this proportion varies according to the iPTH values. That is, at higher 1–84 PTH the non-1–84 PTH fragments increase to a greater extent than the 1–84 PTH itself. Therefore, the normal values of 1–84 PTH measured by 3rd generation methods in the hemodialysis patient are not known at present, as they are not yet formally established in any guideline recommendations. According to our results, limits of bioPTH should be narrow, since elevations of 1–84 PTH are accompanied by an even greater proportional increase non 1–84 PTH fragments; this should be considered when establishing normal values for bioPTH. It is not known how to interpret the values of bioPTH after eliminating the distortion factor of fragments non 1–84 PTH, since there are no studies to that end. The assumption of bioPTH as 50–54% of the iPTH does not seem correct, as it does not correspond to reality. A multicenter study should be performed with a large number of patients to define these values.
The COSMOS study finds that a iPTH of 674ng/ml may be established as the upper limit of the reference interval in terms of mortality. Like other authors25 we did not find, that a higher mortality in patients with iPTH between 300 and 674 than in those with iPTH between 150 and 300ng/ml. These results should make us cautious before establishing the value of 678ng/ml as the upper reference value. Mortality is significant above 678pg/ml, but we should never consider that figure as a safe value. Statistical significance should not make us think that an increase in iPTHi up to 9 times normal values is safe. Such a high iPTH value may cause alterations of the mineral metabolism that may have negative repercussion in the renal patient. There is a confidence zone between 300 and 678pg/ml in which mortality is low but we think that being near 300 is safer than 678pg/ml.
The bioPTH (1–84)/PTHi (1–84 PTH+non 1–84 PTH) ratio has been evaluated as a marker of bone histomorphometric changes and as a predictor of mortality. However the evidence is still sparse. Like in the study by Melamed et al.,15 our results show that the ratio is not associated with mortality. Other authors have found that ratio bioPTH/iPTH is a good marker of mortality in men on hemodialysis.26 Those patients with higher values of ratio bioPTH/iPTH ratio would have a higher mortality.
Our study has several limitations. The sample of patients studied is small, since a larger group of extreme PTH values is necessary. Another limitation of our study is to have performed bio PTH at baseline only and not being repeated in successive time points.
ConclusionsAccording to our results the values of PTHi defined by histomorphometric criteria are well-established limits of mortality in hemodialysis patients, the 300pg/ml value defines better the cutoff point of mortality than the 674 value defined in the COSMOS study, although the mortality between 150–300 and 300–678pg/ml is the same. The 3rd generation of PTH measurement method that define the bioPTH do not add more precision to define defining mortality. The normal values of iPTH are not well defined, so the iPTH and bioPTH may not be compared with the values currently stablished. The ratio bioPTH/iPTH ratio is not a good marker of mortality.
Conflicts of interestRoche Spain has sponsored the measurements of bioPTH, and has had no role in the design or the preparation of this publication.
Our thanks to Maribel Villarino for the help with the development of the study. L.R.-O. is a Health Professional on Research Training “Rio Hortega r” (CM13/00131), Ministry of Education, Government of Spain. R.V.B. is a professional with postdoctoral contract “Sara Borrell” (CD14/00198) and a project (SAF2014-60699-JIN) of the Ministry of Economy (MINECO) and FEDER funds. PI14/00386. PI16/01298. FEDER funds ISCIII-RETIC REDinREN/RD06/0016, RD12/0021.
Please cite this article as: Rodríguez-Osorio L, de la Piedra C, Rubert M, Martín-Fernández M, González Casaus ML, Gracia-Iguacel C, et al. Diferencias entre los métodos de determinación de 2.ª y 3.ª generación de la parathormona sérica sobre la mortalidad en el paciente en hemodiálisis. Nefrología. 2017;37:389–396.


