Abdominal fat and its increment over time in particular has become a cardiovascular risk factor in uraemic patients.
ObjectivesTo analyse changes in abdominal fat in haemodialysis patients over one year and study their possible correlation with the variation in adipocytokine serum levels. As a secondary objective, we tried to validate the data obtained by bioelectrical impedance analysis (BIA) with data obtained by dual X-ray absorptiometry (DXA).
Material and methodsA prospective one-year study was performed in 18 patients on haemodialysis (HD). In each patient, body composition by BIA and DXA was estimated at baseline and after one year. Several adipocytokine and biochemical parameters were determined.
ResultsA significant increase in phase angle [4.8° (4.1–5.6) vs. 5.2° (4.4–5.8), p<0.05], BIA intracellular water [48.3% (43.1–52.3) vs. 50.3% (45.7–53.4), p<0.05] and the ratio between the percentage of android/gynecoid (A/G) distribution of fat measured by DXA [1.00 (0.80–1.26) vs. 1.02 (0.91–1.30), p<0.05] was observed. A statistically significant relationship between leptin and adiponectin concentrations and the percentage of fat mass measured by BIA, as well as the abdominal fat percentage estimated by DXA, was found (p<0.01).
ConclusionHD patients exhibit a gain in fat mass over time, especially in the abdomen, evidenced by an increased A/G ratio. These findings might explain the increased cardiovascular risk in these patients.
La grasa abdominal y, sobre todo, su ganancia a lo largo del tiempo, se ha consolidado como un factor de riesgo cardiovascular en pacientes urémicos.
ObjetivosAnalizar los cambios en la grasa abdominal en los pacientes de hemodiálisis (HD) a lo largo de un año y estudiar sus posibles relaciones con los cambios en los niveles circulantes de adipocitocinas. Como objetivo secundario intentamos validar los datos obtenidos por bioimpedancia eléctrica (BIA) con los obtenidos por absorciometría dual de rayos X (DXA).
Material y métodosSe realizó un estudio prospectivo de un año de duración en 18 pacientes en HD. En cada paciente se cuantificó, basalmente y al cabo de un año, la composición corporal por BIA y DXA y se determinaron varios parámetros bioquímicos incluyendo adipocitocinas.
ResultadosSe evidenció un aumento significativo del ángulo de fase [4,8° (4,1-5,6) frente a 5,2° (4,4-5,8); p<0,05], del agua intracelular por BIA [48,3% (43,1-52,3) frente a 50,3% (45,7-53,4); p<0,05] y del cociente entre el porcentaje de grasa de distribución androide/ginecoide (A/G) medido por DXA [1,00 (0,80-1,26) frente a 1,02 (0,91; 1,30); p<0,05]. Se encontró una relación estadísticamente significativa entre las concentraciones de leptina y adiponectina tanto con el porcentaje de masa grasa medida por BIA como con la grasa abdominal estimada mediante DXA (p<0,01).
ConclusiónLos pacientes en HD experimentan una ganancia de grasa con el tiempo, especialmente en localización abdominal, evidenciada por un aumento del cociente A/G, lo que podría explicar el aumento del riesgo cardiovascular que presentan.
Cardiovascular (CV) disease is the leading cause of morbidity and mortality in patients with kidney disease.1 Obesity is closely associated to a high risk of CV disease.2 CV disease is linked with chronic low-intensity inflammation, as there is an increase in circulating levels of proinflammatory cytokines and acute-phase proteins.
Leptin is a modulator of the immune-response that causes stimulation of proinflammatory cytokines the production and produces a significant increase in sympathetic activity.3,4 Adiponectin is the adipoquine of highest expression in the adipocyte.5,6 Plasma concentrations of Adiponectin are decreased in overweight and obese individuals.7 Some studies conducted in different populations have revealed that low adiponectin concentrations can independently predict the future development of insulin resistance, and other investigations have shown that adiponectin has anti-atherogenic and anti-inflammatory properties that can negatively regulate the atherogenic process.8
Fibroblast growth factor 21 (FGF-21) stimulates the uptake of glucose by the adipocyte independently of insulin, suppresses the production of hepatic glucose and is involved in regulating body fat.9 In addition, it is directly correlated with body mass index (BMI), levels of leptin, triglycerides, insulin, and the HOMA-IR index.10 FGF-21 is metabolised mainly by the kidneys, and therefore a decrease in renal function might cause an increase in its plasma levels.11 Also, chronic kidney failure is a state of soluble β-Klotho deficiency (co-receptor of FGF-21), which may theoretically lead to a possible state of resistance, as is the case with FGF-23,12 the clinical impact of which has yet to be studied.
The increase in CV mortality in patients on dialysis cannot be fully explained by “classic” risk factors, and so in recent years, numerous “non-classic” factors have emerged. Abdominal fat and, above all, the gain of abdominal fat over time, has been established as a significant CV risk factor, especially in uraemic patients.13
Dual-energy X-ray absorptiometry (DXA)14 is a reference technique able to assess body composition as in 3 compartments: body fat mass (BFM), bone mineral density (BMD) and lean body mass (LBM). Whole-body scans allow for regional determinations of BFM.15
The limited information available on body composition in uraemic patients and its effects on CV mortality encouraged us to carry out this pilot study. Our main objective has been not only to verify whether there is an abdominal fat gain in haemodialysis (HD) patients, but also to study a possible relationships with the changes in plasma levels of adipocytokines, which could be related to the metabolic disorders induced by adipocyte activity in uraemia. As a secondary objective, we tried to validate the data obtained by bioelectrical impedance analysis (BIA) with those obtained by DXA (gold standard for determining body composition and poorly accessible technique in daily clinical practice).
Patients and methodsStudy designA prospective, one-year study was conducted in which 18 patients undergoing HD were included. The population was selected among patients treated in the Nephrology Department of Hospital Universitario La Paz. The inclusion criteria were as follows: patients over 18 years of age; on renal replacement therapy for a period of more than 3 months and less than 5 years, with no deterioration in cognitive abilities and who will sign the informed consent. The exclusion criteria were: patients with active cancer, or limited life expectancy. Advanced age was not an exclusion criterion. Demographic data and data on renal replacement therapy, as well as comorbidities or intercurrent processes, were recorded. The recruitment period for patients lasted from May 2011 to March 2013. An informed consent template was designed and it was signed by each participant. This study was approved by the Independent Ethics Committee of Hospital Universitario La Paz.
The measurements of anthropometric and body composition, and the collection of blood samples, were obtained under fasting conditions at baseline (between 2011 and 2013) and 12 months later.
The biochemical analysis was performed in the Clinical Analysis Department of Hospital Universitario La Paz. In both samples the following parameters were measured: glycaemia, lipid profile (cholesterol and triglycerides), albumin, insulin, HOMA-IR index, free fatty acids, C-reactive protein (CRP), leptin, adiponectin, interleukin-6 (IL-6), tumour necrosis factor alpha (TNF-α) and FGF-21. All the laboratory tests were done under fasting conditions: pre-dialysis during the morning shift in HD patients, coinciding with peritoneal kinetics in peritoneal dialysis (PD) patients.
Subsequently, we performed a second part of the study; a control group of 17 patients on PD, from the Nephrology Department, who fulfilled the same criteria as the HD patients were compared with the 29 patients on HD (cross-sectional baseline). Thus, this study compares data on the body composition of both groups of patients to perform concordance studies among methods for analysing body composition.
Anthropometry and body compositionThe anthropometric measurements of the patients were obtained in accordance with the standard technique and the current international recommendations (WHO, 1976). These measurements were obtained in subjects barefoot and in their underwear. The measurements were always taken pre-dialysis in HD patients, and with the abdomen empty in PD patients. A body-composition analyser (TANITA BC-420MA, Biológica Tecnología Médica S.L., Barcelona, Spain) was used to measure weight. Height was measured by a millimetre precision rod (range: 80–200cm). To measure mid-upper arm muscle area (MUAMA), an inextensible millimetre precision metric tape (0.1cm) was used. Triceps skin fold (TSF) was obtained by means of a Holtain skinfold calliper with a range of 20cm and a sensitivity of 0.2mm. BMI (weight [kg]/height [m2]) was calculated from the anthropometric weight and height measurements. Waist circumference (WC) was measured in cm, using a millimetre precision tape measure with the waist in a horizontal position (narrower torso level, midline between the iliac crest and the last rib). This was measured at the end of a normal exhalation.
Body composition was quantified using both BIA and DXA. To determine body composition by BIA, a four-pole vector device (50kHz), with an intensity of 0.8mA, was used (model BIA 101 by Akern Systems, Florence, Italy). The measurement was performed according to the criteria established by the National Institutes of Health Technology Assessment Conference Statement.16 For patients who presented with vascular access for dialysis, all measurements were performed on the contralateral side.17 The BCM (Body Composition Monitor, Fresenius Medical Care, Germany) was used as multifrequency BIA, with a frequency range between 5 and 1000kHz. DXA was performed in the Nuclear Medicine Department of Hospital Universitario La Paz using the region of interest (ROI) recommended by the bone radiodensitometer manufacturer with enCore LUNAR 43616 ES software (GE Healthcare, Buckinghamshire, United Kingdom) for the regional measurements of BFM (trunk, gynoid and android).
Laboratory proceduresThe blood samples used to determine FGF-21 were collected in heparin-lithium plasma tubes and centrifuged at 3500rpm for 10min prior to storage at −40°C or at −80°C, until analysis. FGF-21 was quantified using an enzyme-linked immunosorbent sandwich assay (ELISA), according to the manufacturer's instructions (Merck-Millipore, Darmstadt, Germany). The assay sensitivity was 1.7pg/ml, while the intra- and inter-assay precisions were 5.7% and 6.9%, respectively. The expected normal range was less than 200pg/ml. Leptin, IL-6, TNF-α and adiponectin were quantified by multiplex immunoassay (Milliplex®, Merck-Millipore, Darmstadt, Germany). IL-6 sensitivity was 1.4pg/ml, while the intra- and inter-assay precisions were 7% and 13%, respectively. Leptin sensitivity was 7.3pg/ml, while the intra- and inter-assay precisions were 5% and 11%, respectively. TNF-α sensitivity was 0.4pg/ml, while the intra- and inter-assay precisions were 8% and 7%, respectively. Free fatty acids were measured based on an in vitro enzymatic colorimetric method (A25, Biosystems, Barcelona, Spain). The expected values were 2.8–16.9mg/dl for men and 2.8–12.7mg/dl for women. Precision was 1.5%. Insulin was measured by direct chemiluminescence-based immunoassay (Liaison, DiaSorin, Saluggia, Italy). Insulin sensitivity was 0.5μIU/ml, while the intra- and inter-assay precisions were 3.9% and 4.3%, respectively. The HOMA-IR index was calculated for non-diabetic patients according to the Matthews formula18: HOMA-IR=glucose (mmol/l)×insulin (μU/ml)/22.5.
Statistical analysisThe data are expressed as the mean±the standard deviation (SD) for continuous variables of normal distribution or as the median and the 25th and 75th percentiles for non-parametric distribution variables, or as absolute frequencies and percentages for qualitative variables. Considering the baseline analysis of the data, qualitative variables among 2 or more groups were compared by using a chi-squared test or Fisher's exact test, depending on the data distribution. Quantitative variables between 2 groups were compared by using the Mann–Whitney U test or a Student's t-test, depending on the data distribution. Levene's test was used to compare response variability by group. Spearman's rank correlation coefficient was used to analyse the baseline linear association of 2 continuous variables. To evaluate the degree of agreement between 2 variables that evaluated the same concept, Pearson's bivariate correlations were used.
For the longitudinal analysis of the laboratory parameters studied based on 2 time points (baseline and yearly), a stratified analysis by modality and incidence of the response variable was performed first. The effect of the method, the incidence or prevalence and the interaction between them was estimated, and the adjustment of the model was considered by using generalised estimating equations (GEE) for longitudinal data. In order to analyse any association among the different laboratory parameters studied and the independent variables analysed (anthropometric and body-composition parameters estimated by BIA and DXA), the effect was estimated by using the Score Statistics For Type 3 GEE Analysis. Spearman's correlations were used to analyse the association of stratified variables, for which the sample size was small. The same study was performed for the analysis of the increase (delta) or the difference between the final and baseline values, although in this case the model was adjusted with a general linear model.
All statistical tests were considered two-sided, while significant values were considered those where p was less than 0.05. The data were analysed using SAS 9.3 (SAS Institute Inc., Cary, NC, USA).
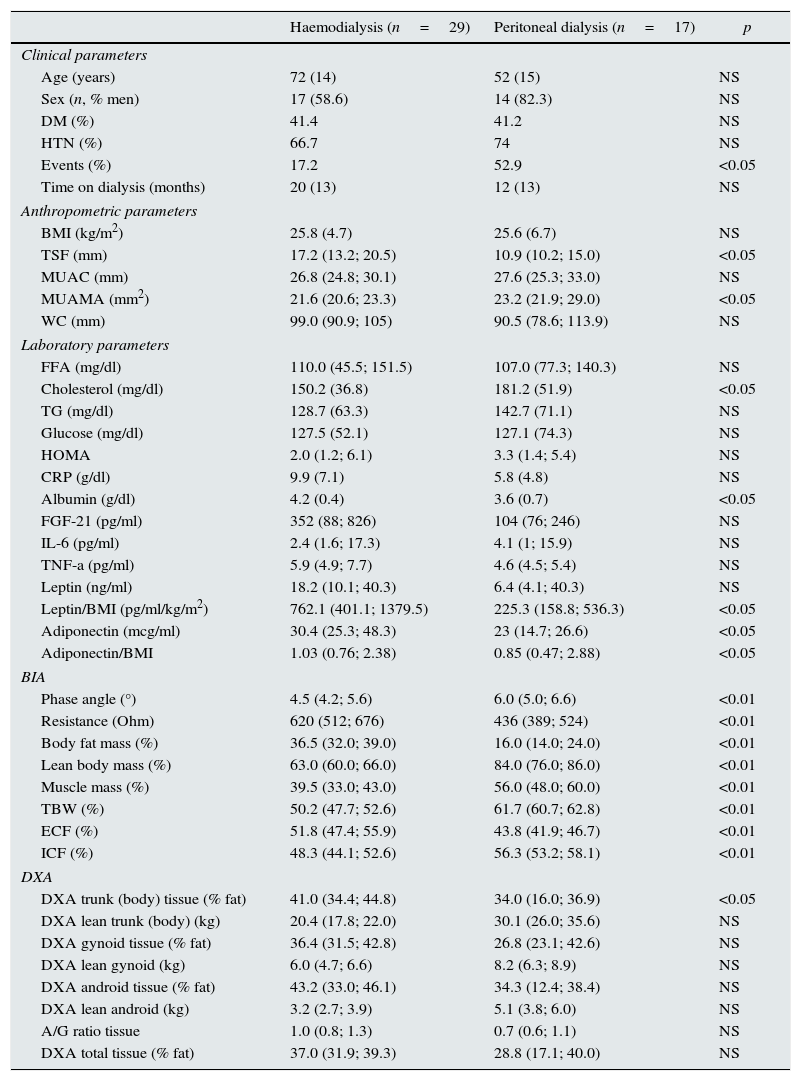
ResultsHaemodialysis versus peritoneal dialysisThe main clinical, laboratory and anthropometric characteristics of both groups are presented in Table 1. HD patients had a higher TSF and a lower MUAMA than PD patients. In terms of lab parameters, there were no differences between the groups, except for higher albumin and lower cholesterol in HD patients, despite the fact that these patients had been on dialysis for more time than PD patients.
Baseline clinical, biochemical, anthropometric and body-composition parameters studied from the aggregate sample of 46 patients, stratified by method of renal replacement therapy.
| Haemodialysis (n=29) | Peritoneal dialysis (n=17) | p | |
|---|---|---|---|
| Clinical parameters | |||
| Age (years) | 72 (14) | 52 (15) | NS |
| Sex (n, % men) | 17 (58.6) | 14 (82.3) | NS |
| DM (%) | 41.4 | 41.2 | NS |
| HTN (%) | 66.7 | 74 | NS |
| Events (%) | 17.2 | 52.9 | <0.05 |
| Time on dialysis (months) | 20 (13) | 12 (13) | NS |
| Anthropometric parameters | |||
| BMI (kg/m2) | 25.8 (4.7) | 25.6 (6.7) | NS |
| TSF (mm) | 17.2 (13.2; 20.5) | 10.9 (10.2; 15.0) | <0.05 |
| MUAC (mm) | 26.8 (24.8; 30.1) | 27.6 (25.3; 33.0) | NS |
| MUAMA (mm2) | 21.6 (20.6; 23.3) | 23.2 (21.9; 29.0) | <0.05 |
| WC (mm) | 99.0 (90.9; 105) | 90.5 (78.6; 113.9) | NS |
| Laboratory parameters | |||
| FFA (mg/dl) | 110.0 (45.5; 151.5) | 107.0 (77.3; 140.3) | NS |
| Cholesterol (mg/dl) | 150.2 (36.8) | 181.2 (51.9) | <0.05 |
| TG (mg/dl) | 128.7 (63.3) | 142.7 (71.1) | NS |
| Glucose (mg/dl) | 127.5 (52.1) | 127.1 (74.3) | NS |
| HOMA | 2.0 (1.2; 6.1) | 3.3 (1.4; 5.4) | NS |
| CRP (g/dl) | 9.9 (7.1) | 5.8 (4.8) | NS |
| Albumin (g/dl) | 4.2 (0.4) | 3.6 (0.7) | <0.05 |
| FGF-21 (pg/ml) | 352 (88; 826) | 104 (76; 246) | NS |
| IL-6 (pg/ml) | 2.4 (1.6; 17.3) | 4.1 (1; 15.9) | NS |
| TNF-a (pg/ml) | 5.9 (4.9; 7.7) | 4.6 (4.5; 5.4) | NS |
| Leptin (ng/ml) | 18.2 (10.1; 40.3) | 6.4 (4.1; 40.3) | NS |
| Leptin/BMI (pg/ml/kg/m2) | 762.1 (401.1; 1379.5) | 225.3 (158.8; 536.3) | <0.05 |
| Adiponectin (mcg/ml) | 30.4 (25.3; 48.3) | 23 (14.7; 26.6) | <0.05 |
| Adiponectin/BMI | 1.03 (0.76; 2.38) | 0.85 (0.47; 2.88) | <0.05 |
| BIA | |||
| Phase angle (°) | 4.5 (4.2; 5.6) | 6.0 (5.0; 6.6) | <0.01 |
| Resistance (Ohm) | 620 (512; 676) | 436 (389; 524) | <0.01 |
| Body fat mass (%) | 36.5 (32.0; 39.0) | 16.0 (14.0; 24.0) | <0.01 |
| Lean body mass (%) | 63.0 (60.0; 66.0) | 84.0 (76.0; 86.0) | <0.01 |
| Muscle mass (%) | 39.5 (33.0; 43.0) | 56.0 (48.0; 60.0) | <0.01 |
| TBW (%) | 50.2 (47.7; 52.6) | 61.7 (60.7; 62.8) | <0.01 |
| ECF (%) | 51.8 (47.4; 55.9) | 43.8 (41.9; 46.7) | <0.01 |
| ICF (%) | 48.3 (44.1; 52.6) | 56.3 (53.2; 58.1) | <0.01 |
| DXA | |||
| DXA trunk (body) tissue (% fat) | 41.0 (34.4; 44.8) | 34.0 (16.0; 36.9) | <0.05 |
| DXA lean trunk (body) (kg) | 20.4 (17.8; 22.0) | 30.1 (26.0; 35.6) | NS |
| DXA gynoid tissue (% fat) | 36.4 (31.5; 42.8) | 26.8 (23.1; 42.6) | NS |
| DXA lean gynoid (kg) | 6.0 (4.7; 6.6) | 8.2 (6.3; 8.9) | NS |
| DXA android tissue (% fat) | 43.2 (33.0; 46.1) | 34.3 (12.4; 38.4) | NS |
| DXA lean android (kg) | 3.2 (2.7; 3.9) | 5.1 (3.8; 6.0) | NS |
| A/G ratio tissue | 1.0 (0.8; 1.3) | 0.7 (0.6; 1.1) | NS |
| DXA total tissue (% fat) | 37.0 (31.9; 39.3) | 28.8 (17.1; 40.0) | NS |
The data are shown as mean (SD) for normal distribution variables and as median (p25; p75) for non-parametric variables.
TBW: total body water; ECF: extracellular fluid; FFA: free fatty acids; ICF: intracellular fluid; BIA: bioimpedance; MUAC: mid-upper arm circumference; WC: waist circumference; MUAMA: mid-upper arm muscle area; A/G ratio: android/gynoid fat ratio; DM: diabetes mellitus; DXA: dual-energy X-ray absorptiometry; FGF-21: fibroblast growth factor 21; HOMA: Homeostasis Model Assessment; IL-6: interleukin 6; BMI: body mass index; CRP: C-reactive protein; TSF: triceps skin fold; TG: triglycerides; TNF-a: tumour necrosis factor α; NS: not significant.
HD patients had a lower phase angle and higher resistance than PD patients. In addition, they had a higher percentage of BFM, and less muscle mass (MM) and LBM. HD patients showed a lower percent of body-water: the differences in total body water (TBW), extracellular fluid (ECF) and intracellular fluid (ICF) were statistically significant. Regarding DXA parameters, HD patients had a higher percentage of fat in the trunk as compared with PD patients.
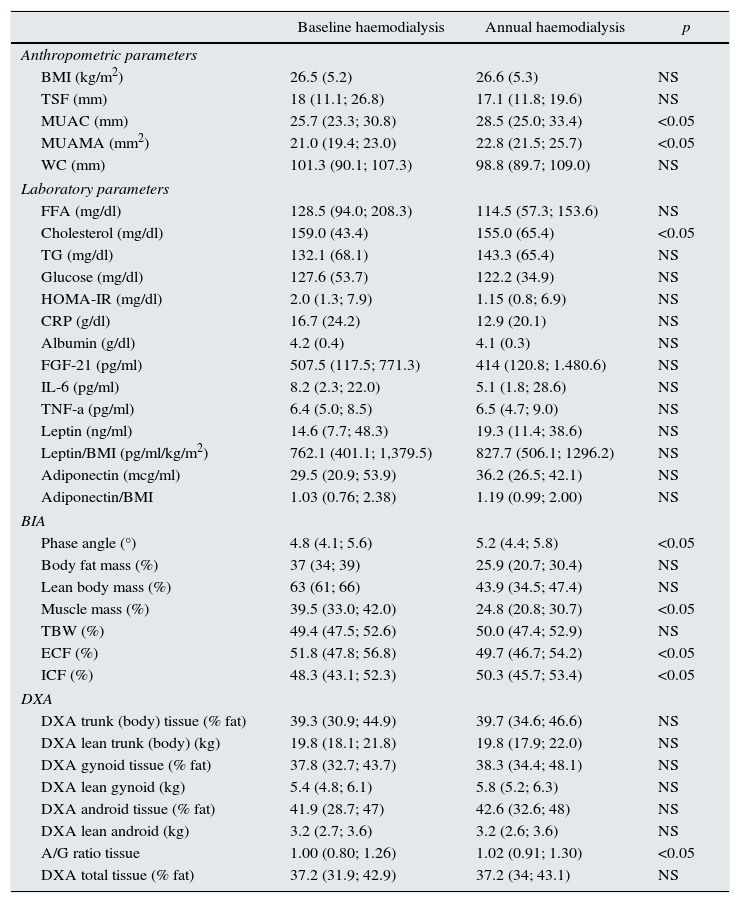
Longitudinal study in haemodialysisIn the longitudinal study performed in 18 HD patients, there was an increase in mid-upper arm circumference (MUAC) and MUAMA (Table 2). No significant differences were found in the laboratory parameters, except for cholesterol. An increase in phase angle and ICF, as well as the ratio between the percentage of android/gynoid (A/G) distribution fat measured by DXA (cardiovascular risk indicator), was observed. There was also a decrease in the percentages of MM and ECF.
Biochemical, anthropometric and body composition parameters studied in 18 haemodialysis patients, stratified by baseline and annual samples.
| Baseline haemodialysis | Annual haemodialysis | p | |
|---|---|---|---|
| Anthropometric parameters | |||
| BMI (kg/m2) | 26.5 (5.2) | 26.6 (5.3) | NS |
| TSF (mm) | 18 (11.1; 26.8) | 17.1 (11.8; 19.6) | NS |
| MUAC (mm) | 25.7 (23.3; 30.8) | 28.5 (25.0; 33.4) | <0.05 |
| MUAMA (mm2) | 21.0 (19.4; 23.0) | 22.8 (21.5; 25.7) | <0.05 |
| WC (mm) | 101.3 (90.1; 107.3) | 98.8 (89.7; 109.0) | NS |
| Laboratory parameters | |||
| FFA (mg/dl) | 128.5 (94.0; 208.3) | 114.5 (57.3; 153.6) | NS |
| Cholesterol (mg/dl) | 159.0 (43.4) | 155.0 (65.4) | <0.05 |
| TG (mg/dl) | 132.1 (68.1) | 143.3 (65.4) | NS |
| Glucose (mg/dl) | 127.6 (53.7) | 122.2 (34.9) | NS |
| HOMA-IR (mg/dl) | 2.0 (1.3; 7.9) | 1.15 (0.8; 6.9) | NS |
| CRP (g/dl) | 16.7 (24.2) | 12.9 (20.1) | NS |
| Albumin (g/dl) | 4.2 (0.4) | 4.1 (0.3) | NS |
| FGF-21 (pg/ml) | 507.5 (117.5; 771.3) | 414 (120.8; 1.480.6) | NS |
| IL-6 (pg/ml) | 8.2 (2.3; 22.0) | 5.1 (1.8; 28.6) | NS |
| TNF-a (pg/ml) | 6.4 (5.0; 8.5) | 6.5 (4.7; 9.0) | NS |
| Leptin (ng/ml) | 14.6 (7.7; 48.3) | 19.3 (11.4; 38.6) | NS |
| Leptin/BMI (pg/ml/kg/m2) | 762.1 (401.1; 1,379.5) | 827.7 (506.1; 1296.2) | NS |
| Adiponectin (mcg/ml) | 29.5 (20.9; 53.9) | 36.2 (26.5; 42.1) | NS |
| Adiponectin/BMI | 1.03 (0.76; 2.38) | 1.19 (0.99; 2.00) | NS |
| BIA | |||
| Phase angle (°) | 4.8 (4.1; 5.6) | 5.2 (4.4; 5.8) | <0.05 |
| Body fat mass (%) | 37 (34; 39) | 25.9 (20.7; 30.4) | NS |
| Lean body mass (%) | 63 (61; 66) | 43.9 (34.5; 47.4) | NS |
| Muscle mass (%) | 39.5 (33.0; 42.0) | 24.8 (20.8; 30.7) | <0.05 |
| TBW (%) | 49.4 (47.5; 52.6) | 50.0 (47.4; 52.9) | NS |
| ECF (%) | 51.8 (47.8; 56.8) | 49.7 (46.7; 54.2) | <0.05 |
| ICF (%) | 48.3 (43.1; 52.3) | 50.3 (45.7; 53.4) | <0.05 |
| DXA | |||
| DXA trunk (body) tissue (% fat) | 39.3 (30.9; 44.9) | 39.7 (34.6; 46.6) | NS |
| DXA lean trunk (body) (kg) | 19.8 (18.1; 21.8) | 19.8 (17.9; 22.0) | NS |
| DXA gynoid tissue (% fat) | 37.8 (32.7; 43.7) | 38.3 (34.4; 48.1) | NS |
| DXA lean gynoid (kg) | 5.4 (4.8; 6.1) | 5.8 (5.2; 6.3) | NS |
| DXA android tissue (% fat) | 41.9 (28.7; 47) | 42.6 (32.6; 48) | NS |
| DXA lean android (kg) | 3.2 (2.7; 3.6) | 3.2 (2.6; 3.6) | NS |
| A/G ratio tissue | 1.00 (0.80; 1.26) | 1.02 (0.91; 1.30) | <0.05 |
| DXA total tissue (% fat) | 37.2 (31.9; 42.9) | 37.2 (34; 43.1) | NS |
The data are shown as mean (SD) for normal distribution variables and as median (p25; p75) for non-parametric variables.
TBW: total body water; ECF: extracellular fluid; FFA: free fatty acids; ICF: intracellular fluid; BIA: bioimpedance; MUAC: mid-upper arm circumference; WC: waist circumference; MUAMA: mid-upper arm muscle area; A/G ratio: android/gynoid fat ratio; DM: diabetes mellitus; DXA: dual-energy X-ray absorptiometry; FGF-21: fibroblast growth factor 21; HOMA: Homeostasis Model Assessment; IL-6: interleukin 6; BMI: body mass index; CRP: C-reactive protein; TSF: triceps skin fold; TG: triglycerides; TNF-a: tumour necrosis factor α; NS: not significant.
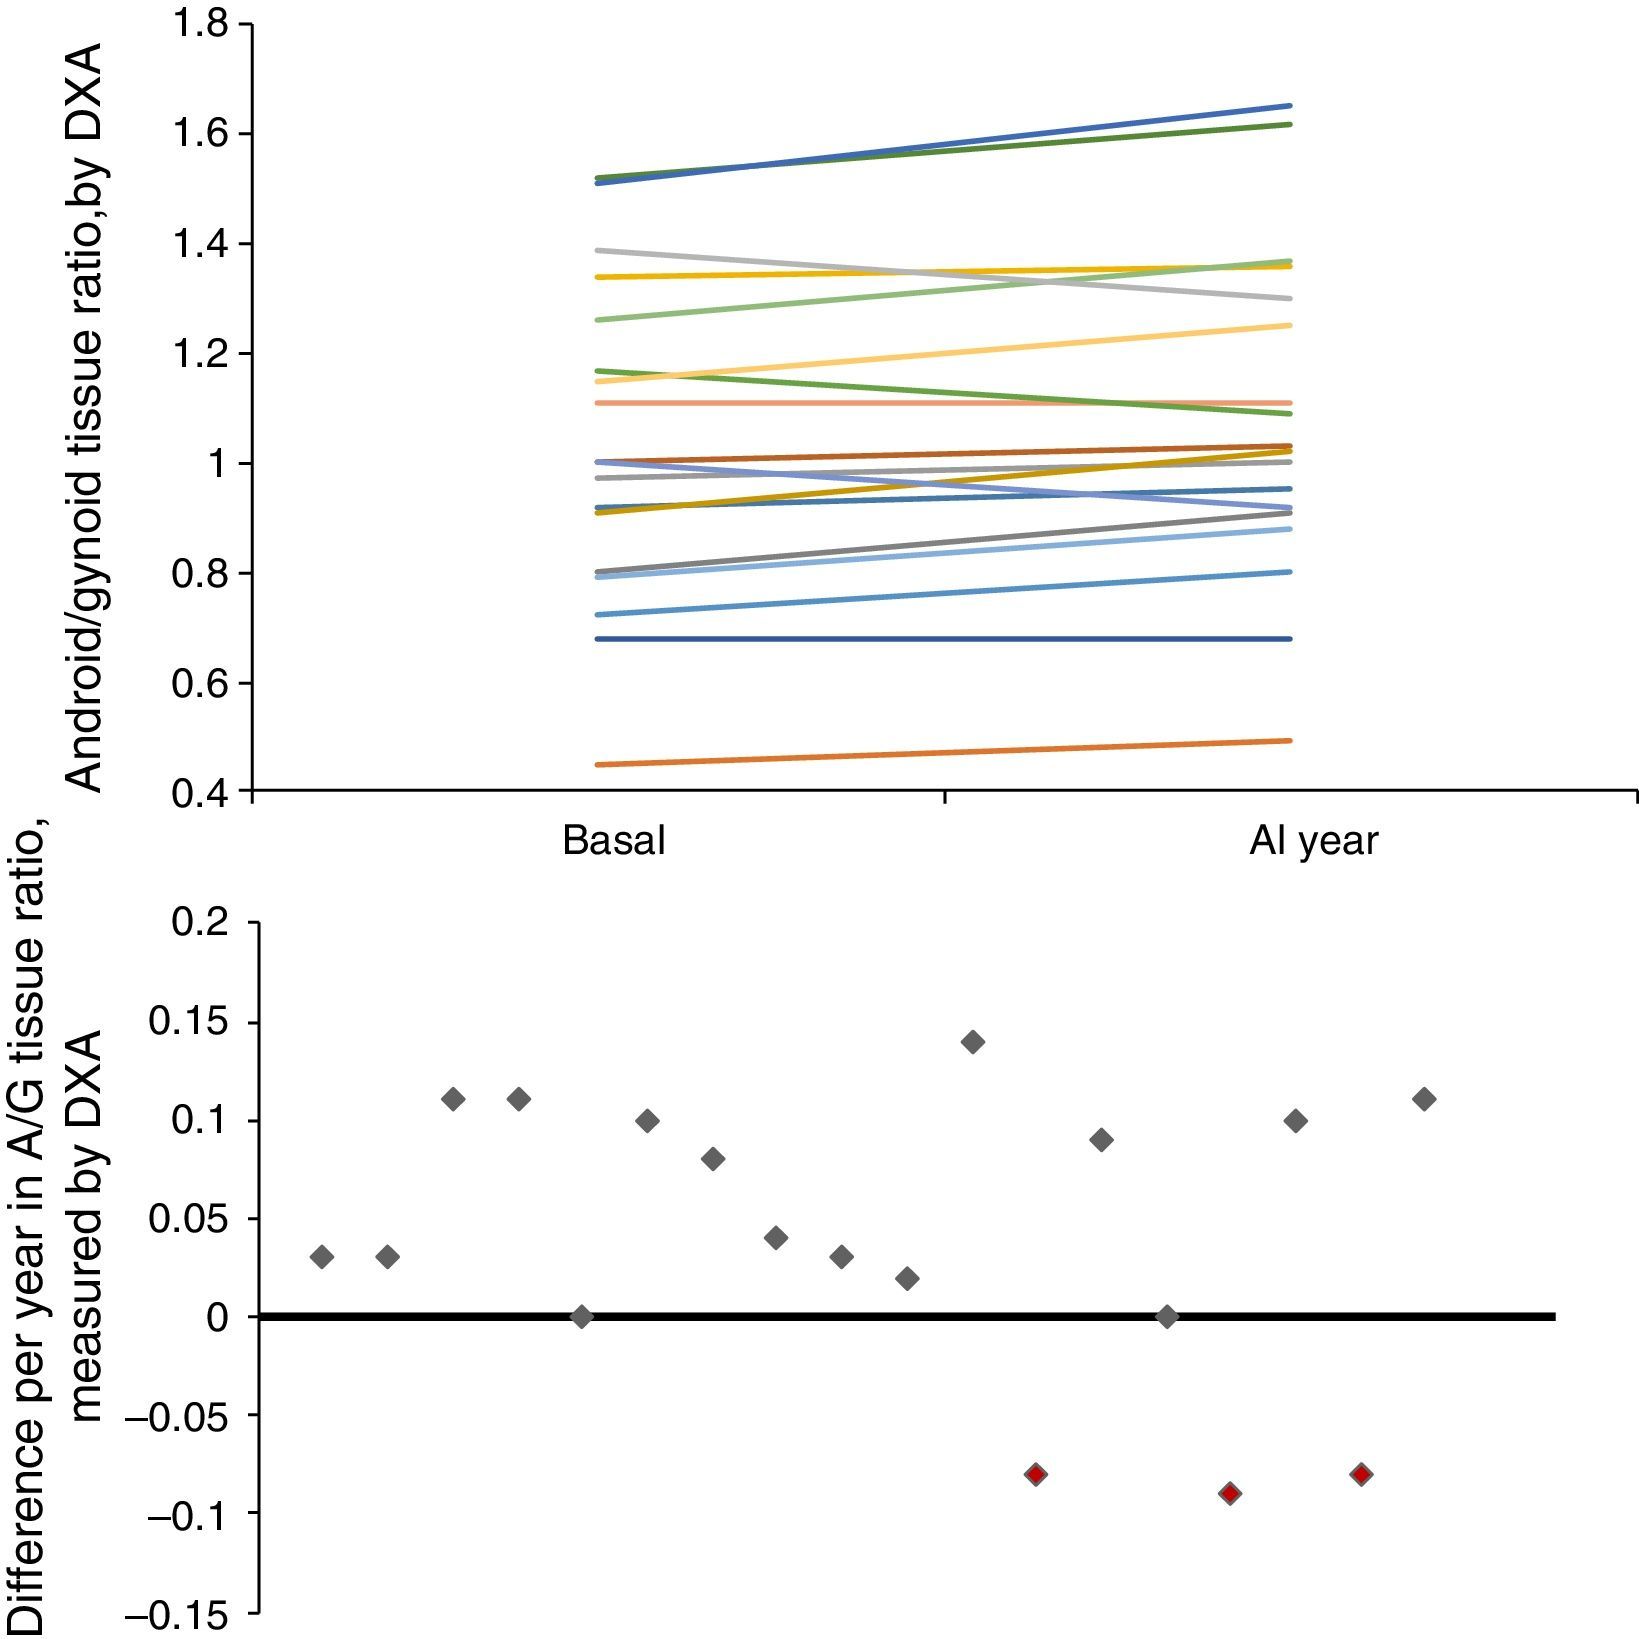
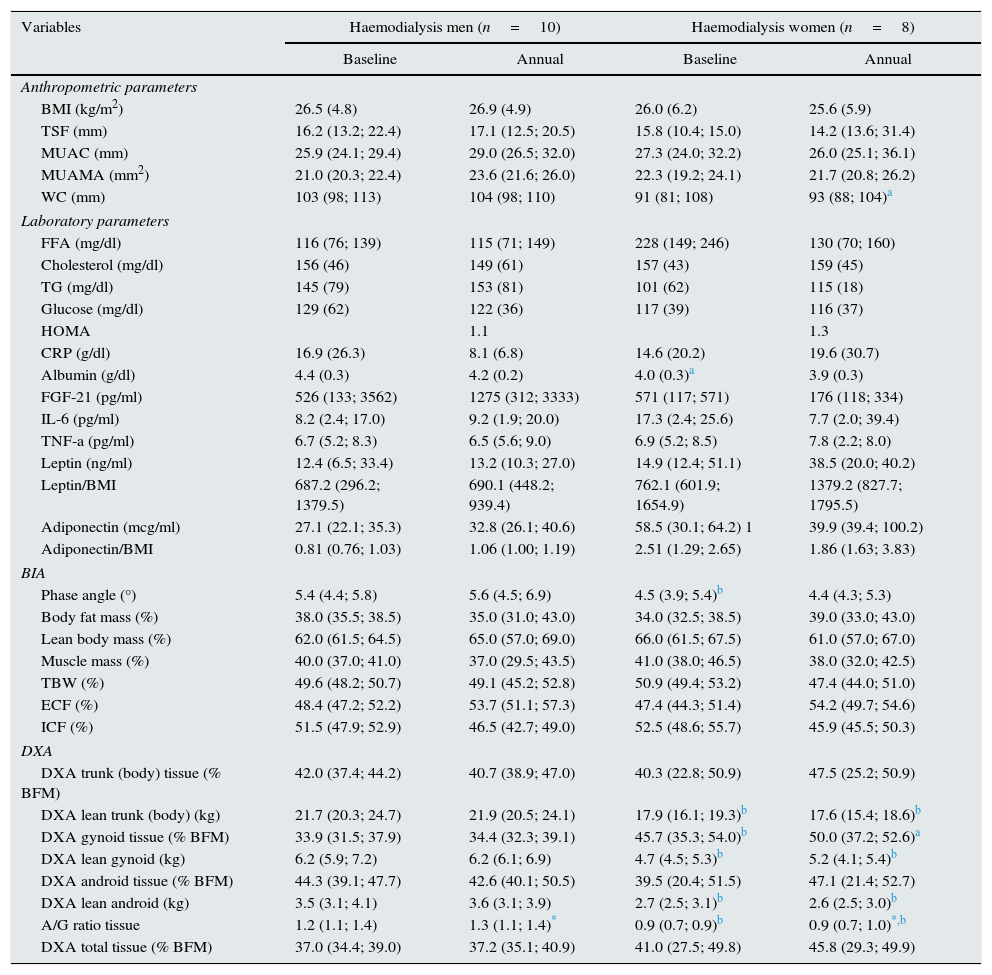
Given that gender affects body composition, Table 3 shows the same data, but separated by gender. In men, there was an increase in MUAMA per year. No statistically significant changes were seen in body composition as estimated by DXA, except for the increase in the A/G fat ratio. In women, no significant differences were found in the anthropometric, laboratory or body-composition parameters measured by BIA. Although there was a trend towards an increase in fat in all the parameters studied (Fig. 1), only the increase in the A/G fat ratio was statistically significant.
Demographic, biochemical, anthropometric and body composition parameters studied in 18 haemodialysis patients, stratified by sex and monitored for one year.
| Variables | Haemodialysis men (n=10) | Haemodialysis women (n=8) | ||
|---|---|---|---|---|
| Baseline | Annual | Baseline | Annual | |
| Anthropometric parameters | ||||
| BMI (kg/m2) | 26.5 (4.8) | 26.9 (4.9) | 26.0 (6.2) | 25.6 (5.9) |
| TSF (mm) | 16.2 (13.2; 22.4) | 17.1 (12.5; 20.5) | 15.8 (10.4; 15.0) | 14.2 (13.6; 31.4) |
| MUAC (mm) | 25.9 (24.1; 29.4) | 29.0 (26.5; 32.0) | 27.3 (24.0; 32.2) | 26.0 (25.1; 36.1) |
| MUAMA (mm2) | 21.0 (20.3; 22.4) | 23.6 (21.6; 26.0) | 22.3 (19.2; 24.1) | 21.7 (20.8; 26.2) |
| WC (mm) | 103 (98; 113) | 104 (98; 110) | 91 (81; 108) | 93 (88; 104)a |
| Laboratory parameters | ||||
| FFA (mg/dl) | 116 (76; 139) | 115 (71; 149) | 228 (149; 246) | 130 (70; 160) |
| Cholesterol (mg/dl) | 156 (46) | 149 (61) | 157 (43) | 159 (45) |
| TG (mg/dl) | 145 (79) | 153 (81) | 101 (62) | 115 (18) |
| Glucose (mg/dl) | 129 (62) | 122 (36) | 117 (39) | 116 (37) |
| HOMA | 1.1 | 1.3 | ||
| CRP (g/dl) | 16.9 (26.3) | 8.1 (6.8) | 14.6 (20.2) | 19.6 (30.7) |
| Albumin (g/dl) | 4.4 (0.3) | 4.2 (0.2) | 4.0 (0.3)a | 3.9 (0.3) |
| FGF-21 (pg/ml) | 526 (133; 3562) | 1275 (312; 3333) | 571 (117; 571) | 176 (118; 334) |
| IL-6 (pg/ml) | 8.2 (2.4; 17.0) | 9.2 (1.9; 20.0) | 17.3 (2.4; 25.6) | 7.7 (2.0; 39.4) |
| TNF-a (pg/ml) | 6.7 (5.2; 8.3) | 6.5 (5.6; 9.0) | 6.9 (5.2; 8.5) | 7.8 (2.2; 8.0) |
| Leptin (ng/ml) | 12.4 (6.5; 33.4) | 13.2 (10.3; 27.0) | 14.9 (12.4; 51.1) | 38.5 (20.0; 40.2) |
| Leptin/BMI | 687.2 (296.2; 1379.5) | 690.1 (448.2; 939.4) | 762.1 (601.9; 1654.9) | 1379.2 (827.7; 1795.5) |
| Adiponectin (mcg/ml) | 27.1 (22.1; 35.3) | 32.8 (26.1; 40.6) | 58.5 (30.1; 64.2) 1 | 39.9 (39.4; 100.2) |
| Adiponectin/BMI | 0.81 (0.76; 1.03) | 1.06 (1.00; 1.19) | 2.51 (1.29; 2.65) | 1.86 (1.63; 3.83) |
| BIA | ||||
| Phase angle (°) | 5.4 (4.4; 5.8) | 5.6 (4.5; 6.9) | 4.5 (3.9; 5.4)b | 4.4 (4.3; 5.3) |
| Body fat mass (%) | 38.0 (35.5; 38.5) | 35.0 (31.0; 43.0) | 34.0 (32.5; 38.5) | 39.0 (33.0; 43.0) |
| Lean body mass (%) | 62.0 (61.5; 64.5) | 65.0 (57.0; 69.0) | 66.0 (61.5; 67.5) | 61.0 (57.0; 67.0) |
| Muscle mass (%) | 40.0 (37.0; 41.0) | 37.0 (29.5; 43.5) | 41.0 (38.0; 46.5) | 38.0 (32.0; 42.5) |
| TBW (%) | 49.6 (48.2; 50.7) | 49.1 (45.2; 52.8) | 50.9 (49.4; 53.2) | 47.4 (44.0; 51.0) |
| ECF (%) | 48.4 (47.2; 52.2) | 53.7 (51.1; 57.3) | 47.4 (44.3; 51.4) | 54.2 (49.7; 54.6) |
| ICF (%) | 51.5 (47.9; 52.9) | 46.5 (42.7; 49.0) | 52.5 (48.6; 55.7) | 45.9 (45.5; 50.3) |
| DXA | ||||
| DXA trunk (body) tissue (% BFM) | 42.0 (37.4; 44.2) | 40.7 (38.9; 47.0) | 40.3 (22.8; 50.9) | 47.5 (25.2; 50.9) |
| DXA lean trunk (body) (kg) | 21.7 (20.3; 24.7) | 21.9 (20.5; 24.1) | 17.9 (16.1; 19.3)b | 17.6 (15.4; 18.6)b |
| DXA gynoid tissue (% BFM) | 33.9 (31.5; 37.9) | 34.4 (32.3; 39.1) | 45.7 (35.3; 54.0)b | 50.0 (37.2; 52.6)a |
| DXA lean gynoid (kg) | 6.2 (5.9; 7.2) | 6.2 (6.1; 6.9) | 4.7 (4.5; 5.3)b | 5.2 (4.1; 5.4)b |
| DXA android tissue (% BFM) | 44.3 (39.1; 47.7) | 42.6 (40.1; 50.5) | 39.5 (20.4; 51.5) | 47.1 (21.4; 52.7) |
| DXA lean android (kg) | 3.5 (3.1; 4.1) | 3.6 (3.1; 3.9) | 2.7 (2.5; 3.1)b | 2.6 (2.5; 3.0)b |
| A/G ratio tissue | 1.2 (1.1; 1.4) | 1.3 (1.1; 1.4)* | 0.9 (0.7; 0.9)b | 0.9 (0.7; 1.0)*,b |
| DXA total tissue (% BFM) | 37.0 (34.4; 39.0) | 37.2 (35.1; 40.9) | 41.0 (27.5; 49.8) | 45.8 (29.3; 49.9) |
The data are shown as mean (SD) for normal distribution variables and as median (p25; p75) for non-parametric variables.
TBW: total body water; ECF: extracellular fluid; FFA: free fatty acids; ICF: intracellular fluid; BIA: bioimpedance; MUAC: mid-upper arm circumference; WC: waist circumference; MUAMA: mid-upper arm muscle area; A/G ratio: android/gynoid fat ratio; DM: diabetes mellitus; DXA: dual-energy X-ray absorptiometry; FGF-21: fibroblast growth factor 21; HOMA: Homeostasis Model Assessment; IL-6: interleukin 6; BMI: body mass index; CRP: C-reactive protein; TSF: triceps skin fold; TG: triglycerides; TNF-a: tumour necrosis factor α.
.")
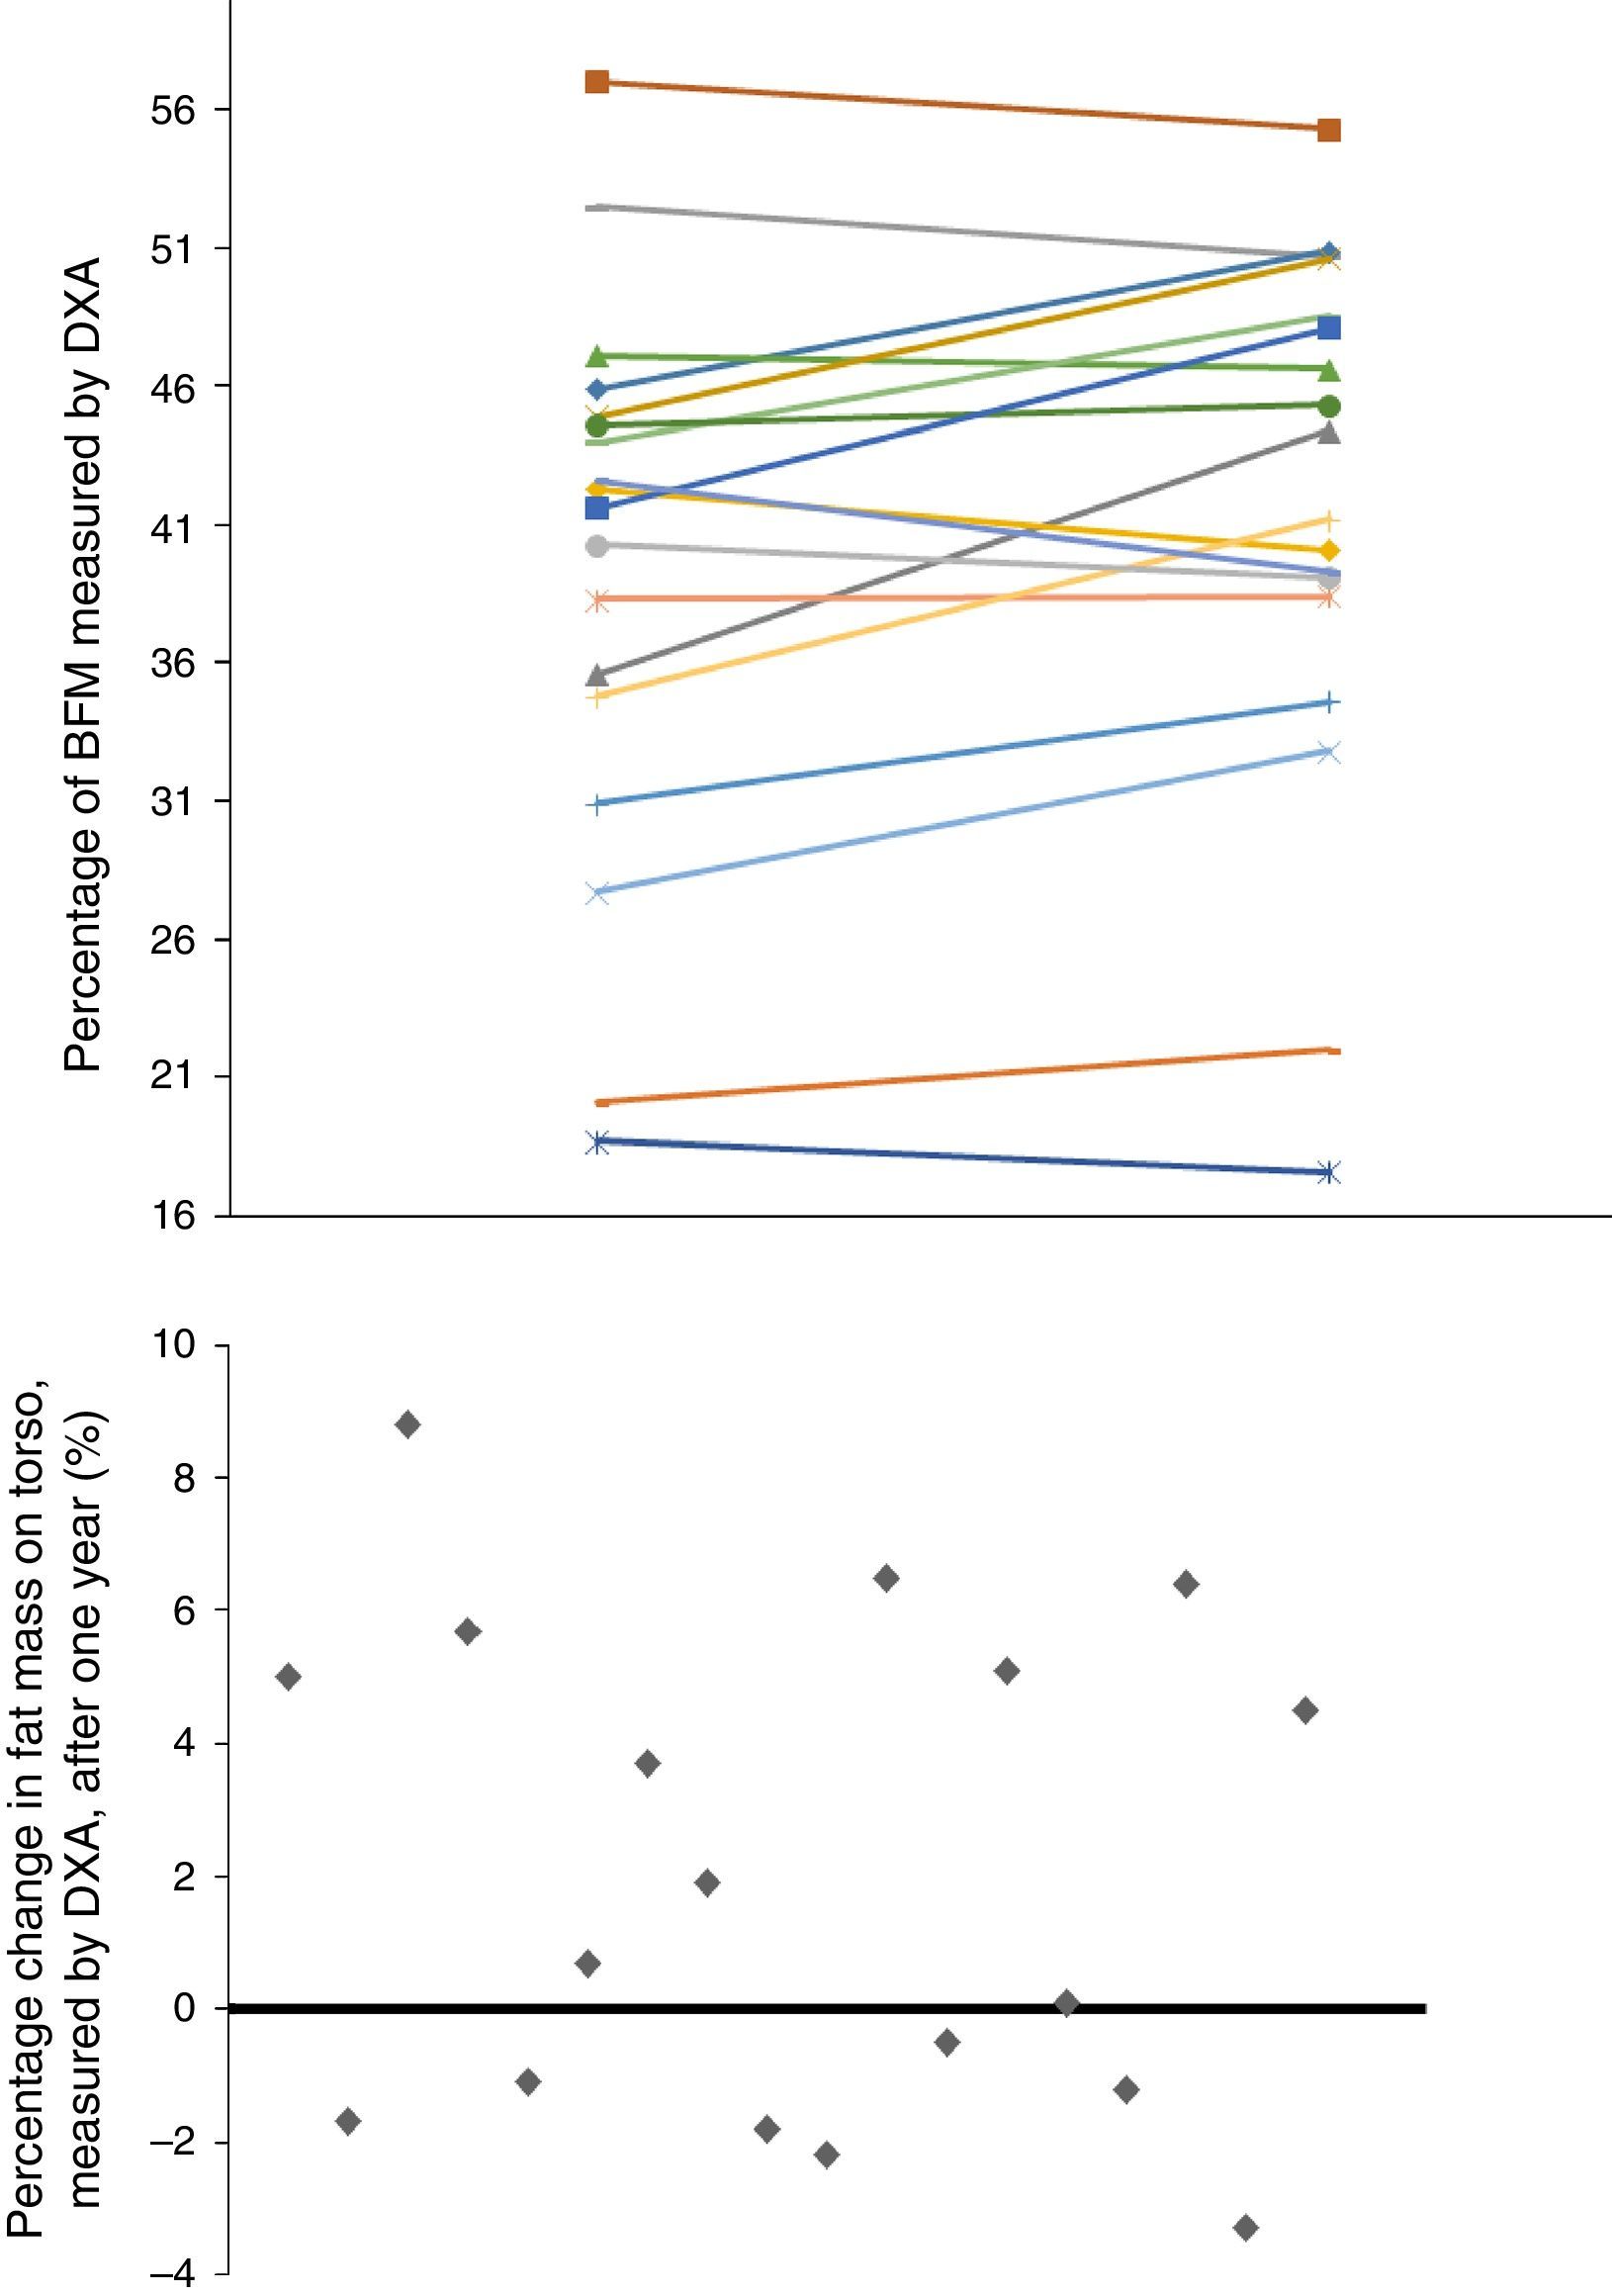
Baseline anthropometric or laboratory parameters in men and women were not significantly different, except for albumin and adiponectin values (Table 3). Significant differences were found in almost all the body-composition parameters measured by BIA and in most measured by DXA. Contrary to what it was expected, men had a higher percentage of BFM as compared with women at baseline; this difference was no longer present after one year of follow up because of a trend towards a gain in BFM (especially in women), (Fig. 2). DEXA showed that women had a statistically significant increase in the percentage of BFM at all levels (trunk, android and gynoid); however the A/G ratio was higher in men and it continued to increase during the year of follow-up (Fig. 2).
.")
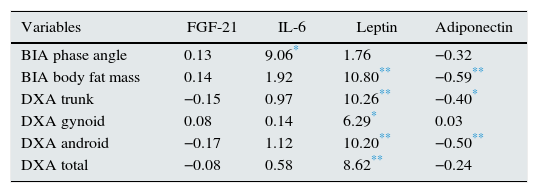
Men and women showed no significant differences in baseline leptin and adiponectin values, nor at one year of follow up. This is despite the trend towards an increase in leptin in women and in adiponectin in men. A statistically significant relationship was found between leptin and adiponectin concentrations, with both the percentage of fat mass measured by BIA and abdominal fat estimated by DXA (Table 4). In the models estimated, a direct relationship was found between the percent of BFM (measured by BIA or DXA) and leptin levels, as well as an inverse relationship between the percent of BFM and adiponectin levels. In both cases the relationships were statistically significant.
Estimate using a generalised estimating equation of the effect of association between body composition parameters (measured by bioimpedance and dual-energy X-ray absorptiometry) and adipocytokines studied in 18 haemodialysis patients.
| Variables | FGF-21 | IL-6 | Leptin | Adiponectin |
|---|---|---|---|---|
| BIA phase angle | 0.13 | 9.06* | 1.76 | −0.32 |
| BIA body fat mass | 0.14 | 1.92 | 10.80** | −0.59** |
| DXA trunk | −0.15 | 0.97 | 10.26** | −0.40* |
| DXA gynoid | 0.08 | 0.14 | 6.29* | 0.03 |
| DXA android | −0.17 | 1.12 | 10.20** | −0.50** |
| DXA total | −0.08 | 0.58 | 8.62** | −0.24 |
The effect between variables was analysed using a generalised estimating equation model from the “Score Statistics For Type 3 GEE Analysis” (coefficientβ).
BIA: bioimpedance; DXA: dual-energy X-ray absorptiometry; FGF-21: fibroblast growth factor 21; IL-6: interleukin 6.
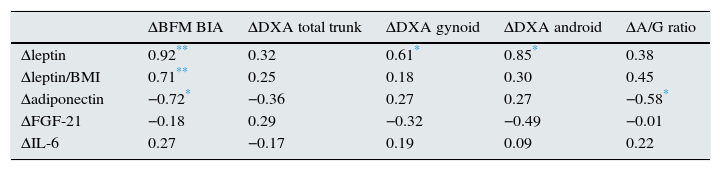
In addition, increment in these adipocytokines correlated with the percentage change in BFM (Table 5). There was a statistically significant correlation between the baseline A/G fat ratio and leptin levels, as well as an inverse relationship – also statistically significant – between the baseline A/G fat ratio and adiponectin levels corrected for BMI. This later correlation was also observed after a year of follow-up. However such a correlation was not observed with leptin. There were no significant differences in the longitudinal study in serum FGF-21 concentrations in the overall population or in the subgroups by gender.
Matrix of correlation between the variation of body composition parameters at one year, measured in the 18 haemodialysis patients using bioimpedance and dual-energy X-ray absorptiometry, and the increase in adipocytokines studied.
| ΔBFM BIA | ΔDXA total trunk | ΔDXA gynoid | ΔDXA android | ΔA/G ratio | |
|---|---|---|---|---|---|
| Δleptin | 0.92** | 0.32 | 0.61* | 0.85* | 0.38 |
| Δleptin/BMI | 0.71** | 0.25 | 0.18 | 0.30 | 0.45 |
| Δadiponectin | −0.72* | −0.36 | 0.27 | 0.27 | −0.58* |
| ΔFGF-21 | −0.18 | 0.29 | −0.32 | −0.49 | −0.01 |
| ΔIL-6 | 0.27 | −0.17 | 0.19 | 0.09 | 0.22 |
The variables are expressed as correlation coefficients for non-parametric data (Spearman's rho).
BIA: bioimpedance; BFM: body fat mass; A/G ratio: android/gynoid tissue ratio; DXA: dual-energy X-ray absorptiometry; FGF-21: fibroblast growth factor 21; IL-6: interleukin 6; BMI: body mass index; Δ: increment or delta.
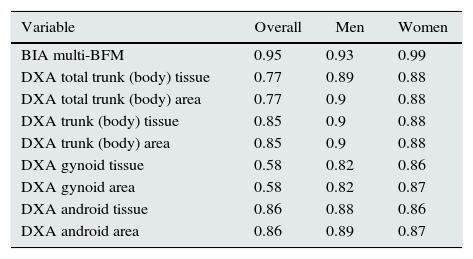
Regarding the second objective of our study, a significant correlation was found between the fat-mass parameters quantified by BIA and DXA (Table 6), thus indicating a good concordance between both methods of body-composition measurement.
Evaluation of the degree of concordance (measured using Pearson's bivariate correlations) between the body fat mass measurement, estimated using single-frequency bioimpedance and other body composition techniques (multifrequency bioimpedance and dual-energy X-ray absorptiometry), in 29 HD patients.
| Variable | Overall | Men | Women |
|---|---|---|---|
| BIA multi-BFM | 0.95 | 0.93 | 0.99 |
| DXA total trunk (body) tissue | 0.77 | 0.89 | 0.88 |
| DXA total trunk (body) area | 0.77 | 0.9 | 0.88 |
| DXA trunk (body) tissue | 0.85 | 0.9 | 0.88 |
| DXA trunk (body) area | 0.85 | 0.9 | 0.88 |
| DXA gynoid tissue | 0.58 | 0.82 | 0.86 |
| DXA gynoid area | 0.58 | 0.82 | 0.87 |
| DXA android tissue | 0.86 | 0.88 | 0.86 |
| DXA android area | 0.86 | 0.89 | 0.87 |
The variables are expressed as Pearson's correlation coefficients, comparing the different variables against body fat mass estimated using bioimpedance vector analysis. All correlations were significant (p<0.001).
BFM: body fat mass; HD: haemodialysis.
The results of the present study show that fat gain occurs in patients on HD over time, even during limited follow-up periods, such as one year. This gain is clearly of abdominal distribution, which increases CV risk associated with the time on dialysis.
We were also able to verify that the changes in body-composition parameters (BFM gains or losses) during the follow-up were correlated with the changes in the adipocytokine concentrations analysed in these patients.
There is only one study that has analysed changes in body composition in HD patients using DXA.19 It was performed in 72 Japanese HD, patients who underwent DXA at baseline and after one year, and in whom a mean increase of 118±26g/month of fat mass was observed. Unlike our study, they did not find differences by gender, and they described a negative correlation with baseline albumin and with basal BFM.
According to the studies by Vague20 on the distribution patterns of BFM and their association with metabolic disorders, the android, or predominantly abdominal, distribution of body fat has a greater clinical significance, given its association with an increase in CV risk. The proportion of A/G pelvic fat is the ratio between the percentage of android and gynoid fat. Excess abdominal fat (android) is associated with several CV risk factors.21 Measuring the A/G ratio by DXA is a simple and practical tool for assessing the distribution of pelvic fat. This relationship may play a role in assessing CV risk in overweight patients.15,22
The uraemic medium contributes to the retention of adipocytokines, systemic inflammation, oxidative stress and insulin resistance.23,24 Experimental data indicate that uraemia reduces lipogenesis and increased lipolysis, which may result in the redistribution of body fat. Our results show a statistically significant increase in plasma levels of leptin and a decrease in plasma levels of adiponectin, even after adjusting their levels for BMI in HD patients. It should be noticed that the elevated adiponectin levels, which according to some studies, are related to an increase in mortality.25 In a study by Rhee et al. in 501 patients on HD, it was demonstrated that adiponectin levels greater than 30mcg/ml were associated with a 3-fold increase in the risk of all-cause mortality.26
A secondary objective of our study was to validate the data obtained by BIA (a technique commonly used in clinical practice) with those obtained by DXA (gold standard for the study of body composition). Our data indicate the existence of a strong correlation between the body-composition parameters (percentage of fat mass) obtained from both techniques.
BIA is used to study the nutritional and hydration status of HD patients, which helps to adjust the ultrafiltration volume and the MM or BFM are determined. In recent years, LBM and change in LBM have been related with the survival rate of HD patients.27 The relationship between phase angle measured by BIA and survival has been described in the literature, but it is not clear whether this relationship is linked to nutritional status. Some authors have shown that patients with the smallest phase angles have a higher mortality regardless of other factors.28,29 According to the study by Di Gioia,30 an angle greater than 4.85° in HD seems to be an indicator of a good prognosis.
DXA15 is a technique that allows the measurement of for body-fat content via the emission of low doses of radiation, based on the attenuation difference of 2 energy levels for bone, fat and soft tissues. It is a reference technique, since whole-body scans allow regional measurements of BFM.16 A software associated with the equipment allows to select a region to be studied by placing the ROI. As a technique for studying body composition, DXA is useful for estimating trunk and abdominal fat, but it does not allow for a precise assessment of subcutaneous and intra-abdominal visceral and perivisceral fat compartments.
There are few published studies comparing BIA and DXA in dialysis patients. In 1993, Formica et al.31 performed the first study with 42 dialysis patients to formulate equations to estimate LBM and BFM using BIA. Another study by Donadio compared the concordance among different measurements of body composition using BIA and DXA in 27 Italian patients on HD.32 By contrast, Abrahamsen33 found differences between the assessment of body composition by DXA or by BIA; in their study of 19 patients on HD, DXA showed greater accuracy in LBM estimation. It is not possible to adequately compare the results obtained in this study with ours, because of the difference in the units of measurement, but the patients in Abrahamsen's study appeared to have lower percentages of BFM than those obtained in ours. As far as we can say, this is the first study of these characteristics to be carried out in the Spanish dialysis population.
The small sample size and the difficulty in measuring some parameters are the main limitations of our study. The number of admissions, the impact of the dialysis technique, and the dosages of dialysis were not assessed, although all patients had an adequate dose of dialysis. In the longitudinal study, only patients who had all their anthropometric measurements recorded, both at baseline and at 12 months, were analysed. Owing to these limitations, our results should be interpreted with caution. Nevertheless, we have been able to demonstrate a gain in abdominal fat in HD patients (with the associated increase in CV risk) and its statistically significant association with changes in plasma levels of adipocytokines.
In conclusion, there is fat gain in general, particularly in abdomen, as the time patients on dialysis increases, which may, in part, explain the increase in CV risk in patients with kidney failure; the A/G ratio is the most sensitive parameter for estimating this risk. There is also a strong correlation between the different methods of body-composition assessment (BIA and DXA).
Conflicts of interestThe authors declare that they have no conflicts of interest.
Please cite this article as: González E, Díez JJ, Pérez Torres A, Bajo MA, del Peso G, Sánchez-Villanueva R, et al. Composición corporal y concentraciones de adipocitoquinas en hemodiálisis: la ganancia de grasa abdominal como factor de riesgo cardiovascular añadido. Ganancia de grasa y riesgo cardiovascular. Nefrologia. 2017;37:138–148.


