Circumstances such as gender, age, diabetes mellitus (DM) and renal failure impact on the body composition of patients. However, we use nutritional parameters such as lean and fat tissue with reference values from healthy subjects to assess the nutritional status of haemodialysis (HD) patients.
AimsTo analyse body composition by bioimpedance spectroscopy (BIS) of 6395 HD patients in order to obtain reference values of lean tissue index (LTI) and fat tissue index (FTI) from HD patients; and to confirm its validity by showing that those patients with LTI below the 10th percentile calculated for their group have greatest risk of death.
Material and methodsWe used the BIS to determine the LTI and FTI in our cohort of HD patients in Spain. We calculated the 10th percentile and 90th percentile of LTI and FTI in each age decile for patients grouped by gender and presence of DM. We collected clinical, laboratory and demographic parameters.
ResultsThe LTI/FTI 10 and 90 percentile values varied by group (age, gender and presence of DM) and, after adjusting for other risk factors such as fluid overload, those patients with LTI lower than percentile 10 had a higher relative risk of death (OR 1.57) than those patients with higher values.
ConclusionsMonitoring the LTI and FTI of patients on HD using suitable reference values may help to identify risk in this patient population.
Circunstancias como el género, la edad, la presencia de diabetes mellitus (DM) y la insuficiencia renal tienen impacto sobre la composición corporal de los pacientes. Sin embargo, a la hora de evaluar parámetros nutricionales como el tejido magro y graso de los pacientes en hemodiálisis (HD) se emplean valores de referencia provenientes de población sana.
ObjetivosAnalizar la composición corporal mediante bioimpedancia espectroscópica (BIS) de 6.395 pacientes en HD para obtener valores de referencia de índice de tejido magro (ITM) y de índice de tejido graso (ITG) procedentes de pacientes en HD y confirmar su validez al demostrar que aquellos con un ITM por debajo del percentil 10 calculado para su grupo tienen mayor riesgo de muerte.
Material y métodosUsamos la BIS para determinar el ITM e ITG de nuestra cohorte de pacientes en HD en España. Calculamos el percentil 10 y el percentil 90 del ITM e ITG en cada decil de edad de pacientes, agrupados según su género y presencia de DM. Recogemos parámetros clínicos, analíticos y demográficos.
ResultadosObjetivamos que los valores del percentil 10 y del 90 de ITM/ITG varían en función del grupo (edad, género y presencia de DM) y que, tras ajustar por otros factores de riesgo como la sobrehidratación, los pacientes con ITM inferior al percentil 10 tienen mayor riesgo relativo de muerte (OR 1,57) que aquellos con valores superiores.
ConclusionesMonitorizar el ITM e ITG de los pacientes en HD con adecuados valores de referencia puede ser útil para identificar situaciones de riesgo en los pacientes en HD.
Circumstances such as age,1–5 gender,5,6 diabetes mellitus (DM)1,5,7 or kidney failure8,9 have an impact on patients’ body composition. In fact, older patients generally have less lean tissue than younger patients, women have less lean tissue than men, patients with DM usually have more fat tissue than non-diabetics, and patients on dialysis have less lean and fatty tissue than healthy people, this is likely the result of being in a hypercatabolic state10 with insufficient intake/absorption of nutrients.11–13
Therefore, given that a higher presence of lean tissues has been correlated with better survival14,15 in patients on haemodialysis (HD), reference values16 adapted to the HD population should be available. These values must take into account characteristics such as age, gender, or DM, in order to get an adequate assessment of body composition parameters such as the lean tissue index (LTI) or the fat tissue index (FTI).
The use of body composition monitors has been extended in the HD units because of its easy of use and because they have been validated in the healthy and HD populations.16–20 Body Composition Monitor (BCM) (Fresenius Medical Care, Bad Homburg, Germany) based on bioimpedance spectroscopy (BIS) will be used in the present study.
The aim is, firstly, to describe the body composition of 6395 patients and to calculate the 10th and 90th percentiles of LTI/FTI in 4 groups of patient (diabetic men, non-diabetic men, diabetic women, non-diabetic women) relative to age, so percentiles will serve as a reference to assess patient's lean and fat tissue content. Secondly, to evaluate the mortality of the population and determine if having a LTI below the 10th percentile in their corresponding group carries a higher risk of death in HD; and thus confirm that LTI/FTI reference values provided are valid.
MethodsPatientsThis is a retrospective, observational, cohort study on body composition in 6395 patients (incident and prevalent) in HD treated in 57 FMC HD units in Spain. The study period ran from January 2012 to December 2014.
The inclusion criteria: patients treated in Fresenius Medical Care (FMC) clinics in Spain during the inclusion period (incident and prevalent patients) with at least one BCM measurement. The exclusion criteria are: patients with pacemakers and amputees.
All the patients are registered in the EuCliD® database (Fresenius Medical Care's European Clinical Database), described in previous works,21,22 and all signed the informed consent form.
DesignThe patients are grouped based on their gender and the presence of DM and stratified by age deciles. The result from the first BCM measurement is collected from the patients, and the 10th and 90th percentiles of LTI and FTI are calculated in each age decile in the 4 groups. All deaths and their causes are recorded, and a logistic regression was performed to determine the odds ratio (OR) of death from variables including the presence of a “LTI below the 10th percentile”.
Assessment of body composition by body composition monitorMeasurements with the BCM were performed by trained nursing staff before the HD session with the patient seated, following a common electrode placement protocol. The first BCM measurement was selected in all patients.
The following BCM data were recorded: absolute overhydration (OH) in litres as pre-HD weight minus normohydration weight calculated by BCM, relative overhydration (ROH, %) calculated as the quotient of OH divided by extracellular water in litres, LTI (kg/m2) and FTI (kg/m2) or lean tissue and fat tissue adjusted by height.
Patients’ systolic and diastolic blood pressure obtained in supine position before HD were collected and the mean values of blood pressure (systolic and diastolic) during that month period were calculated.
Demographic, blood test, and therapeutic and haemodialysis session-related parametersAge, vintage, age-adjusted Charlson index, presence of DM, and causes of kidney disease and death were collected.
The blood test data were collected prior to the mid week HD session. The parameters included in the analysis were: haemoglobin, albumin (83.9% through the bromocresol green method and 16.1% through the bromocresol purple method), and C-reactive protein.
With regard to HD, we collected: vascular access, mean effective time per HD session (T); Kt/V by ionic dialysance; the number of blood pressure drugs per month, and the calculated erythropoietin resistance index.
Statistical analysisThe statistical analysis was performed using the SPSS statistical package (IBM SPSS, Inc., Chicago, IL, USA), version 19. The Kolmogorov–Smirnov test was used to identify the non-parametric variables and these were log-transformed (e.g. CRP). The qualitative variables were expressed as percentages and the quantitative variables as mean±standard deviation. Student's t-test, Mann–Whitney test, or ANOVA were used to compare quantitative variables, according to their normal or non-parametric distribution. The Chi-squared test was used for qualitative variables. A p-value <0.05 was considered statistically significant. Multivariate logistic regression was performed as an analysis of survival to detect the OR (relative risk of death) of variables such as “LTI below the 10th percentile” with a 95% confidence interval. This analysis included confounding factors such as age, gender, vintage, vascular access (catheter), age-adjusted Charlson index, overhydration (ROH>15%), and plasma albumin.
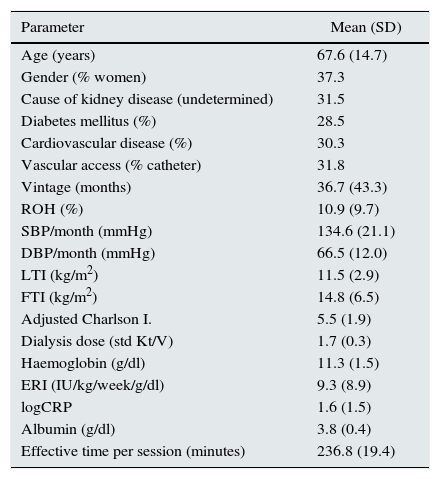
ResultsThe baseline characteristics of the cohort are shown in Table 1. The causes of kidney disease were: undetermined (31.5%), diabetic nephropathy (21.8%), glomerulonephritis (15.3%), nephroangiosclerosis (12.2%), tubulointerstitial nephropathy (9.5%), polycystic kidney disease (7.2%), and other (2.6%). As for vascular access: 31.8% of patients received dialysis through a catheter and 68.2% through an autologous or heterologous arteriovenous fistula.
Baseline characteristics of 6395 haemodialysis patients.
| Parameter | Mean (SD) |
|---|---|
| Age (years) | 67.6 (14.7) |
| Gender (% women) | 37.3 |
| Cause of kidney disease (undetermined) | 31.5 |
| Diabetes mellitus (%) | 28.5 |
| Cardiovascular disease (%) | 30.3 |
| Vascular access (% catheter) | 31.8 |
| Vintage (months) | 36.7 (43.3) |
| ROH (%) | 10.9 (9.7) |
| SBP/month (mmHg) | 134.6 (21.1) |
| DBP/month (mmHg) | 66.5 (12.0) |
| LTI (kg/m2) | 11.5 (2.9) |
| FTI (kg/m2) | 14.8 (6.5) |
| Adjusted Charlson I. | 5.5 (1.9) |
| Dialysis dose (std Kt/V) | 1.7 (0.3) |
| Haemoglobin (g/dl) | 11.3 (1.5) |
| ERI (IU/kg/week/g/dl) | 9.3 (8.9) |
| logCRP | 1.6 (1.5) |
| Albumin (g/dl) | 3.8 (0.4) |
| Effective time per session (minutes) | 236.8 (19.4) |
Adjusted Charlson index: age-adjusted Charlson index; CRP: C-reaction protein; DBP: diastolic blood pressure; ERI: erythropoietin resistance index; FTI: fat tissue index; LTI: lean tissue index; ROH: relative overhydration; SBP: systolic blood pressure.
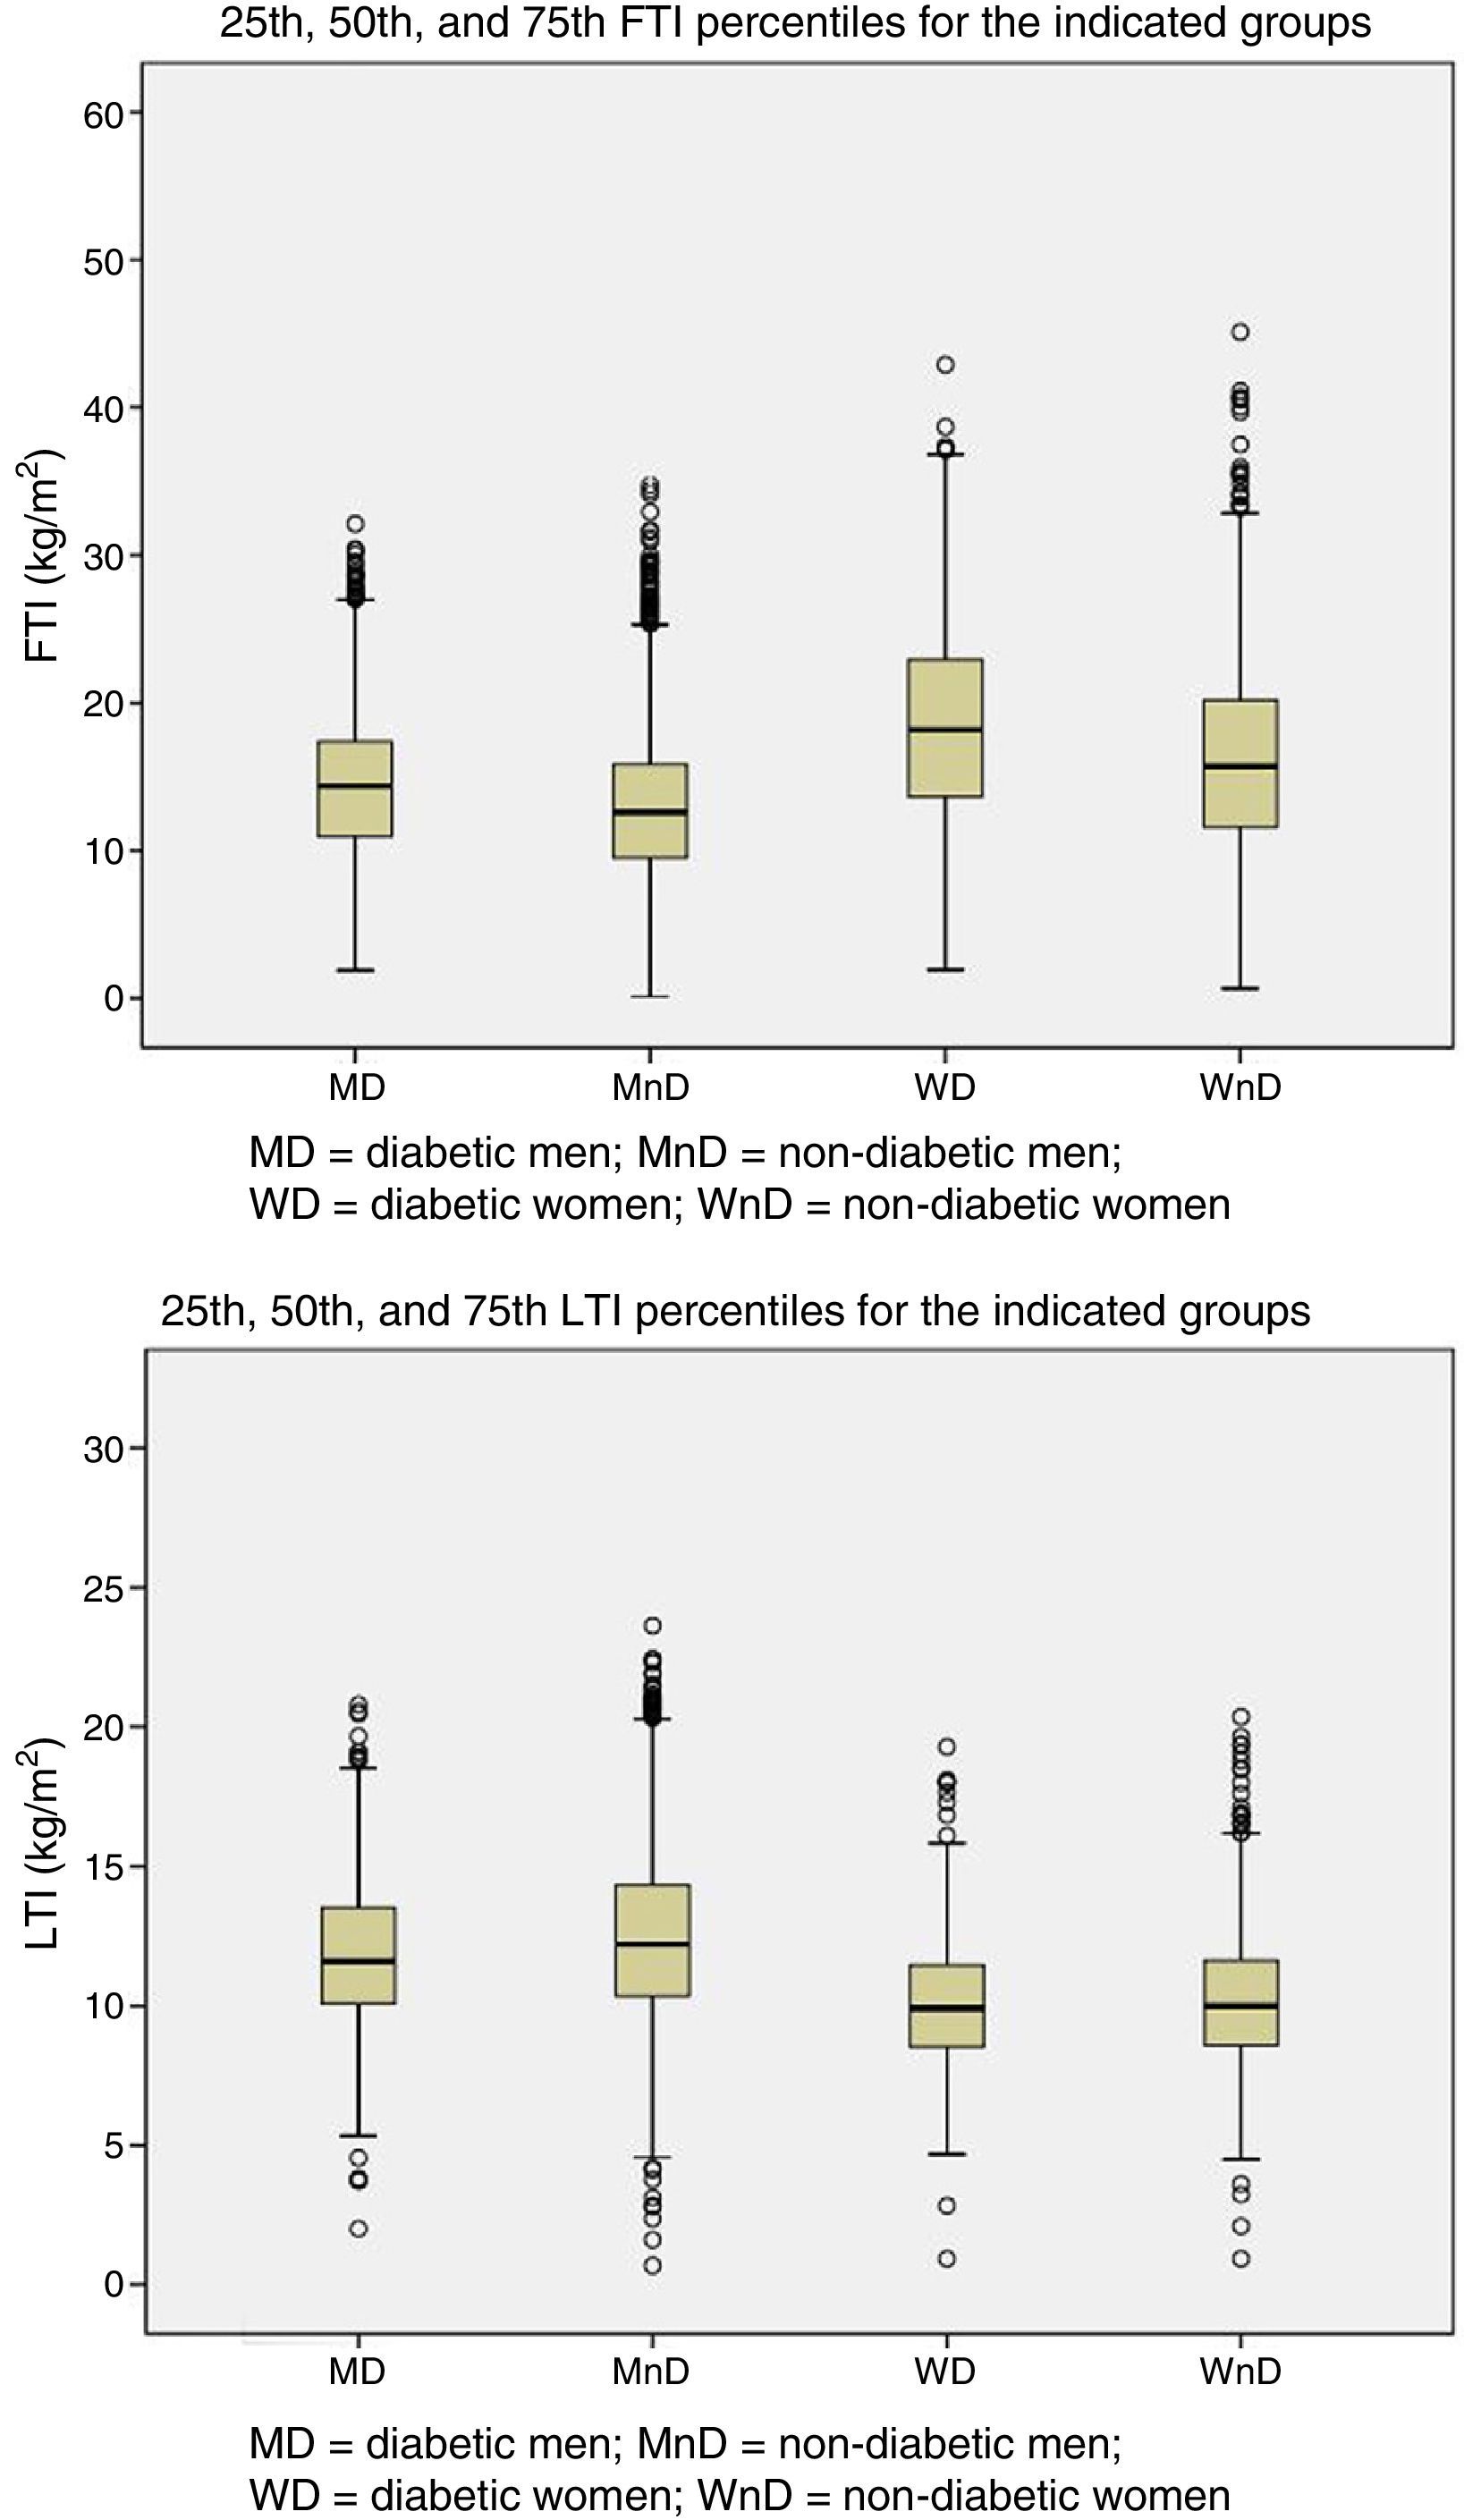
Patients were grouped by gender and presence of DM. The 25th, 50th, and 75th percentiles of LTI and FTI were calculated for each of the four groups (Fig. 1).
 and lean tissue index (LTI) for the 4 groups.")
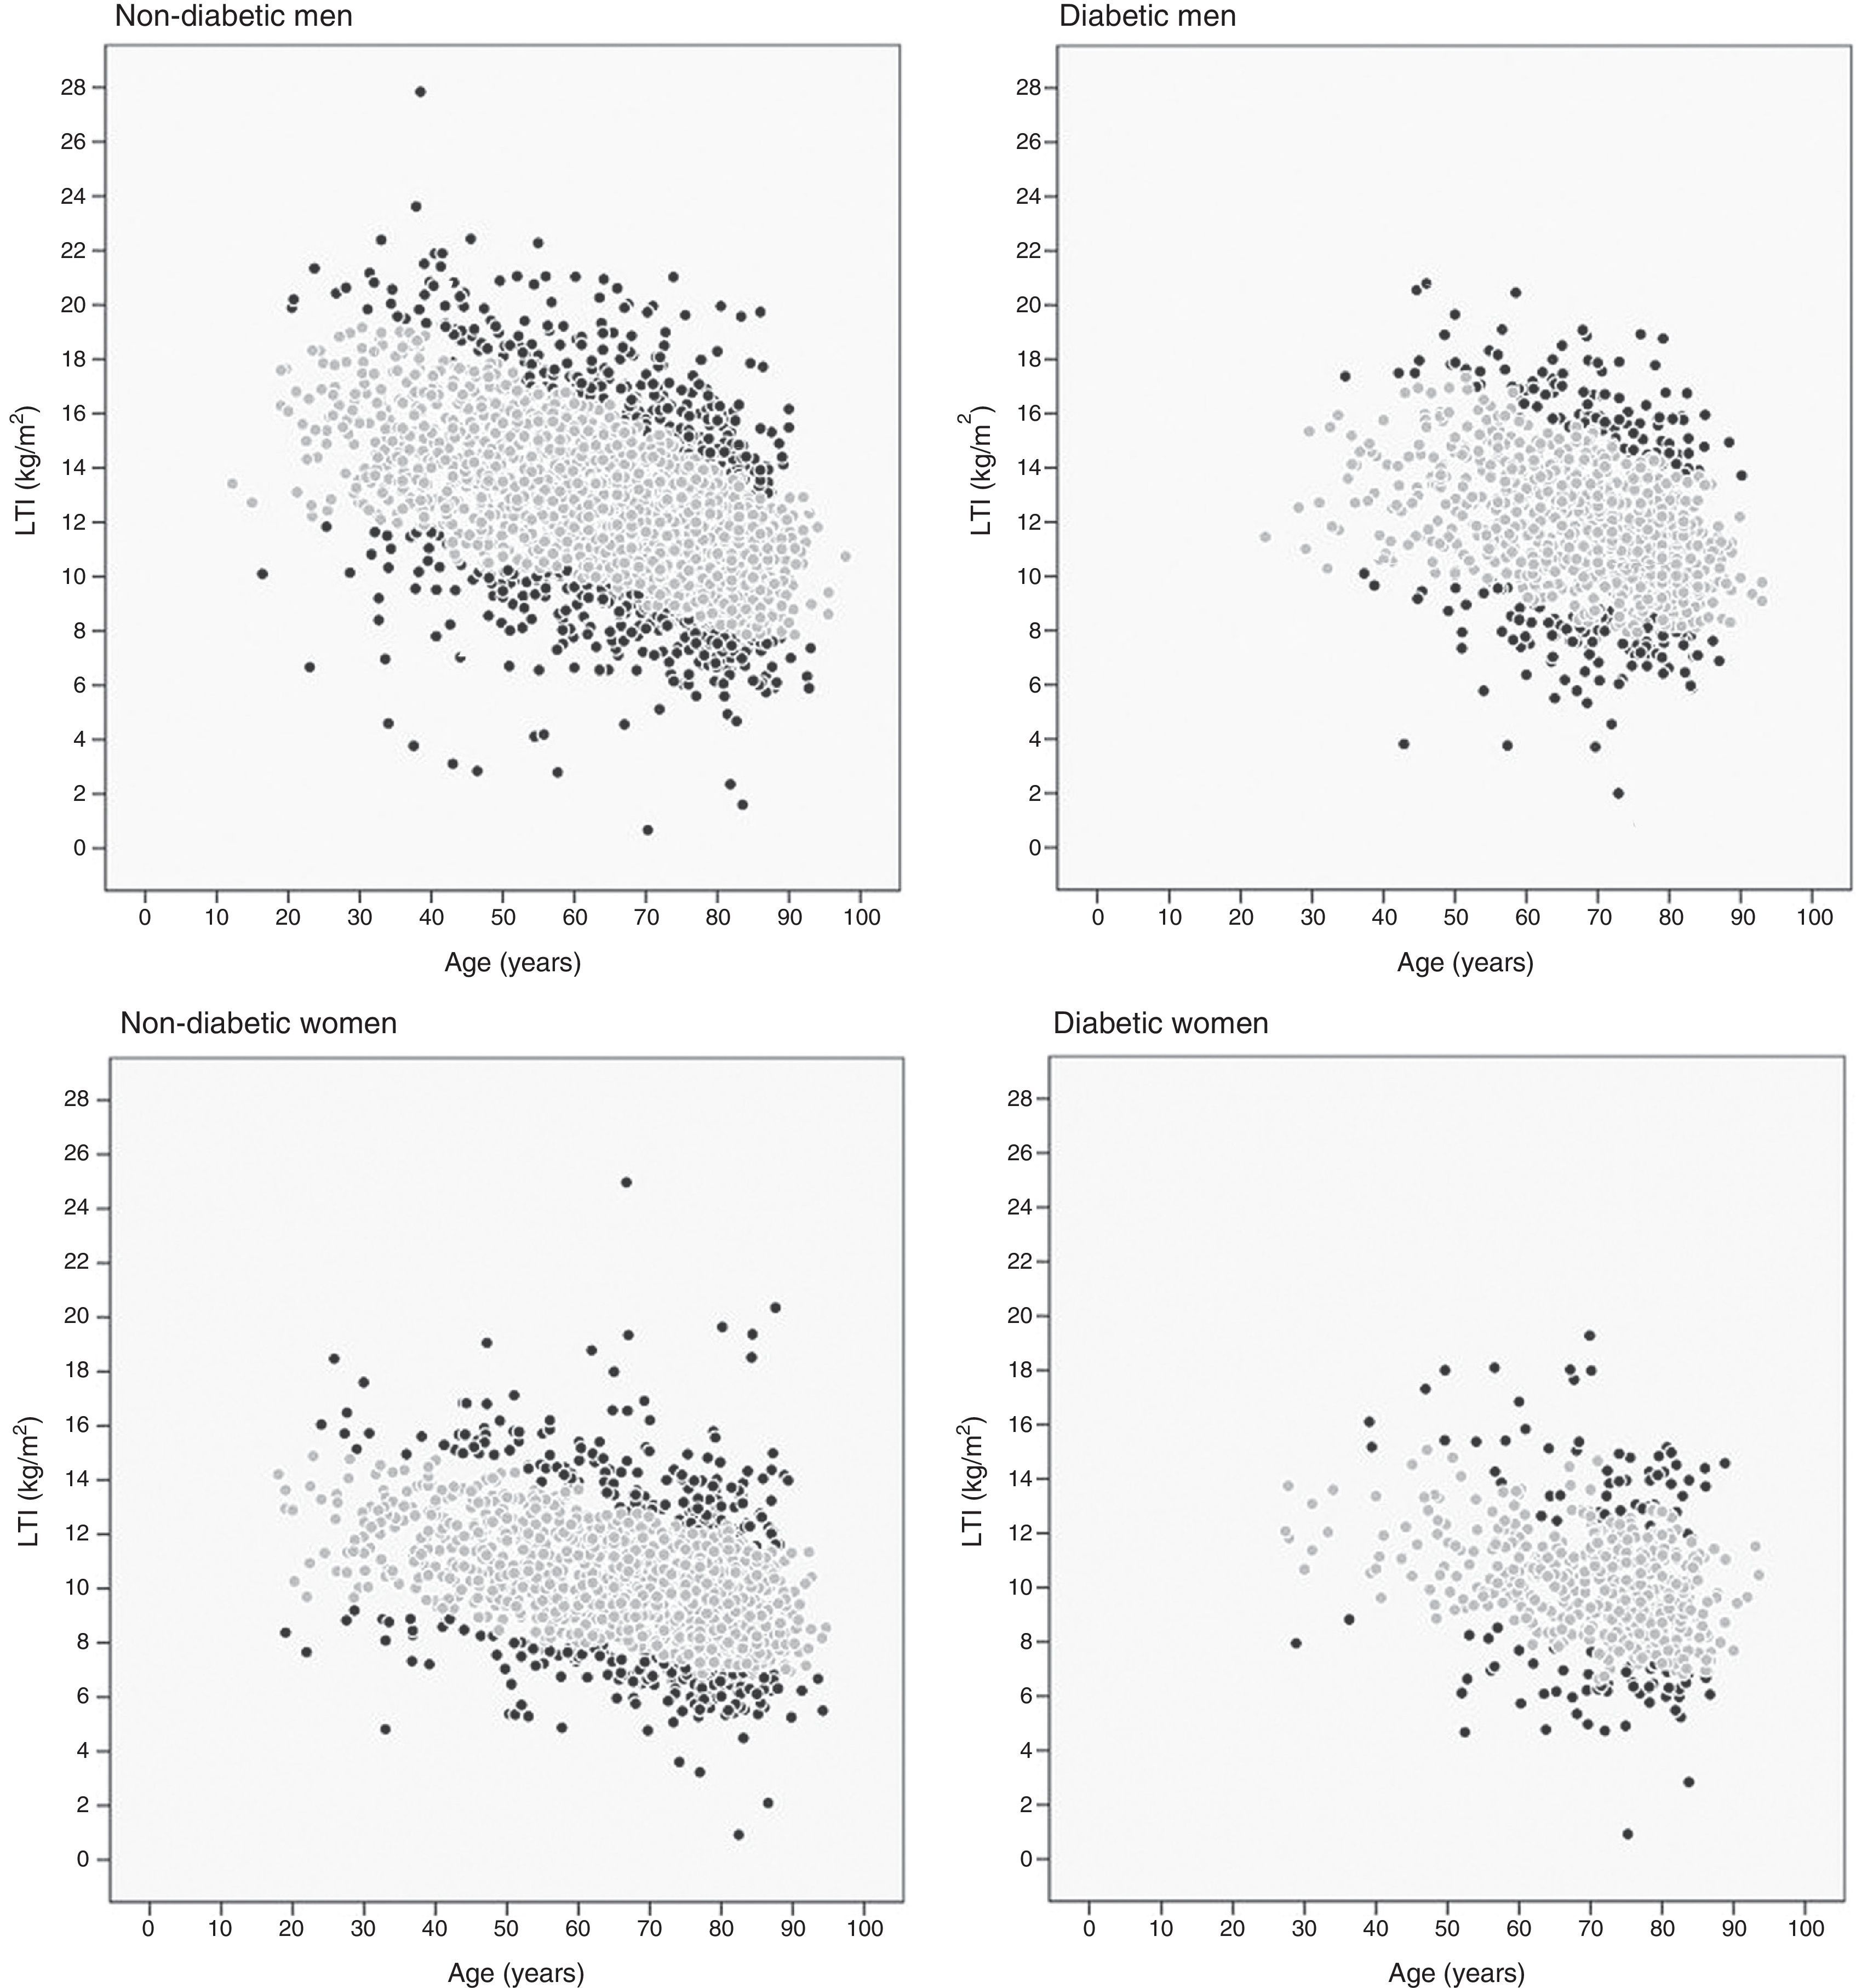
The 10th and 90th percentiles were also calculated for each age decil in the four patient groups. Fig. 2 shows the patient distribution based on their LTI: those with an LTI below the 10th percentile or over the 90th percentile (black points) and those with an LTI between the 10th and 90th percentiles (grey points).
. Black points are those with an LTI below the 10th percentile or above the 90th percentile, grey points are those with an LTI between the 10th and 90th percentiles.")
A total of 707 patients died during follow-up (11.1%), the majority of them from a cardiovascular cause (41.6%). Of the surviving patients, 79.1% continued HD in FMC centres, 10.8% transferred to non-FMC centres, 7.8% received transplants, 1.9% stopped renal replacement therapy, and 0.4% recovered kidney function.
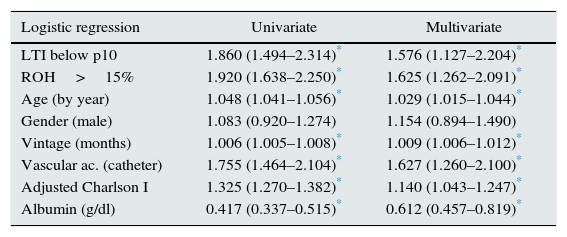
The result from the survival analysis using multivariate logistic regression is shown in Table 2. It includes the factor “LTI below the 10th percentile of their group and age” and others such as: age, gender, vintage, Charlson index, vascular access, overhydration (ROH greater than 15%), and albumin.
Logistic regression with odds ratio and confidence interval.
| Logistic regression | Univariate | Multivariate |
|---|---|---|
| LTI below p10 | 1.860 (1.494–2.314)* | 1.576 (1.127–2.204)* |
| ROH>15% | 1.920 (1.638–2.250)* | 1.625 (1.262–2.091)* |
| Age (by year) | 1.048 (1.041–1.056)* | 1.029 (1.015–1.044)* |
| Gender (male) | 1.083 (0.920–1.274) | 1.154 (0.894–1.490) |
| Vintage (months) | 1.006 (1.005–1.008)* | 1.009 (1.006–1.012)* |
| Vascular ac. (catheter) | 1.755 (1.464–2.104)* | 1.627 (1.260–2.100)* |
| Adjusted Charlson I | 1.325 (1.270–1.382)* | 1.140 (1.043–1.247)* |
| Albumin (g/dl) | 0.417 (0.337–0.515)* | 0.612 (0.457–0.819)* |
Adjusted Charlson index: age adjusted Charlson index; HD: haemodialysis; LTI: lean tissue index; ROH>15%: relative overhydration greater than 15%; Vascular ac.: vascular access.
The work provides LTI and FTI reference values (10th and 90th percentiles) adjusted for age, gender, and DM for the HD population, coming from the HD population. The descriptive analysis confirms the effect of some circumstances on the body composition of HD patients, such as age,1–4 gender6 and DM1,7 and, therefore, the need to assess patients’ body composition taking these circumstances into account.
The sample size, representing a substantial proportion of HD patients in Spain, is one of the work's strengths. This enabled us to obtain LTI and FTI reference ranges for HD patients coming from subjects with their same characteristics. To our knowledge to date, Until now, the reference values for the body composition parameters obtained using BIS came from healthy patients.6
Furthermore, it was observed that the presence of less lean tissue, defined a “LTI below the 10th percentile of their group” carries a higher risk of death in HD (OR 1.57), which also demonstrates that the reference values provided by the work are valid, illustrative, and adequate.
The study shows that the association between low LTI and mortality remains statistically significant, even after adjusting for other risk factors such as time in HD,23 vascular access,24 Charlson index,1,6,7 relative overhydration greater than 15%7,25–29 and albumin.23,30–33
Previous studies have examined the correlation between low lean tissue (expressed as LTI below the 10th percentile in the present study) and worse survival in HD34. Among the possible causes we note that (1) a lower lean mass may be a sign of malnutrition35,36 or a sign of inflammation;36 (2) that there may be uraemic toxin deposits in lean tissue, and therefore, lesser lean tissue may indicate a higher concentration of uraemic toxins in blood;36,37 (3) that the increase in lean tissue (and muscle mass) is associated with physical activity and this improves vascular rigidity and insulin resistance;1,36 and, lastly, (4) the known correlation between muscle mass and mortality caused by infections in HD patients, since chronic kidney disease patients have an acquired immunodeficiency that may become exacerbated in patients with little muscle mass by sharing risk factors such as hypoalbuminemia and protein-energy wasting (PEW).2
According to the possible explanations, we must add that patients with LTI below the 10th percentile present higher levels of CRP, but their dialysis doses are those recommended by the guidelines.38–41 Thus, the body composition of HD patients, and especially those with LTI below the 10th percentile, could reflect an underlying disease (inflammatory processes or malnutrition) or could perhaps predispose patients to risky situations, such as infections.
The results of the study suggest that the physicians should establish some diagnostic and therapeutic measures in HD patients with low LTI.42 Firstly, at attempt to identify the reason of low lean tissue and treat the underlying cause; secondly, to determine if nutritional intervention such as oral or intravenous supplement may be useful in this type of patient; and thirdly, to improve the dialysis dose if the cause is attributed to underdialysis.
This study shows the 10th and 90th percentile values adjusted by age, gender, and DM in a significant number of HD patients in Spain. These LTI/FTI values may be used by physicians as reference values to assess the nutritional status of HD patients. In fact, using these values as a guide, it was shown that the presence of a “LTI below the 10th percentile” for their group is correlated with a higher risk of death, even after adjusting for other factors such as overhydration.
One of the limitations of this study is that the patients’ race was not taken into account since the vast majority of patients were Caucasioan1; but reference values are needed for other races. Other limitations are that neither the interventions (such as nutritional support or physical activity) nor specific circumstances (such as hospitalizations), and their effects on body composition or on morbidity-mortality of the patients were recorded. This could be taken into account in future works. Similarly, as more patients are incorporated to total sample, also vintage can be considered a grouping factor.
In conclusion, new diagnostic tools such as BCM allow us a simultaneous assessment of hydration and nutrition situation of HD patients. Monitoring the body composition of patients and its assessing using adequate reference values may be useful to identify situations of risk that can be prevented or treated.
Now it remains to be shown in prospective studies if nutritional intervention with an increase in lean tissue may result in improved survival.
Conflicts of interestAll the authors are employees of Fresenius Medical Care.
We thank all the doctors at the Fresenius Medical Care-NephroCare clinic, without whose work this study would have been impossible.
Aguilera Jover, Josep; Ajenjo Mas, Enrique; Al Massri, Mohamad; Alcalá Rueda, María Luisa; Almoguera González, Ana María; Álvarez Francos, Marta; Amoedo Rivera, María Luisa; Ampuero Mencia, Jara; Aramburu Hostench, Javier; Araque Juan, Alicia; Ariza Fuentes, Francisco Javier; Arruche Herrero, M. Mercedes; Bar, Andrzej Witold; Barbacid Santos, Ignacio Alberto; Barbetta, Massimo; Barbosa Puig, Francisco; Barrera Padilla, Rosario; Berdud Godoy, Isabel; Berlanga Alvarado, José Ramón; Blanco Santos, Ana; Calvar García, Carlos Alberto; Cantón Guerrero, Petra; Carazo Calvo, María Eugenia; Cardoso Represa, Alejandro; Carretero Dios, Diana; Cid Parra, María Cruz; Cives Muiño, Alejandro Daniel; Contreras Ríos, Juan José; Corredera Romero, Mª. Teresa; Crespo Navarro, Antonio; De Miguel Anasagasti, Teresa; Devesa Such, Ramón; Durán Sánchez, Victorino; El Rifai El Sayed, Abdallah; Espada Guerrero, Rosa María; Estadella Llobet, Concepció; Estrada Patricia, N; Faez Herrera, Yamile; Faiña Rodríguez-Vila, Beatriz; Feliz Díaz, Tamara Carmelina; Fernández Robres, Mª. Amparo; Fernández Carbonero, Enrique; Fernández de Diego, Álvaro; Fernández Marchena, Dolores; Fernández Chávez, Abelardo Claudio; Fernández Solís, María Antonia; Gad, Noura; Galán González, Josefa; Galano Quiala, Marilee; Gallego García, María José; García Guijosa, Mª. Ángeles; García Lacomba, Juan José; García Crespo, María del Mar; García de Vinuesa Calvo, Elena; García-Izquierdo Otero, Ambrosio; Giner Segui, Rafael; Giráldez Casasnovas, José Diego; Gómez Couñago, Inmaculada; González Olmedo, Petronila; Gorostiza Rodríguez, Guillermo; Grisales Arroyave, Juan Carlos; Gurpegui Prieto, María Luz; Hernández Moreno, María Teresa; Herrera Denis, Imara; Hidalgo García, Patricia; Hurtado Muñoz, Sara; Ibrik Ibrik, Omar; Insense Pons, Alberta; Izaguirre Martín, Ana Isabel; Jordan Pérez, Joel; Juan Pérez, Mª. Ángeles; Loras Amorós, Laura; Macías Galán, Rosa María; Márquez Ramón, Juan Antonio; Martín Gil, Alfredo Javier; Martín Pérez, María Belén; Martínez Rubio, Mª. Pilar; Matas Serra, Margarita; Merin Serra, Ana; Mestres Capdevila, Rosa; Mora Macia, Josep; Moreno Vega, Darío Manuel; Moreno Muñoz, María Victoria; Morente Esquivel, Jorge Camilo; Moreso Mateos, Francesc; Munteanu, Oana Mihaela; Nin Zulueta, Jordi; Olivares Ortiz, Álvaro Mauricio; Olivas Ferrandis, Juan Luis; Ortuño Celdran, Tomás Antonio; Pascual Domínguez, Francisco Javier; Paz Martín, Rodrigo; Pérez Velasco, Cristina; Pons Aguilar, Mercedes; Ruiz Carrero, María Asunción; Puyuelo Lanao, Trinidad; Quintana Rozadilla, Elena; Quintanilla Valles, Nuria; Quiroz Morales, Manuel Augusto; Redondo García, Concepción; Requena Soriano, Juan Francisco; Riaño Castañedo, María Jesús; Ribera Tello, Laura; Rico Salvador, Inmaculada; Ríos Moreno, Francisco; Rivera Pérez, Mariana; Rodríguez de Oña, María del Mar; Romero Nieves, Mª. del Carmen; Romero Jiménez, Rafaela; Romero Mallorca, Alonso; Rubia García, Francisco Manuel; Rueda Lombillo, María Emma; Ruiz Caro, María Caridad; Ruiz Roda, Jesús; Ruiz Alaminos, Jesús Daniel; Ruiz Losada, Ana María; Sánchez Enríquez, Carlos Alberto; Sánchez García, Olga María; Sánchez Sancho, Mercedes; Sánchez Torres, Dolores; Santos Herrera, Marta; Sastre Romaniega, Mª. Lourdes; Sese Torres, Josep; Setién Conde, María Ángeles; Silgado Rodríguez, Gema; Simonyan Hamazasp; Soler García, Jordi; Soto Montañez, Carlos Antonio; Sujan Sujan, Seema; Suria Arenes, Miguel Carlos; Uribe Echeverri, Juan Diego; Valdés Chiong, Evaristo; Valentín González, Félix; Vázquez Cruzado, Juan; Vidiella Martorell, Juan; Villaverde Ares, Mª. Teresa; Virguez Pedreros, Leonardo.
Please cite this article as: Castellano S, Palomares I, Moissl U, Chamney P, Carretero D, Crespo A, et al. Identificar situaciones de riesgo para los pacientes en hemodiálisis mediante la adecuada valoración de su composición corporal. Nefrología. 2016;36:268–274.


