Currently, on-line hemodiafiltration (OL-HDF) is the most effective technique. Several randomised studies and meta-analyses have shown a reduced mortality and a direct association with convective volume has been reported. At present, it has not been established if an increased dialysate flow (Qd) shows in improved results in terms of convective and depurative efficiency. We aim at assessing the effects of Qd variations on convective volume and its depurative capacity in patients on OL-HDF.
Material and methodsA total of 59 patients (45 men and 14 women) from a OL-HDF programme in which a monitor 5008 Cordiax with auto-substitution was used, were enrolled. Patients were assessed in 5 sessions with post-dilutional OL-HDF, using helixone-based dialyzers, with only Qd being changed (300, 400, 500, 600 and 700mL/min). Serum levels of urea (60Da), creatinine (113Da), β2-microglobulin (11,800Da), myoglobin (17,200Da) and α1-microglobulin (33,000Da) were measured at the beginning and at the end of each session, in order to estimate the percent reduction of such solutes.
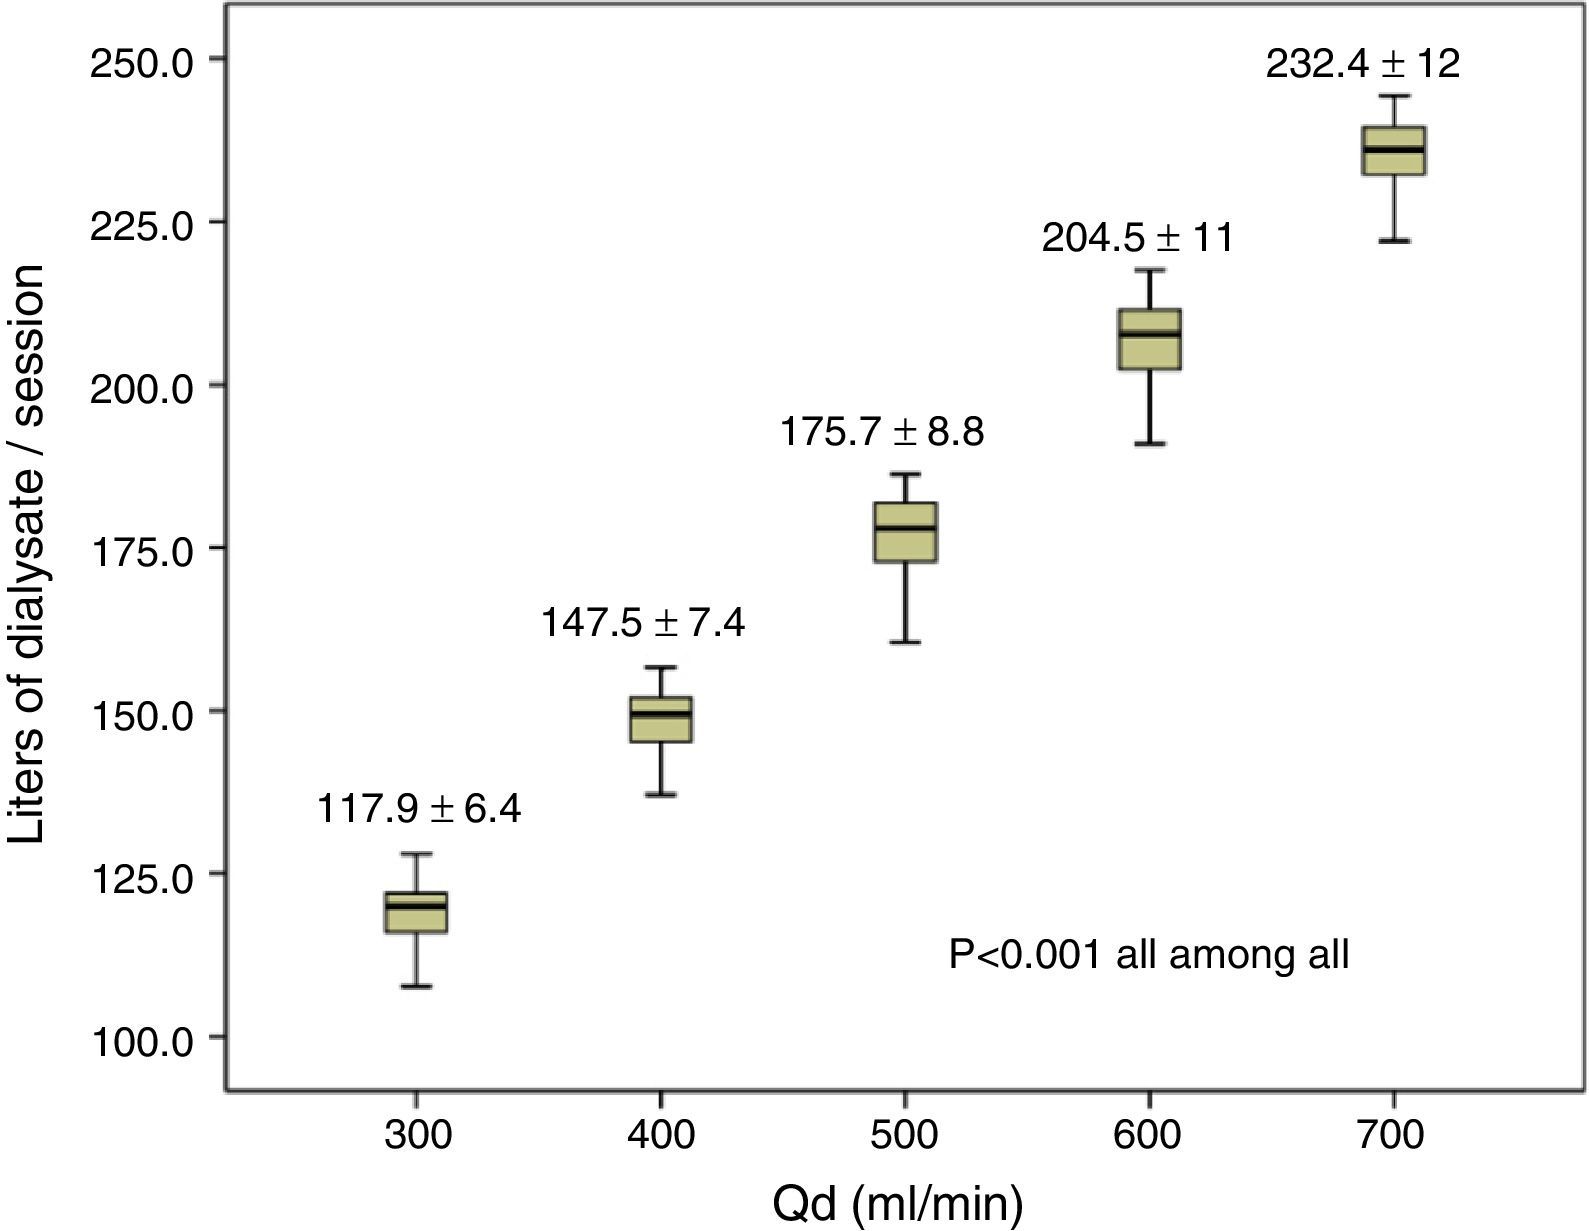
ResultsAn increased dialysate volume per session was observed, from 117.9±6.4L with Qd 300mL/min to 232.4±12L with Qd 700mL/min. No changes were found in replacement volume or convective volume. Regarding diffusion, Qd increase was associated to a significantly increased dialysis dose, with an increased Kt from 68±6.9L with Qd 300mL/min to 75.5±7.3L with Qd 700mL/min (P<0.001), and a gradually increased percent reduction in urea associated to increased Qd with significantly lower levels being found with Qd 300mL/min. No changes were found in other measured substances.
ConclusionQd variations in OL-HDF do not change convective volume. A higher Qd was associated to a slightly increased urea clearance with no change being observed for medium and large molecules. Qd optimisation to the minimal level assuring an adequate dialysis dose and allowing water and dialysate use to be rationalised should be recommended.
La hemodiafiltración on-line (HDF-OL) es actualmente la técnica más efectiva. Varios estudios aleatorizados y metaanálisis han observado una reducción de la mortalidad, con una asociación en relación directa con el volumen convectivo. En el momento presente no está bien establecido si el aumento del flujo del líquido de diálisis (Qd) puede suponer mejores resultados en términos de eficacia convectiva y depurativa. El objetivo del estudio fue valorar, en pacientes en tratamiento con HDF-OL, el efecto de la variación del Qd sobre el volumen convectivo y su capacidad depurativa.
Material y métodosSe incluyeron 59 pacientes, 45 varones y 14 mujeres que se encontraban en programa de HDF-OL con monitor 5008 Cordiax con autosustitución. Cada paciente fue analizado en 5 sesiones con HDF-OL posdilucional, con dializadores de helixona, en las que solo se varió el Qd (300, 400, 500, 600 y 700ml/min). En cada sesión se determinaron concentración de urea (60Da), creatinina (113 Da), β2-microglobulina (11.800Da), mioglobina (17.200Da) y α1-microglobulina (33.000Da) en suero al inicio y al final de cada sesión, para calcular el porcentaje de reducción de estos solutos.
ResultadosSe objetivó un aumento de litros de Qd por sesión, desde 117,9±6,4 L con Qd de 300ml/min hasta 232,4±12 L con Qd 700ml/min. No se determinaron cambios en el volumen de sustitución ni en el volumen convectivo. En términos de difusión, el incremento del Qd mostró un aumento significativo de la dosis de diálisis, con un aumento de Kt de 68±6,9 L con Qd 300ml/min hasta 75,5±7,3 L con Qd 700ml/min (p<0,001), y un aumento progresivo del porcentaje de reducción de urea con el incremento del Qd, que era significativamente inferior con Qd 300ml/min. No se objetivaron cambios en el resto de moléculas estudiadas.
ConclusiónLa variación del Qd en HDF-OL no modifica el volumen convectivo. Un mayor Qd mostró un discreto incremento de la depuración de la urea, sin variaciones en las medianas ni en las grandes moléculas. Es recomendable optimizar el Qd al mínimo posible que garantice una adecuada dosis de diálisis y permita racionalizar el consumo de agua y concentrado de diálisis.
National1 and international2 clinical practice guidelines recommend to provide at least a minimum dose of haemodialysis as determined by a Kt/V of 1.3 and a urea reduction ratio of 70%. Diffusive clearance is related to blood flow (Qb), dialysate flow (Qd), and the mass transfer-area coefficient (KoA). In one in vitro study, Leypoldt et al.3 showed that an increase in Qd from 500mL/min to 800mL/min conferred a 14% increase in urea KoA, due to improved distribution of dialysate and reduced mass transfer resistance across the membrane. These results were subsequently demonstrated in clinical practice, with a 5.7%4 increase in KoA and an 8.5% increase in K and Kt/V when Qd was changed from 500mL/min to 750mL/min.5 Through modifications in the manufacturing of dialyzers, the pharmaceutical industry has improved dialysate distribution in capillaries.6–8 It has been observed that an increase in Qd to beyond 600mL/min does not correlate with better dialysis outcomes, as determined by Kt/V9 or clearance of molecules such as phosphorus and β2-microglobulin.10
Haemodiafiltration is a dialysis technique that combines diffusion and convection, both processes having similar clearance capacities. Post-dilution on-line HDF (OL-HDF) has been demonstrated to improve intradialysis tolerance11, increase survival12 and more recently, several meta-analyses have confirmed reduced overall and cardiovascular mortality.12–15 Secondary analyses of the studies using death as a primary endpoint11,14,15 observed an association between convective volume and survival. Therefore, a minimum convective volume of 23L per session was recommended until more conclusive scientific evidence became available.16,17
Initially, OL-HDF was performed with a Qd of 800mL/min, because some of the dialysate was used as substitution solution.18,19 Later, newer monitors were able to differentiate dialysate destined for diffusion (usually 500mL/min) from that destined for substitution (60–150mL/min).20 Now, with the aim of optimising the dialysate to the requirements of the dialyser, the 5008 monitors have a Qd autoflow system with an adjustable Qd/Qb ratio. The initial default setting recommended by the monitor for this factor was 1.2.21 This recommendation has subsequently been changed to a factor of 1.0 if Qb is equal to or greater than 400mL/min, or 1.2 if Qb is less than 400mL/min.
To assess and optimise the choice of dialysate, the aim of this study was to evaluate the effects of changes in Qd on the convective volume and clearance capacity in patients on OL-HDF treatment.
Patients and methodsThis was a single-centre study in stable haemodialysis patients. Fifty-nine patients were included, 45 men and 14 women, with a mean age of 67.0±13 years (range 26–89 years), who were on a haemodialysis programme for a mean of 39.4±42 months. The aetiology of chronic renal failure was chronic glomerulonephritis in 8 cases (13.6%), diabetic nephropathy in 14 cases (23.7%), polycystic disease in 6 cases (10.2%), vascular nephropathy in 13 cases (22%), urological causes in 6 cases (10.2%), systemic disease in 1 (1.7%), tubulo-interstitial nephritis in 2 (3.4%), and unknown aetiology in 9 (15.3%). All patients were dialysed via an arteriovenous fistula, except one patient who had a tunnelled central line.
Each patient received 5 different dialysis sessions, always mid-week, in which only Qd was changed, to either 300, 400, 500, 600, or 700mL/min. Other dialytic parameters were kept constant in all sessions studied: dialysis time, 293.4±15min (240–300min); Qb, 424±4mL/min (350–450mL/min). The dialyser was not changed (80% FX60Cordiax, 20% FX80Cordiax), 5008 Cordiax monitor, post-dilution OL-HDF with auto-substitution system was used. The order of sessions was randomised.
The dialysis parameters collected at each session were: programmed time, actual duration of sessions; dialyser; Qb; initial and final weight; Kt, automatically measured by ionic dialysance; recirculation rate, measured by the temperature module; arterial pressure; venous pressure; transmembrane pressure; initial and final haemoglobin; volume of blood processed; and substitution volume.
Serum concentrations of urea (60Da), creatinine (113Da), β2-microglobulin (11,800Da), myoglobin (17,200Da) and α1-microglobulin (33,000Da) were measured at the start and end of each session to calculate the percentage reduction of these solutes. The concentrations of urea and creatinine were measured using molecular absorption spectrometry on the ADVIA 2400 analyser (Chemistry System of Siemens Healthcare Diagnostics, Chicago, IL, USA). β2-Microglobulin (β2-m) and α1-microglobulin (α1-m) were measured by immunonephelometry with the BNII analyser (Siemens Healthcare Diagnostics). Myoglobin concentrations were measured by “sandwich” enzyme immunoassay with the Dimension EXL analyser (Siemens Healthcare Diagnostics). In all cases, dedicated reagents were used.
To correct for haemoconcentration during dialysis, the percentage reductions pre- and post-treatment in plasma β2-m, myoglobin and α1-microglobulin were calculated using the Bergström and Wehle formula.22
Statistical analysis was performed on the programme SPSS version 20.0 and results are expressed as mean±standard deviation. For analysis of the statistical significance of quantitative parameters, the Student's t-test was used for paired data, or ANOVA for repeated measures. A P-value <0.05 was considered statistically significant.
ResultsAll dialysis sessions were carried out with no clinical incidents of note. The anticoagulation used was heparin sodium in 28.8%, low molecular weight heparin (tinzaparin) in 55.9%, and in the remaining 15.3%, no heparin was used.
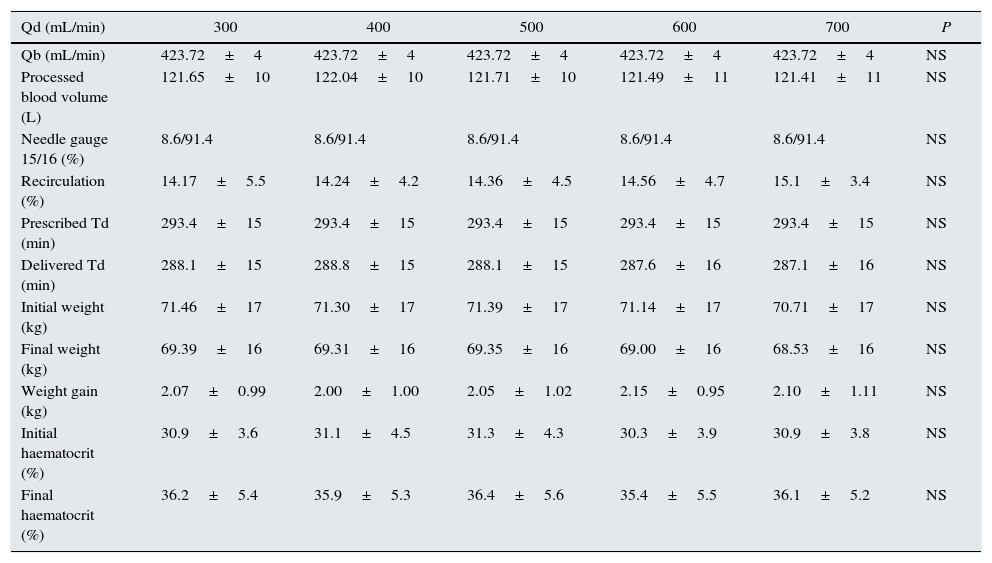
The volume of dialysate passed per session increased from 117.9±6.4L with a Qd of 300mL/min up to 232.4±12L with a Qd of 700mL/min (Fig. 1). There were no differences in the other dialysis parameters, Qb, total blood processed by the monitor, needle gauge, recirculation, actual duration of sessions, initial weight, final weight, weight gain, or dialysis monitor measurements of initial and final haematocrit (Table 1).

Comparison of dialysis parameters for the 5 different Qd settings (n=59).
| Qd (mL/min) | 300 | 400 | 500 | 600 | 700 | P |
|---|---|---|---|---|---|---|
| Qb (mL/min) | 423.72±4 | 423.72±4 | 423.72±4 | 423.72±4 | 423.72±4 | NS |
| Processed blood volume (L) | 121.65±10 | 122.04±10 | 121.71±10 | 121.49±11 | 121.41±11 | NS |
| Needle gauge 15/16 (%) | 8.6/91.4 | 8.6/91.4 | 8.6/91.4 | 8.6/91.4 | 8.6/91.4 | NS |
| Recirculation (%) | 14.17±5.5 | 14.24±4.2 | 14.36±4.5 | 14.56±4.7 | 15.1±3.4 | NS |
| Prescribed Td (min) | 293.4±15 | 293.4±15 | 293.4±15 | 293.4±15 | 293.4±15 | NS |
| Delivered Td (min) | 288.1±15 | 288.8±15 | 288.1±15 | 287.6±16 | 287.1±16 | NS |
| Initial weight (kg) | 71.46±17 | 71.30±17 | 71.39±17 | 71.14±17 | 70.71±17 | NS |
| Final weight (kg) | 69.39±16 | 69.31±16 | 69.35±16 | 69.00±16 | 68.53±16 | NS |
| Weight gain (kg) | 2.07±0.99 | 2.00±1.00 | 2.05±1.02 | 2.15±0.95 | 2.10±1.11 | NS |
| Initial haematocrit (%) | 30.9±3.6 | 31.1±4.5 | 31.3±4.3 | 30.3±3.9 | 30.9±3.8 | NS |
| Final haematocrit (%) | 36.2±5.4 | 35.9±5.3 | 36.4±5.6 | 35.4±5.5 | 36.1±5.2 | NS |
NS, not significant; Qb, blood flow; Qd, dialysate flow; Td, dialysis time.
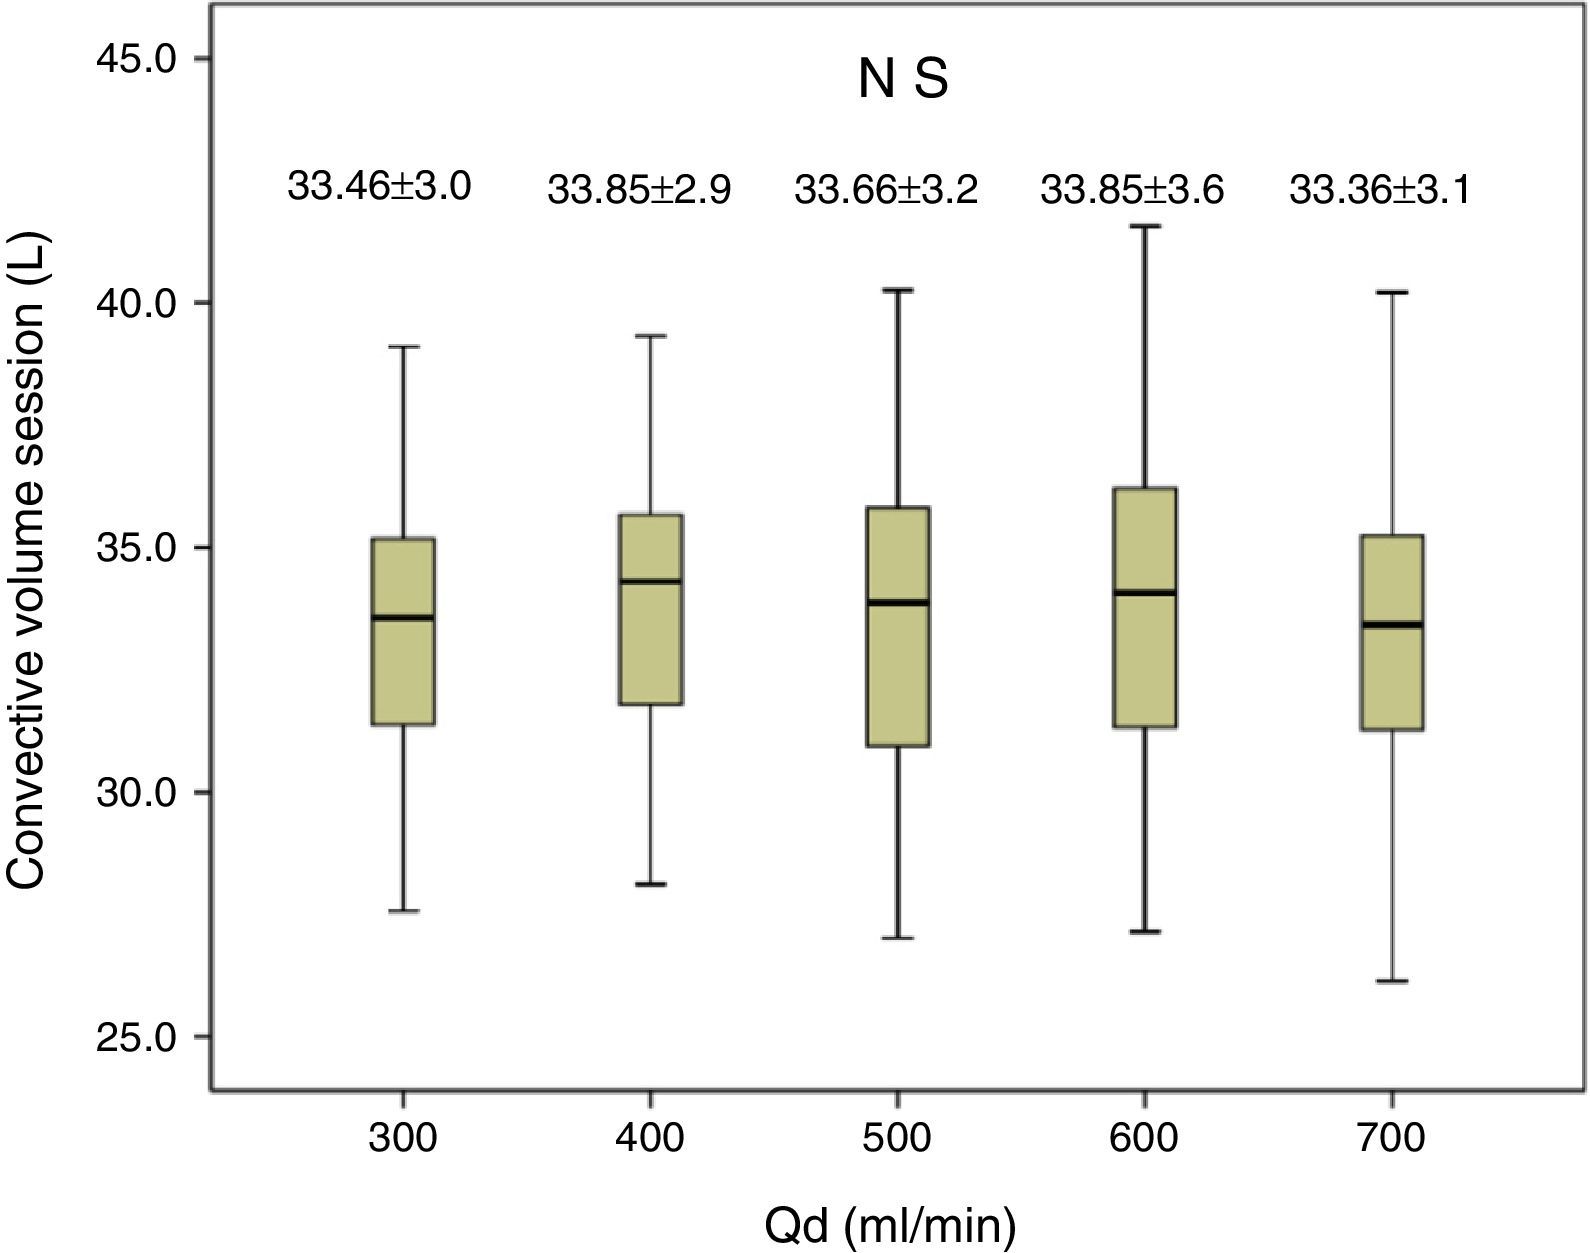
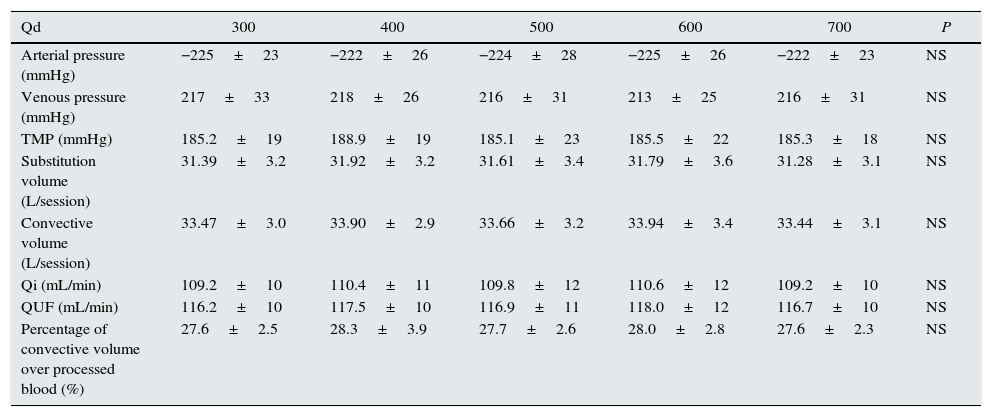
The substitution volume was similar in all 5 Qd settings studied (Table 2), demonstrating that Qd affected neither substitution volume nor convective volume (Fig. 2). Table 2 shows that in all situations, there were no differences in arterial pressure, venous pressure, transmembrane pressure, Qi, ultrafiltration flow (QUF), or percentage of effective convective volume over total processed blood.
Comparison of substitution volume, total convective volume, infusion flow, ultrafiltration flow, and processed blood volume at different dialysate flow rates (n=59).
| Qd | 300 | 400 | 500 | 600 | 700 | P |
|---|---|---|---|---|---|---|
| Arterial pressure (mmHg) | −225±23 | −222±26 | −224±28 | −225±26 | −222±23 | NS |
| Venous pressure (mmHg) | 217±33 | 218±26 | 216±31 | 213±25 | 216±31 | NS |
| TMP (mmHg) | 185.2±19 | 188.9±19 | 185.1±23 | 185.5±22 | 185.3±18 | NS |
| Substitution volume (L/session) | 31.39±3.2 | 31.92±3.2 | 31.61±3.4 | 31.79±3.6 | 31.28±3.1 | NS |
| Convective volume (L/session) | 33.47±3.0 | 33.90±2.9 | 33.66±3.2 | 33.94±3.4 | 33.44±3.1 | NS |
| Qi (mL/min) | 109.2±10 | 110.4±11 | 109.8±12 | 110.6±12 | 109.2±10 | NS |
| QUF (mL/min) | 116.2±10 | 117.5±10 | 116.9±11 | 118.0±12 | 116.7±10 | NS |
| Percentage of convective volume over processed blood (%) | 27.6±2.5 | 28.3±3.9 | 27.7±2.6 | 28.0±2.8 | 27.6±2.3 | NS |
NS, not significant; P, probability; Qi, infusion flow; QUF, ultrafiltration flow; TMP, transmembrane pressure.

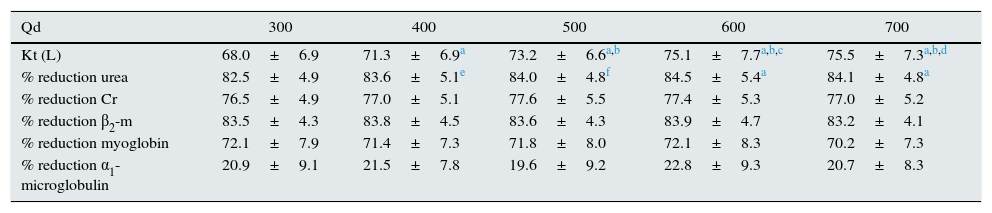
When Qd was increased, the dialysis dose and clearance of small molecules also increased. Kt increased significantly, from 68.0±6.9L when Qd was 300mL/min, up to 75.5±7.3L when Qd was 700mL/min (Table 3), P<0.001 in all situations. There was also a greater percentage reduction of urea with the increase in Qd, being significantly lower when Qd was 300mL/min than in the other 4 study situations (Table 3).
Evaluation of the clearance efficiency at the difference dialysate flow rates (n=59).
| Qd | 300 | 400 | 500 | 600 | 700 |
|---|---|---|---|---|---|
| Kt (L) | 68.0±6.9 | 71.3±6.9a | 73.2±6.6a,b | 75.1±7.7a,b,c | 75.5±7.3a,b,d |
| % reduction urea | 82.5±4.9 | 83.6±5.1e | 84.0±4.8f | 84.5±5.4a | 84.1±4.8a |
| % reduction Cr | 76.5±4.9 | 77.0±5.1 | 77.6±5.5 | 77.4±5.3 | 77.0±5.2 |
| % reduction β2-m | 83.5±4.3 | 83.8±4.5 | 83.6±4.3 | 83.9±4.7 | 83.2±4.1 |
| % reduction myoglobin | 72.1±7.9 | 71.4±7.3 | 71.8±8.0 | 72.1±8.3 | 70.2±7.3 |
| % reduction α1-microglobulin | 20.9±9.1 | 21.5±7.8 | 19.6±9.2 | 22.8±9.3 | 20.7±8.3 |
When we evaluated the percentage reduction of creatinine, β2-m, myoglobin and α1-microglobulin, no significant differences were observed among the different study situations (Table 3).
DiscussionThis study shows, in post-dilution OL-HDF, the comparison between different dialysis flow rates of 300mL/min, 400mL/min, 500mL/min, 600mL/min, and 700mL/min, observing that changes in Qd did not lead to changes in convective volume. In addition, a slight increase was observed in urea clearance, with no changes in the other molecules studied: creatinine, β2-m, myoglobin, and α1-microglobulin. Therefore, it seems reasonable to optimise Qd to values that guarantee an adequate dialysis dose, considering that every 100mL/min reduction in Qd equates to a 16% reduction in dialysate consumption: approximately 6L per hour of dialysis.
On-line HDF is a safe technique that improves intradialytic tolerance11 and increases survival.12–15 The EuDial group redefined HDF as a blood purification therapy combining diffusive and convective solute transport using a high-flux membrane with a KUF (ultrafiltration coefficient) greater than 20mL/h/mmHg/m2 and a sieving coefficient for β2-m greater than 0.6, with an effective convective volume greater than 20% of the total blood volume processed,16 and no specification regarding Qd.
The main limiting factors in achieving high convective volumes are Qb, duration of session, and haemoconcentration. One previous study23 showed that increasing Qb was likely to be the best method to achieve a greater convective volume: for every 50mL/min increase in Qb, the convective volume increased more than half a litre per hour. One subsequent study24 analysed the importance of dialyser surface area. The authors concluded that with the high flux dialysers currently available for OL-HDF modes, choice of dialyser surface area should be considered in the cost effectiveness; when KUF was greater than 45mL/h/mmHg, the differences in both convective volume and clearance capacity were minimal. Increasing the duration of sessions will always be beneficial in achieving a greater convective volume and greater clearance capacity. The present study confirms the null influence that Qd has on convective volume.
Regarding clearance efficiency, only diffusion is affected by Qd. Clearance capacity for small molecules depends mainly on Qb, Qd, and the properties of the membrane (KoA). Clearance capacity for low molecular weight molecules can decrease with the increase in spaces not adequately reached by dialysate, because the yield worsens. Initially, increasing Qd was recommended to avoid this phenomenon, but in both in vitro and in vivo studies,3–5 only slight improvements in clearance were observed with an increase in Qd.
In recent years, the pharmaceutical industry, after studying classic dialysers with magnetic resonance imaging and computed tomography and observing spaces to which dialysate was not adequately distributed, introduced changes in the manufacture of dialysers.6–8 These structural modifications, aimed at changing the arrangement and packing of capillaries to make up the membrane, have optimised dialysate distribution across the membrane, thus improving yield. Following the introduction of these structural modifications, both in vitro6–8 and in vivo9,10 studies have demonstrated that an increase in Qd beyond 600mL/min does not lead to a better clearance capacity in terms of Kt/V,9 KoA, phosphorus, or β2-microglobulin.10 Therefore, the diffusive efficiency conferred by Qd has decreased with the modifications in the dialyser manufacturing process, and it cannot be claimed that an increase in Qd leads to improved clearance. Nonetheless, the prescribing doctor must always individualise the dialysis parameters, including Qd, to achieve a minimum dose of Kt.
One limitation of this study is that it involved only one type of dialyser, with a helixone membrane. Therefore, further studies with different membranes and dialyser characteristics are needed to assess whether these results can be extrapolated or whether Qd should be individualised to each dialyser.
Using previously published data, and after analysing the results of this study, it seems reasonable to dialyse with a Qd of 400mL/min or with a Qd/Qb autoflow of 1.0 when Qb is equal to or greater than 400mL/min. This Qd is sufficient to achieve an adequate clearance capacity, optimising the dialysate used in each session.
ConclusionDialysate flow in OL-HDF does not affect convective volume. A higher Qd results in a slight increase in clearance capacity for urea (diffusion dependent), with no changes for medium and large molecules (convection dependent). It is recommended that Qd to be optimised to the minimum possible that guarantees an adequate dialysis dose (Kt or Kt/V) and allows rationalisation of water and dialysis concentrate consumption. Further studies are needed with different dialysers, to assess it these results can be extrapolated to all dialysers or if it is necessary to individualise Qd to each dialyser.
Conflicts of interestFM has received fees from Amgen, Baxter, Bellco, and Fresenius. The other authors declare no conflicts of interest.
Please cite this article as: Maduell F, Ojeda R, Arias-Guillén M, Fontseré N, Vera M, Massó E, et al. Optimización del flujo del líquido de diálisis en la hemodiafiltración on-line. Nefrologia. 2015;35:473–478.


